15 Top Customer Service Metrics To Track And How To Improve Them

No business can afford to ignore customer service metrics. Measuring these metrics efficiently and correctly can help to improve customer satisfaction. With accurate customer service metrics you’ll end up with more happy customers, your team will hit their key performance indicators, and your company’s bottom line will grow. That's the essence of great customer service!
We’ve put together a list of the top 15 metrics and below we show you how your customer support team can improve them.

Need expert help selecting the right tool?
With one-on-one help, we guide you to your top software options. Narrow down your software search & make a confident choice.
Why Should You Measure Customer Service Performance?
Customer service metrics track your company's effectiveness in satisfying customers. When you measure customer service performance diligently, you can gauge your customer experience and optimize your customer service efforts, resulting in:
- Improved customer loyalty: A whopping 93% of customers say they're more likely to be repeat customers due to excellent customer service.
- Lower support cost: A positive customer experience can reduce support costs by up to 33%.
- Improved financial performance: Leaders in customer experience generate financial returns 3.4 times higher than laggards.
Types of Customer Service Metrics
Customer service metrics fall into two main categories: operational and experiential. Let's take a closer look:
- Operational data focus internally and measure your customer service team's efficiency. Examples include average handle time, first response time, and contact resolution rate. The more efficient your customer service team is, the better the customer experience is. For example, rapid first responses combined with high resolution rates can greatly improve customer experiences.
- Experiential data focus externally and measure your customers' emotions and satisfaction. Examples include Net Promoter Score, Customer Satisfaction Score, and Customer Effort Score. This type of data is essential to see how your team is performing in the client’s eyes. Based on the results you see, you’ll be able to pinpoint areas that need improvement or processes that are working well.
Top 15 Customer Experience Metrics to Track and Improve
There’s a lot that goes into a customer’s experience, you know that. Below, we’ve listed 15 of the most important metrics. They’re on this list because they have the most impact on customer satisfaction and loyalty. From NPS surveys to resolution rates, you should focus on measuring and improving these KPIs.


Experiential Data
Net Promoter Score (NPS)
NPS measures customer satisfaction. To calculate it, ask your customers one question: "How likely are you to recommend our brand to your friends using a scale of 0 to 10?" Segment the respondents into three groups based on their answers:
- Promoters: Score 9 or 10
- Passives: Score 7 or 8
- Detractors: Score 0 to 6
Deduct the percentage of Detractors from that of Promoters to get your NPS.
How to improve: Give customers the opportunity to explain why they gave the score they did. Find out what delighted them, what irked them, and which efforts went unnoticed. Use your findings to develop a plan to turn Detractors into Promoters.

Customer Effort Score (CES)
CES measures the effort level it takes your customers to resolve an issue. For example, if a customer’s issue centers on a faulty product, rapid first response by your agents coupled with a speedy resolution results in low effort on the customer’s part. CES is typically measured on a rating scale.
To calculate CES, ask your customers to rate their ability to find solutions for their problems, from 1 (very easy) to 10 (impossible). ?" The average of all responses is your CES.
How to improve: Follow up with customers to understand their pain points. Streamline your service options to make your customers’ lives easier.
Customer Satisfaction Score (CSAT)
CSAT score measures your customers' satisfaction with your product through customer satisfaction surveys. It's similar to NPS, but while NPS measures customers' happiness with a brand, CSAT focuses on a single product or service.
To calculate CSAT, ask customers this: "On a scale of 1 (not satisfied) to 5 (very satisfied), how satisfied are you with our product/service?" The percentage who answer 4 or 5 is your CSAT.
How to improve: Include an open-ended question in your customer satisfaction survey to let customers give more context for their answers. Mine their responses to find ways to improve your product or service experience.
Operational Data
Customer Churn
Churn is the proportion of your customers who've stopped doing business with you over a specific period. Calculating customer churn can be tricky because you may not track customers individually. While some software uses algorithms to predict churn, the formula below is pretty handy for generating an estimate.
Divide the number of customers you lost over a specific amount of time, such as one month, by the number of customers you had at the beginning of that period. Multiply that number by 100—that’s your churn rate.
How to improve: Contact churned customers to understand their reasons for leaving you. Analyze churned customer feedback to identify the common reasons for churn and improve your services and support experience accordingly.
Overall Resolution Rate
This metric is the percentage of customer issues resolved. It gauges your team's ability to keep customers happy.
To measure your overall resolution rate, divide the number of resolved issues by the total number of issues.
How to improve: Begin by reviewing which types of issues remain unresolved for long periods of time. By focusing on the more challenging issues, you can identify processes and practices that need to be improved.
First Contact Resolution Rate
Resolving a customer issue is good, but fixing it on the first contact is better. As charming as your agents may be, your customers don't want to call them repeatedly.
To measure this metric, divide the number of customer requests resolved on first contact by the total number of issues.
How to improve: Examine your customer service process to understand why some issues require more than one contact to resolve. Improve your support team workflow and training to streamline the customer journey and reduce wait times.
Ticket Reopens
When you resolve a customer's problem, you want to do it for good. The last thing anyone wants is for customers to come knocking again because they're not satisfied with the original resolution. Ticket reopens measures the number of attempts it takes to solve a customer's issue.
How to improve: A high number of ticket reopen rate can have multiple causes, but it may mean your agents are closing tickets prematurely. Invest in better training to avoid this problem, or determine if some of the solutions offered aren’t cutting it for your customers.
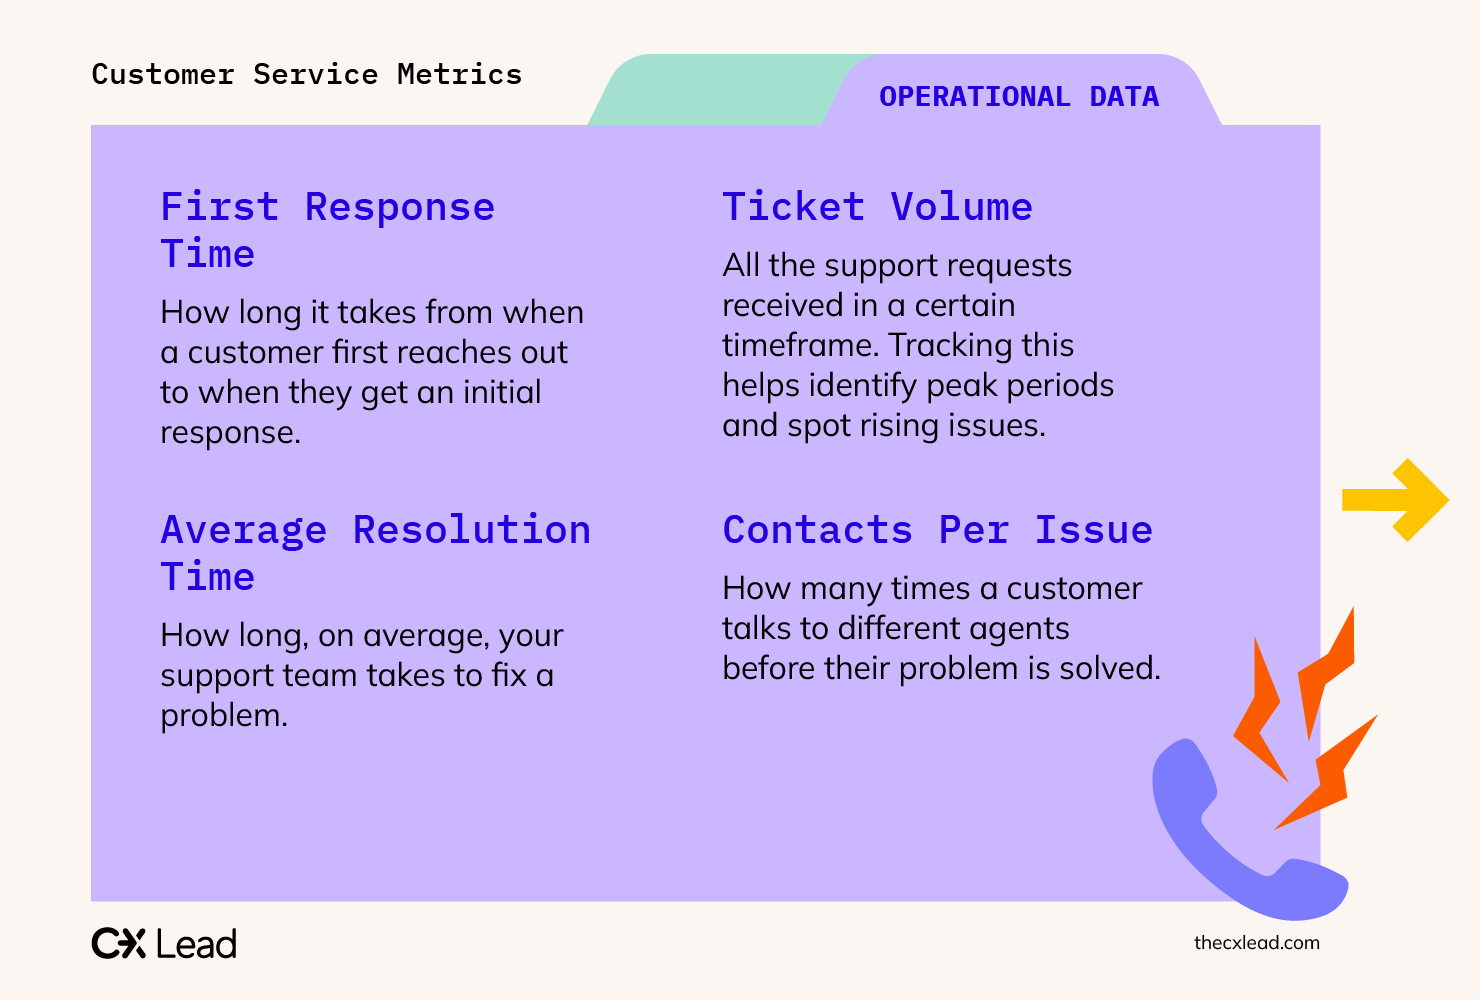
First Response Time
This metric is the total time between a customer's first contact with your support staff and the first reply they receive. While faster responses are always better, the benchmarks for what constitute a reasonable response time may vary for different channels. For example, your target first response times may be:
- Phone Call: 5 minutes
- Email: 24 hours
- Live chat: Immediate
- Social media: 3 hours
How to improve: Invest in staff training to improve team performance and expand capacity if necessary. Implement automated solutions, such as chatbots, as needed to speed up reply times.
Average Resolution Time
This metric is the average time frame your support team takes to resolve an issue. It measures the efficiency of your service team when responding to support requests.
How to improve: Develop a knowledge base to help your agents solve problems quicker. Provide continuous training to upgrade their skills.
Ticket Volume
This is the total number of support tickets created in a specific period, such as a day or week. You can track it over time to identify your busiest times and detect spikes in volume to pinpoint emerging problems. By knowing which times are the busiest, you can also plan to increase the number of customer service agents that are available during those times.
How to improve: Create a self-help service portal and promote it as part of your customer service strategy. Publish articles and videos to your portal to assist customers in solving their problems themselves, reducing the need to contact customer service.
Contacts Per Issue
People don't like to be bounced around between reps when contacting customer support. This metric measures a customer's number of interactions with your agents before resolving their issue.
How to improve: Focus on the outlier issues that require a lot of interactions to resolve. Enhance your workflow and training to reduce the number of contacts. You should also consider creating an internal note system to make case handoffs between agents that much easier.
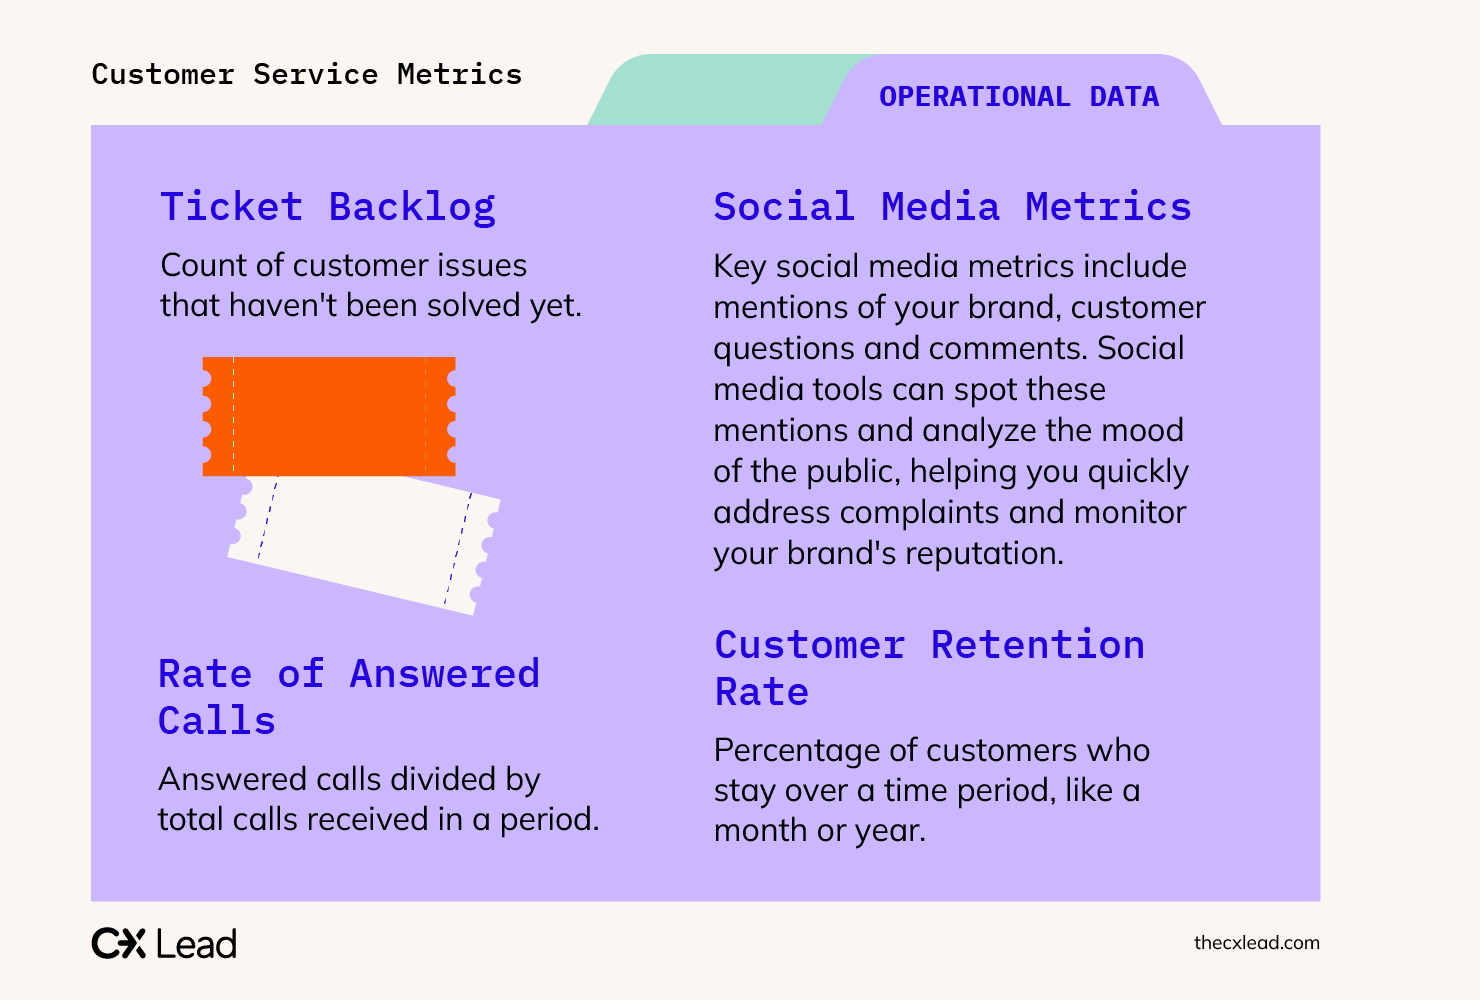
Ticket Backlog
The number of unresolved customer issues is your ticket backlog. Keep this down, or risk annoying your customers. Track your backlog over time to see if it's growing or shrinking.
Help desk software keeps a continuously updated backlog count, or you can track it manually using a spreadsheet.
How to improve: If your backlog grows consistently over time, you may need to hire more support agents. Implementing an automated ticketing system or self-service portal can also help take some of the pressure off.
Customer Retention Rate
It's more expensive to attract new customers than to keep existing ones, so retaining current clients is critical to any business. Customer retention rate is the proportion of existing customers who remain after a specific period, such as a month or year.
How to improve: Implement cross-selling campaigns to increase the number of services you supply to each customer, making them more reliant on you. Create loyalty programs to strengthen your customer relationships or recurring subscription plans to make staying with your company the default choice.
Rate of Answered Calls
Customers don't like to be ignored. The rate of answered calls measures your support team's ability to handle customer queries. A low rate can frustrate your customers and wreak havoc on your retention rate.
To calculate this metric, divide the number of calls answered by the total number of calls received in a given period.
How to improve: A consistently low rate may mean your support team is understaffed, so you need to hire more agents. Implementing customer service software to expand call handling capacity can also help.
Social Media Metrics
Many people turn to social media to voice their opinions about brands—both good and bad. Top social media metrics include brand mentions, questions, comments, and public sentiment.
Social media management software can identify brand mentions and uses AI to analyze public sentiment, enabling you to respond to complaints quickly and track changes in your brand image.
How to improve: Deploy a social media management team to respond to complaints and answer questions on social media. (This is much easier with the use of a social media management tool, in which the team can use social listening dashboards to monitor conversations about your brand.) Develop a content strategy to develop and post online articles, videos, and images on your social media channels to build brand image.
Next Steps
To learn more, check out our articles 10 Best Free Customer Service Software , 10 Best Online Survey Software, and The Importance Of Customer Interviews And How To Conduct Them.
Need expert help selecting the right Customer Service Software?
If you’re struggling to choose the right software, let us help you. Just share your needs in the form below and you’ll get free access to our dedicated software advisors who match and connect you with the best vendors for your needs.
Frequently Asked Questions
What are customer service metrics?
Customer service metrics are quantitative measures used to gauge the efficiency, effectiveness, and satisfaction levels of customer service operations. These metrics help businesses understand how well they are meeting customer needs and where improvements can be made.
Why are customer service metrics important?
These metrics are crucial because they provide insights into customer satisfaction, agent performance, and overall service quality. Tracking these metrics helps businesses identify areas for improvement, enhance customer experience, and ultimately drive growth and profitability.
What are some common customer service metrics?
Common metrics include Average Handle Time (AHT), First Contact Resolution (FCR), Customer Satisfaction Score (CSAT), Net Promoter Score (NPS), and Service Level Agreement (SLA) adherence. See above for a more complete list!
How can businesses improve their customer service metrics?
Improving customer service metrics involves training and empowering service agents, implementing efficient processes, using customer feedback to make improvements, and leveraging technology like CRM systems for better service management.
Can customer service metrics vary by industry?
Yes, certain metrics may be more relevant or prioritized differently depending on the industry. For instance, in fast-paced industries like tech support, AHT might be more critical, while in hospitality, CSAT might take precedence. The SaaS industry typically leans more towards the former, especially with more technical B2B products.
Are there any tools or software recommended for tracking customer service metrics?
Yes! A variety of customer service solutions assist with collecting and tracking customer service metrics. Some call center solutions have similar capabilities. Lastly, customer analytics software can provide more comprehensive data and service metrics, though often require initial integration.
How do customer service metrics impact the overall business?
Strong customer service metrics typically correlate with higher customer satisfaction, loyalty, and retention, which can lead to increased sales and positive word-of-mouth, benefiting the business's bottom line and reputation.
How do digital channels affect customer service metrics?
Digital channels like social media, live chat, and email can offer faster and more convenient options for customers, potentially improving metrics like response time and satisfaction. Consider each of these channels as another tool in your CX toolbox.