

Power-BI-Bewertung: Vor- und Nachteile, Funktionen & Preise
Power BI unterstützt Ihr Team mit intuitiver Datenvisualisierung und Integration und ist damit eine der besten Optionen für umsetzbare Erkenntnisse.

Wir bewerten Tools unabhängig; Provisionen helfen, unsere Tests zu finanzieren. Siehe unsere Transparenzrichtlinie und unsere Methodik.
Power BI is a big data customer analytics platform for teams that need to turn large volumes of customer data into interactive dashboards and reports. If your organization already runs on Microsoft tools, it's the first place I'd look. Power BI's native integration with Excel, Azure, and Microsoft Teams gives it a clear advantage over Tableau for teams inside the Microsoft ecosystem—and it typically comes at a lower cost, without sacrificing depth on the analytics side.
Power BI Evaluation Summary

4.8/5
- From $14/user/month (billed annually)
- Free plan available
Warum Sie unseren Software-Empfehlungen vertrauen können
6,700+
Reviews
20
Industry experts
16+
Evaluation factors
14
Years
Unser Team testet und bewertet Software seit 2012. Als CX-Führungskräfte selbst wissen wir, wie schwierig – und wichtig – es ist, die richtige Software auszuwählen.
Für diesen Leitfaden haben wir Tools mithilfe von praktischen Tests und unabhängiger Recherche bewertet und dabei unsere Bewertungskriterien angewendet.
Unsere Bewertungen spiegeln unser menschliches redaktionelles Urteilsvermögen wider, keine Verkaufsstrategie.
 Gui DrusinaCreative Director
 Tim FisherVP of AI
Power BI Overview
Pros
- You can create detailed and interactive data visualizations.
- Power BI integrates well with Microsoft products, enhancing workflow.
- It offers robust data connectivity options for varied data sources.
Cons
- Users may face a steep learning curve initially.
- The interface can be overwhelming for new users.
- Customer support might not always be responsive or helpful.
Is Power BI Right For Your Needs?
Who Would be a Good Fit for Power BI?
Power BI is ideal for data-driven teams in industries like finance and retail where visual insights are crucial. If your work involves analyzing large datasets and generating detailed reports, Power BI's interactive dashboards and robust data connectivity make it a great fit. Marketing teams can also leverage its capabilities to track campaign performance and sales trends effectively. This business intelligence tool is especially valuable for businesses already using Microsoft products, as it integrates seamlessly, enhancing your team's productivity.
- Financial AnalystsPower BI's detailed visualizations help you track and forecast financial trends accurately.
- Retail CompaniesIts data connectivity options allow you to analyze sales data from various sources efficiently.
- Marketing TeamsYou can measure campaign performance and customer engagement through its interactive dashboards.
- Data ScientistsAdvanced data modeling features support complex data analysis and insights.
- Healthcare ProvidersVisualize patient data and treatment outcomes for better decision-making.
- IT DepartmentsMonitor and visualize system performance and network analytics effectively.
Who Would be a Bad Fit for Power BI?
Small businesses or teams without dedicated data analysts might struggle with Power BI's complexity and steep learning curve. If your team lacks technical expertise, the interface can be overwhelming and time-consuming to navigate. Startups or freelance professionals who need quick insights without in-depth analysis or advanced features might find simpler tools more suitable. Additionally, if your work doesn't involve frequent use of Microsoft products, you might not fully benefit from Power BI's integration capabilities.
- FreelancersPower BI's complexity may not be necessary for simple data tasks.
- StartupsThe steep learning curve can be a barrier for quick decision-making.
- Non-technical TeamsLack of technical skills can make navigating the interface challenging.
- Small BusinessesThe visualization tool might be too robust for limited data analysis needs.
- Artistic TeamsVisual data representation may not align with creative work requirements.
- Temporary ProjectsThe time investment in learning Power BI may not be justified for short-term projects.
Core Features
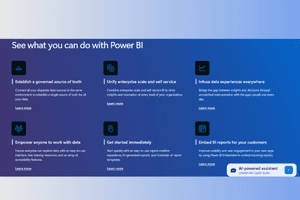
Data Visualization: Power BI lets you turn complex data into clear, interactive visuals. You can create reports that make insights easy to understand and share with your team.
Dashboard Creation: Build custom dashboards to track your key metrics in real time. This feature helps you keep your team informed and aligned with your goals.
Data Connectivity: Connect to a wide range of data sources to gather the information you need. From Excel spreadsheets to cloud services, Power BI supports diverse data inputs.
Data Modeling: Use advanced data modeling tools to structure and analyze your data. This allows you to create accurate predictions and insights for strategic decisions.
Collaboration Tools: Share reports and dashboards with your team seamlessly. Power BI’s collaboration features ensure everyone stays on the same page.
Mobile Access: Access your data and reports on the go with Power BI's mobile app. This keeps you connected to your analytics wherever you are.

Ease of Use
Power BI can be daunting for new users due to its complex interface and vast array of features. While it's powerful, you might find the learning curve steep, especially if your team lacks technical expertise. However, once you get the hang of it, the ability to create detailed visuals and dashboards becomes a breeze. Business users appreciate the flexibility it offers, though it may take time to fully leverage its capabilities.
Power BI Specs
- A/B Testing: Yes
- Access Management: No
- Analytics: Yes
- API: Yes
- Conversion Tracking: Yes
- Custom Reports: No
- Customer Management: Yes
- Dashboards: Yes
- Data Export: Yes
- Data Import: Yes
- Data Mining: No
- Data Visualization: Yes
- External Integrations: Yes
- Forecasting: Yes
- Inventory Tracking: Yes
- Keyword Tracking: Yes
- Link Tracking: Yes
- Multi-User: Yes
- Notifications: Yes
- Project Management: No
- Reports: Yes
- Scenario Planning: No
- SEO: No
- Supplier Management: Yes
- Visualization: Yes


