

Power BI Review: Pros, Cons, Features & Pricing
Power BI empowers your team with intuitive data visualization and integration, making it a top choice for actionable insights.

We review tools independently, and commissions help fund our testing. See our transparency policy, our methodology, or suggest a tool.
Power BI is a big data customer analytics platform for teams that need to turn large volumes of customer data into interactive dashboards and reports. If your organization already runs on Microsoft tools, it's the first place I'd look. Power BI's native integration with Excel, Azure, and Microsoft Teams gives it a clear advantage over Tableau for teams inside the Microsoft ecosystem—and it typically comes at a lower cost, without sacrificing depth on the analytics side.
Power BI Evaluation Summary

4.8/5
- From $14/user/month (billed annually)
- Free plan available
Why Trust Our Software Recommendations
6,700+
Reviews
20
Industry experts
16+
Evaluation factors
14
Years
Our team has been testing and reviewing software since 2012. As CX leaders ourselves, we know how difficult—and important—it is to choose the right software.
For this guide, we evaluated tools using hands-on testing and independent research, scoring tools using our selection criteria.
Our reviews reflect our human editorial judgment, not a sales pitch.
 Gui DrusinaCreative Director
 Tim FisherVP of AI
Power BI Overview
Pros
- You can create detailed and interactive data visualizations.
- Power BI integrates well with Microsoft products, enhancing workflow.
- It offers robust data connectivity options for varied data sources.
Cons
- Users may face a steep learning curve initially.
- The interface can be overwhelming for new users.
- Customer support might not always be responsive or helpful.
Is Power BI Right For Your Needs?
Who Would be a Good Fit for Power BI?
Power BI is ideal for data-driven teams in industries like finance and retail where visual insights are crucial. If your work involves analyzing large datasets and generating detailed reports, Power BI's interactive dashboards and robust data connectivity make it a great fit. Marketing teams can also leverage its capabilities to track campaign performance and sales trends effectively. This business intelligence tool is especially valuable for businesses already using Microsoft products, as it integrates seamlessly, enhancing your team's productivity.
- Financial AnalystsPower BI's detailed visualizations help you track and forecast financial trends accurately.
- Retail CompaniesIts data connectivity options allow you to analyze sales data from various sources efficiently.
- Marketing TeamsYou can measure campaign performance and customer engagement through its interactive dashboards.
- Data ScientistsAdvanced data modeling features support complex data analysis and insights.
- Healthcare ProvidersVisualize patient data and treatment outcomes for better decision-making.
- IT DepartmentsMonitor and visualize system performance and network analytics effectively.
Who Would be a Bad Fit for Power BI?
Small businesses or teams without dedicated data analysts might struggle with Power BI's complexity and steep learning curve. If your team lacks technical expertise, the interface can be overwhelming and time-consuming to navigate. Startups or freelance professionals who need quick insights without in-depth analysis or advanced features might find simpler tools more suitable. Additionally, if your work doesn't involve frequent use of Microsoft products, you might not fully benefit from Power BI's integration capabilities.
- FreelancersPower BI's complexity may not be necessary for simple data tasks.
- StartupsThe steep learning curve can be a barrier for quick decision-making.
- Non-technical TeamsLack of technical skills can make navigating the interface challenging.
- Small BusinessesThe visualization tool might be too robust for limited data analysis needs.
- Artistic TeamsVisual data representation may not align with creative work requirements.
- Temporary ProjectsThe time investment in learning Power BI may not be justified for short-term projects.
How We Test & Score Tools
We’ve spent years building, refining, and improving our software testing and scoring system. The rubric is designed to capture the nuances of software selection and what makes a tool effective, focusing on critical aspects of the decision-making process.
Below, you can see exactly how our testing and scoring works across seven criteria. It allows us to provide an unbiased evaluation of the software based on core functionality, standout features, ease of use, onboarding, customer support, integrations, customer reviews, and value for money.
Core Functionality (25% of final scoring)
The starting point of our evaluation is always the core functionality of the tool. Does it have the basic features and functions that a user would expect to see? Are any of those core features locked to higher-tiered pricing plans? At its core, we expect a tool to stand up against the baseline capabilities of its competitors.
Standout Features (25% of final scoring)
Next, we evaluate uncommon standout features that go above and beyond the core functionality typically found in tools of its kind. A high score reflects specialized or unique features that make the product faster, more efficient, or offer additional value to the user.
We also evaluate how easy it is to integrate with other tools typically found in the tech stack to expand the functionality and utility of the software. Tools offering plentiful native integrations, 3rd party connections, and API access to build custom integrations score best.
Ease of Use (10% of final scoring)
We consider how quick and easy it is to execute the tasks defined in the core functionality using the tool. High scoring software is well designed, intuitive to use, offers mobile apps, provides templates, and makes relatively complex tasks seem simple.
Onboarding (10% of final scoring)
We know how important rapid team adoption is for a new platform, so we evaluate how easy it is to learn and use a tool with minimal training. We evaluate how quickly a team member can get set up and start using the tool with no experience. High scoring solutions indicate little or no support is required.
Customer Support (10% of final scoring)
We review how quick and easy it is to get unstuck and find help by phone, live chat, or knowledge base. Tools and companies that provide real-time support score best, while chatbots score worst.
Customer Reviews (10% of final scoring)
Beyond our own testing and evaluation, we consider the net promoter score from current and past customers. We review their likelihood, given the option, to choose the tool again for the core functionality. A high scoring software reflects a high net promoter score from current or past customers.
Value for Money (10% of final scoring)
Lastly, in consideration of all the other criteria, we review the average price of entry level plans against the core features and consider the value of the other evaluation criteria. Software that delivers more, for less, will score higher.
Core Features
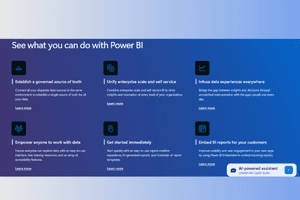
Data Visualization: Power BI lets you turn complex data into clear, interactive visuals. You can create reports that make insights easy to understand and share with your team.
Dashboard Creation: Build custom dashboards to track your key metrics in real time. This feature helps you keep your team informed and aligned with your goals.
Data Connectivity: Connect to a wide range of data sources to gather the information you need. From Excel spreadsheets to cloud services, Power BI supports diverse data inputs.
Data Modeling: Use advanced data modeling tools to structure and analyze your data. This allows you to create accurate predictions and insights for strategic decisions.
Collaboration Tools: Share reports and dashboards with your team seamlessly. Power BI’s collaboration features ensure everyone stays on the same page.
Mobile Access: Access your data and reports on the go with Power BI's mobile app. This keeps you connected to your analytics wherever you are.

Ease of Use
Power BI can be daunting for new users due to its complex interface and vast array of features. While it's powerful, you might find the learning curve steep, especially if your team lacks technical expertise. However, once you get the hang of it, the ability to create detailed visuals and dashboards becomes a breeze. Business users appreciate the flexibility it offers, though it may take time to fully leverage its capabilities.
Power BI Specs
- A/B Testing: Yes
- Access Management: No
- Analytics: Yes
- API: Yes
- Conversion Tracking: Yes
- Custom Reports: No
- Customer Management: Yes
- Dashboards: Yes
- Data Export: Yes
- Data Import: Yes
- Data Mining: No
- Data Visualization: Yes
- External Integrations: Yes
- Forecasting: Yes
- Inventory Tracking: Yes
- Keyword Tracking: Yes
- Link Tracking: Yes
- Multi-User: Yes
- Notifications: Yes
- Project Management: No
- Reports: Yes
- Scenario Planning: No
- SEO: No
- Supplier Management: Yes
- Visualization: Yes


