

20 Customer Service Metrics To Track & Improve

Customer service metrics show where your support experience is working, where customers encounter friction, and where your team needs more capacity. Here are 20 metrics worth tracking, with formulas, practical benchmarks, and clear ways to improve each one.
What Are Customer Service Metrics?
Customer service metrics are quantitative measures of support quality, efficiency, customer satisfaction, and loyalty. Together, they help you assess how quickly your team responds, how effectively it resolves issues, how customers feel about the experience, and what that service costs the business.
No single number tells the whole story. A low average handle time can look efficient while hiding rushed conversations; a high CSAT score can conceal a low survey response rate. The most useful dashboard balances customer outcomes with operational performance and cost.

Why Should You Measure Customer Service Performance?
Tracking customer service performance helps you:
- Spot customer friction: Rising contacts per issue, repeat tickets, or effort scores can reveal broken processes before they drive churn.
- Improve staffing and workflows: Ticket volume, backlog, response time, and handle time show when demand exceeds capacity.
- Protect loyalty and revenue: CSAT, NPS, retention, and churn connect individual service experiences to longer-term customer behavior.
- Evaluate automation responsibly: Metrics can show whether AI is genuinely resolving issues or simply moving work elsewhere.
Types of Customer Service Metrics
Customer service metrics fall into two broad groups:
- Experiential metrics measure how customers perceive the interaction or relationship. NPS, CES, CSAT, agent ratings, and social sentiment belong here.
- Operational metrics measure how efficiently and effectively the support function handles demand. Examples include response time, resolution rate, AHT, backlog, and SLA compliance.
You need both. Operational data explains what happened; experiential data helps explain how it felt.
Customer Service Metrics Comparison Table
Benchmarks are starting points, not universal standards. Channel, industry, issue complexity, customer segment, operating hours, and measurement method all affect the result. Where no credible cross-industry standard exists, the table gives a practical internal target instead.
| Metric | Formula | Benchmark or practical target |
|---|---|---|
| Net Promoter Score (NPS) | % Promoters − % Detractors | Above 0 is positive; compare by industry and survey method |
| Customer Effort Score (CES) | Sum of ratings ÷ responses | Improve against your own baseline; a higher score is better on a 1–7 “easy” scale |
| Customer Satisfaction Score (CSAT) | Satisfied responses ÷ all responses × 100 | Roughly 75%–85% is a useful general reference range |
| Customer churn rate | Customers lost ÷ customers at start × 100 | Lower than your prior comparable period and peer segment |
| Overall resolution rate | Resolved issues ÷ total issues × 100 | Aim for a consistently rising rate without premature closures |
| First contact resolution (FCR) | Issues resolved on first contact ÷ eligible issues × 100 | 70%–79% is good for many call centers; 80%+ is world-class |
| Ticket reopen rate | Reopened tickets ÷ resolved tickets × 100 | Under 5% is a useful starting target; validate by issue type |
| First response time (FRT) | Total time to first response ÷ tickets | Set by channel and promised service level |
| Average resolution time | Total time to resolution ÷ resolved tickets | Improve against the median for the same channel and issue type |
| Average handle time (AHT) | (Talk + hold + after-contact work) ÷ contacts | About 5–10 minutes is common for calls; quality matters more than speed alone |
| Ticket volume | Tickets received in period | Forecast range; investigate material variance from expected demand |
| Contacts per issue | Total contacts ÷ resolved issues | As close to 1 as practical |
| Ticket backlog | Open overdue tickets at period end | Keep within staffed capacity and reduce aging tickets |
| Customer retention rate | (Ending customers − new customers) ÷ starting customers × 100 | Improve against the same cohort and period |
| Answered call rate | Answered calls ÷ offered calls × 100 | 95%+ is a useful target when paired with wait-time and abandonment data |
| SLA compliance rate | Tickets meeting SLA ÷ SLA-eligible tickets × 100 | 90%+ is a common starting target; contractual commitments take priority |
| Self-service deflection rate | Issues solved without an agent ÷ self-service sessions × 100 | Establish by intent; improve without increasing repeat contact or dissatisfaction |
| Cost per contact | Support operating cost ÷ handled contacts | Reduce by channel and issue type without harming quality |
| Agent rating | Sum of post-contact ratings ÷ responses | Track trend, distribution, and response rate—not the average alone |
| Social media service metrics | Metric-specific; e.g., responses ÷ service mentions × 100 | Meet channel response commitments and improve sentiment over time |
20 Customer Service Metrics to Track and Improve
I've divided the metrics below by their categories: experiential and operational metrics.
Experiential Metrics
1. Net Promoter Score (NPS)
NPS estimates customer loyalty by asking how likely a customer is to recommend your brand on a scale from 0 to 10. Respondents are grouped as Promoters (9–10), Passives (7–8), and Detractors (0–6).
- Formula: NPS = % Promoters − % Detractors
- Benchmark: NPS ranges from −100 to 100. A score above zero means you have more Promoters than Detractors, but the meaningful comparison is with companies in your industry using a similar survey method.
How to improve: Add an open-text follow-up, segment the responses by journey and customer type, and close the loop with Detractors. Use the comments to fix recurring causes—not merely to raise the score.
2. Customer Effort Score (CES)
CES measures how easy or difficult customers found an interaction, such as getting an answer, completing a return, or resolving a technical problem. Use one consistent scale and word the question so it is clear whether a high or low score is better.
- Formula: CES = Sum of all effort ratings ÷ Number of responses
- Benchmark: There is no reliable universal CES benchmark because scales and question wording vary. On a 1–7 scale where 7 means “very easy,” use your current score as the baseline and aim for a sustained increase.
How to improve: Remove unnecessary handoffs, simplify authentication, preserve context across channels, and review the journeys with the lowest scores.
3. Customer Satisfaction Score (CSAT)
CSAT measures satisfaction with a specific interaction, product, or service. A common survey asks customers to rate their satisfaction from 1 to 5 and counts ratings of 4 or 5 as satisfied.
- Formula: CSAT = Satisfied responses ÷ Total responses × 100
- Benchmark: A general reference range of 75%–85% can be useful, but compare like with like: post-chat CSAT and relationship-level CSAT are not interchangeable.
How to improve: Survey close to the interaction, monitor response rate, and connect low scores to ticket reasons, wait time, resolution, and agent behavior. Include an optional comment field for context.
Operational Metrics
4. Customer Churn
Customer churn is the share of customers who stop doing business with you during a defined period.
- Formula: Churn rate = Customers lost during period ÷ Customers at start of period × 100
- Benchmark: Churn varies widely by business model and customer segment. Compare the same cohort, contract type, and period, then aim to reduce avoidable service-related churn.
How to improve: Ask departing customers why they left, tag service-related causes, and identify whether churn clusters around onboarding, billing, outages, or unresolved cases. Identify the common reasons for churn and improve your customer service and support experience accordingly.
5. Overall Resolution Rate
Overall resolution rate shows the percentage of received issues your team resolves during a defined period.
- Formula: Resolution rate = Resolved issues ÷ Total issues received × 100
- Benchmark: There is no universal target because ticket mix and reporting windows differ. Establish a baseline by queue and issue type, and watch for a rising rate without a simultaneous rise in reopens.
How to improve: Review unresolved and aging tickets, clarify ownership, and give agents better escalation paths, decision rights, and knowledge resources.
6. First Contact Resolution Rate (FCR)
FCR measures the share of eligible issues resolved during the customer’s first interaction, with no repeat contact needed for the same problem.
- Formula: FCR = Issues resolved on first contact ÷ Eligible issues × 100
- Benchmark: SQM Group places a good call-center FCR at 70%–79% and world-class performance at 80% or higher, while noting that complexity and measurement method matter.
How to improve: Analyze repeat-contact reasons, equip agents to make more decisions, improve knowledge search, and fix upstream policies that force customers to contact you again.
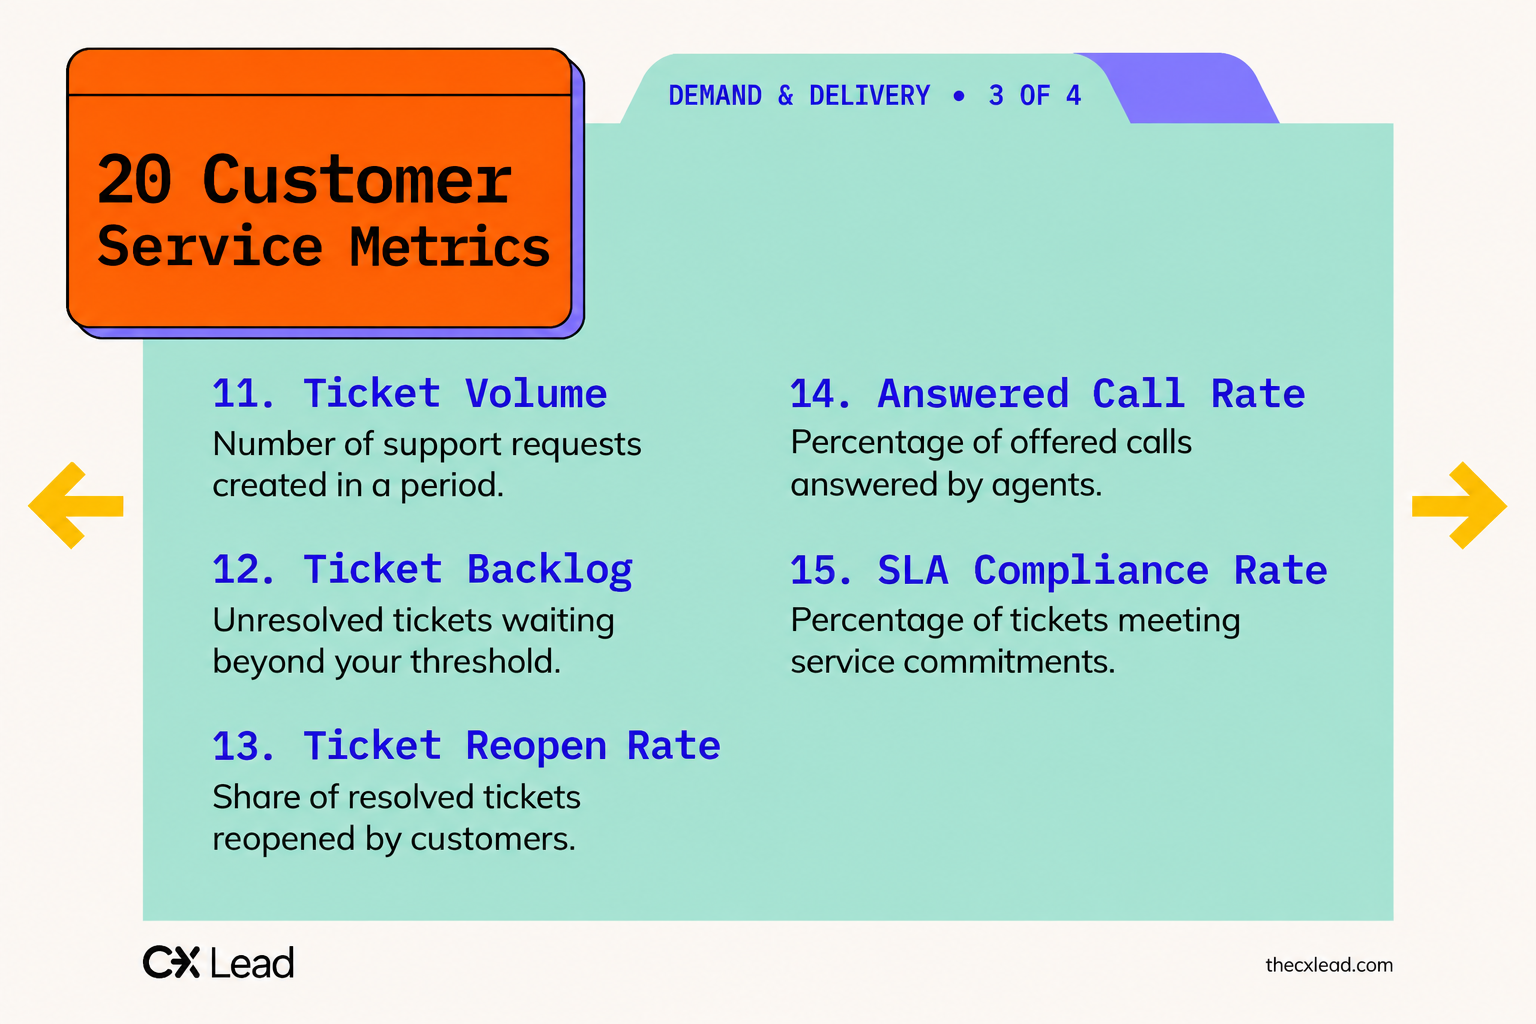
7. Ticket Reopen Rate
Ticket reopen rate shows how often a supposedly resolved issue returns to an active state. A high rate may indicate premature closures, incomplete solutions, unclear communication, or defects that recur.
- Formula: Ticket reopen rate = Reopened tickets ÷ Resolved tickets × 100
- Benchmark: Under 5% is a useful starting target for many teams, but establish separate baselines for simple requests and complex technical cases.
How to improve: Audit reopened tickets, revise closure criteria, confirm resolution with customers, and coach agents on the most common incomplete fixes.
8. First Response Time
FRT is the time between a customer submitting an inquiry and receiving the first meaningful response from your team. Automated acknowledgements should not count unless they provide a useful answer or next step.
- Formula: Average FRT = Total time to first meaningful response ÷ Number of tickets
- Benchmark: Set targets by channel and expectation—for example, immediate routing for live chat, minutes for phone, and hours rather than minutes for email. Your published or contractual service level is the benchmark that matters most.
How to improve: Route by intent and urgency, staff around arrival patterns, use AI to classify and summarize requests, and create approved replies for predictable questions.
9. Average Resolution Time
Average resolution time measures how long it takes to fully resolve an issue after it is created.
- Formula: Average resolution time = Total elapsed resolution time ÷ Resolved tickets
- Benchmark: Because a few long-running cases can distort the mean, track the median and 90th percentile too. Benchmark within the same channel, priority, and issue category.
How to improve: Find the stages where tickets wait, reduce unnecessary transfers and approvals, and strengthen knowledge content for common problems.
10. Average Handle Time (AHT)
AHT measures the average active time spent handling a contact, including talk or interaction time, hold time, and after-contact work.
- Formula: AHT = (Talk time + Hold time + After-contact work) ÷ Number of contacts
- Benchmark: Call-center benchmarks commonly fall around 5–10 minutes, but SQM has reported an average of 589 seconds—just under 10 minutes—across participating centers. Treat that as context, not a universal target.
How to improve: Simplify agent workflows, integrate systems, surface relevant knowledge, and automate summaries and routine data entry. Never reduce AHT by rushing customers; monitor FCR and CSAT alongside it.
11. Ticket Volume
Ticket volume is the number of support requests created in a given period. Segment it by channel, product, issue, customer group, and hour or day to make it actionable.
- Formula: Ticket volume = Count of new tickets during the period
- Benchmark: There is no cross-industry “good” volume. Use a forecast range based on customers, transactions, seasonality, releases, and known events; investigate significant variance.
How to improve: Fix repeat demand at the source, publish self-service content for suitable issues, and use volume patterns to plan staffing.
12. Contacts Per Issue
Contacts per issue measures how many interactions are needed to resolve one customer problem. It captures friction that ticket-based FCR can miss when one issue generates multiple emails, calls, or chats.
- Formula: Contacts per issue = Total related contacts ÷ Resolved issues
- Benchmark: The theoretical ideal is 1. Use your current result by issue type as the baseline and reduce it without lowering solution quality.
How to improve: Preserve context across channels, improve handoff notes, eliminate repeat information requests, and study issues with unusually high contact counts.
13. Ticket Backlog
Ticket backlog is the number of unresolved tickets that remain open beyond your chosen time or service threshold. Backlog age is often more informative than the raw count.
- Formula: Backlog = Count of open tickets older than the defined threshold
- Benchmark: Set a maximum based on staffed capacity and SLA. Track aging buckets—such as under 24 hours, 1–3 days, 4–7 days, and over 7 days—and aim for no overdue high-priority cases.
How to improve: Triage by impact, remove duplicate tickets, create swarming routines for difficult cases, and address sustained capacity gaps. Implementing an automated ticketing system or self-service portal can also help take some of the pressure off.
14. Customer Retention Rate
Customer retention rate is the percentage of existing customers who remain at the end of a period, excluding customers newly acquired during that period.
- Formula: Retention rate = (Customers at end − New customers acquired) ÷ Customers at start × 100
- Benchmark: Retention differs sharply by industry and contract model. Compare consistent customer cohorts and focus on the change in retention among customers who contacted support.
How to improve: Resolve recurring service failures, strengthen onboarding, reach out after severe incidents, and use churn-risk signals to trigger proactive support. You can also create loyalty programs to strengthen your customer relationships or recurring subscription plans to make staying with your company the default choice.
15. Rate of Answered Calls
The answered call rate measures the share of offered calls answered by an agent. Read it with speed of answer and abandonment rate: a call technically answered after a very long wait is not a good experience.
- Formula: Answered call rate = Answered calls ÷ Offered calls × 100
- Benchmark: 95% or higher is a useful operational target for many teams, provided wait time and abandonment remain acceptable. Define consistently whether short abandons are included.
How to improve: Forecast demand by interval, offer callbacks, improve IVR routing, and give customers effective alternatives for simple requests. Implementing customer service software to expand call handling capacity can also help.
16. SLA Compliance Rate
SLA compliance rate measures how often your team meets agreed response or resolution commitments. Calculate response and resolution compliance separately if both are promised.
- Formula: SLA compliance = Tickets meeting SLA ÷ SLA-eligible tickets × 100
- Benchmark: Contractual targets come first. Without one, 90% or higher is a reasonable starting goal, followed by tighter targets for priority customers and critical issues.
How to improve: Add alerts before breaches, route by priority and entitlement, pause clocks only under clearly defined conditions, and conduct root-cause reviews of misses.
17. Self-Service Deflection Rate
Self-service deflection estimates the percentage of customers who use a help center, chatbot, community, or guided workflow and do not need an agent for the same issue.
- Formula: Deflection rate = Self-service sessions without related agent contact ÷ Total self-service sessions × 100
- Benchmark: There is no universal benchmark because “deflection” is defined differently across platforms. Establish targets by customer intent and validate them using repeat-contact, CES, and CSAT data.
How to improve: Build content around high-volume, low-complexity intents. Improve search, connect related articles, and make escalation easy when self-service cannot solve the problem.
18. Cost Per Contact
Cost per contact measures how much it costs to handle one customer interaction. Calculate it by channel and issue type; blended averages can hide expensive workflows.
- Formula: Cost per contact = Total support operating cost ÷ Handled contacts
- Benchmark: Compare consistent cost categories and channels over time. Your goal is a lower cost for equivalent or better resolution, satisfaction, and retention—not simply fewer agent minutes.
How to improve: Reduce avoidable demand, automate suitable work, improve FCR, and route each issue to the least expensive channel capable of resolving it well.
19. Agent Ratings
Agent ratings capture how customers evaluate a support interaction or representative, often with a five-point scale or thumbs-up/thumbs-down question.
- Formula: Average agent rating = Sum of ratings ÷ Number of responses
- Benchmark: Set a baseline using the same survey and channel. Monitor response rate and score distribution, and avoid ranking agents on small samples or cases outside their control.
How to improve: Combine survey feedback with quality reviews and coaching. Look for behaviors associated with strong ratings—clarity, ownership, empathy, and complete resolutions—and incorporate them into training.
20. Social Media Metrics
Social customer service should be measured with a small group of metrics: service mentions, response rate, response time, resolution rate, and sentiment. Vanity metrics such as likes or follower count do not show whether customer problems are being solved.
Formulas:
- Social response rate = Service mentions answered ÷ Service mentions received × 100
- Average social response time = Total time to first response ÷ Responses sent
- Social resolution rate = Resolved social issues ÷ Social issues received × 100
Benchmark: Use your published response commitment and compare sentiment and resolution trends with prior periods. Separate public acknowledgement time from full resolution time.
How to improve: Use social listening to catch untagged mentions, establish escalation rules, move sensitive cases to private channels, and preserve the case history in your CRM.



How AI and Automation Affect Customer Service Metrics
AI can improve FRT by classifying, routing, and acknowledging requests immediately. It can lower AHT by retrieving knowledge, drafting replies, and summarizing interactions, while well-designed bots and self-service tools can increase resolution capacity and deflection.
Software can also be used for conducting surveys and capturing customer feedback automatically.
Those gains need guardrails. A bot may create a fast first response without providing a useful answer, or appear to deflect a ticket that the customer raises again later. Track automated and human-assisted contacts separately, then compare FCR, repeat contact, CES, CSAT, escalation, and cost.
Before deploying automation, capture a baseline. After launch:
- Measure the change by intent and customer group rather than relying on one blended average.
- Review a sample of automated conversations for accuracy, tone, accessibility, privacy, and whether the customer could reach a person when needed.
What Customer Service Metrics Can Miss
Metrics compress complicated experiences into numbers. They may miss the customer’s emotional state, the seriousness of a rare failure, accessibility barriers, unresolved ambiguity, or the effect of company policies an agent cannot change. Survey scores can also overrepresent customers motivated enough to respond.
Pair dashboards with qualitative evidence:
- Read survey comments and support transcripts.
- Listen to calls and review escalations.
- Interview customers after important or difficult journeys.
- Ask agents which policies and systems create recurring friction.
- Track themes, not just isolated anecdotes.
The goal is not to maximize every metric independently. It is to understand the trade-offs and improve the experience as a whole.
How to Choose the Right Customer Service Metrics
Start with the outcome you want to improve.
- If customers wait too long, monitor volume, backlog, FRT, answered call rate, and SLA compliance.
- If they keep returning with the same problem, prioritize FCR, contacts per issue, reopens, CES, and resolution time.
- If costs are rising, pair cost per contact and AHT with CSAT and retention so efficiency does not come at the customer’s expense.
Keep the dashboard small enough to act on. Give every metric an owner, a precise definition, a reporting cadence, and a threshold that triggers investigation. Revisit the set when your channels, customer expectations, or service model change.
Customer Service Metrics FAQ
What are the most important customer service metrics?
For most teams, a balanced starting set is CSAT, CES, FCR, first response time, resolution time, SLA compliance, backlog, and cost per contact. Add retention or churn to connect service performance to a business outcome.
How often should customer service metrics be reviewed?
Operational metrics such as queue volume, SLA risk, and backlog may need daily or real-time monitoring. Review experience and business outcome metrics weekly, monthly, or quarterly depending on response volume and decision cadence.
What is the difference between a metric and a KPI?
A metric is any measurement you track. A KPI is a metric selected as critical to a specific objective. Ticket volume is a metric; it becomes a KPI when controlling demand or staffing capacity is a priority.
Should customer service teams use industry benchmarks?
Yes, but only as context. Industry, channel, customer mix, issue complexity, survey design, and calculation rules can make two organizations’ results incomparable. Your own consistent trend and customer commitments are usually more actionable.
Next Steps
To keep improving your customer experience operations and learn from industry leaders, subscribe to The CX Lead newsletter.


