10 Mejores Alternativas a New Relic en 2026

Lista corta de alternativas a New Relic


Las mejores alternativas integrales a New Relic combinan una monitorización profunda del rendimiento de aplicaciones, observabilidad flexible e integraciones que se adaptan a los flujos de trabajo de tu equipo. Si estás buscando alternativas a New Relic, probablemente necesitas herramientas confiables para rastrear la salud de tus aplicaciones, diagnosticar problemas y soportar entornos complejos sin perder visibilidad ni quedar atado a un proveedor.
Esta lista te ayudará a comparar las principales herramientas de monitorización, conocer sus fortalezas únicas y elegir una plataforma que se adapte a tus requisitos técnicos y objetivos de negocio.
¿Qué es New Relic?
New Relic es una plataforma de monitorización del rendimiento de aplicaciones y observabilidad que se utiliza para rastrear, analizar y optimizar el rendimiento del software tanto en entornos en la nube como locales. Proporciona información en tiempo real sobre la salud de la aplicación, la infraestructura y la experiencia del usuario. Los equipos usan New Relic para detectar problemas, monitorizar sistemas distribuidos y mejorar la confiabilidad recopilando y visualizando métricas, trazas y registros de su pila tecnológica.
Resumen de las mejores alternativas a New Relic
Esta tabla comparativa resume los detalles de precios de mis selecciones principales de alternativas a New Relic para ayudarte a encontrar la mejor opción según tu presupuesto y necesidades empresariales.
| Tool | Best For | Trial Info | Price | ||
|---|---|---|---|---|---|
| 1 | Best for unified log and metric analysis | 7-day free trial + free plan available | From $99/month | Website | |
| 2 | Best for high-cardinality event debugging | Free plan available | From $130/month | Website | |
| 3 | Best for automated application discovery | Free demo available | From $21.20/MVS/month | Website | |
| 4 | Best with AWS ecosystem integration | Free plan available | Pricing upon request | Website | |
| 5 | Best for Microsoft Azure workloads | Free demo available | Pricing upon request | Website | |
| 6 | Best for business transaction monitoring | 15-day free trial available | From $6/CPU core/month (billed annually) | Website | |
| 7 | Best for real-time error tracking | Free plan + free trial + free demo available | From $26/month (billed annually) | Website | |
| 8 | Best with AI-powered root cause analysis | Free demo + 15-day free trial available | From $7/host/month | Website | |
| 9 | Best for cloud-native infrastructure visibility | 14-day free trial available | From $15/host/month (billed annually) | Website | |
| 10 | Best for monitoring hybrid IT environments | 30-day free trial + free demo + free plan availabl | From $199/year | Website |
Why Trust Our Software Reviews
We’ve been testing and reviewing software since 2020. As CX leaders ourselves, we know how critical and difficult it is to make the right decision when selecting software.
We invest in deep research to help our audience make better software purchasing decisions. We’ve tested more than 2,000 tools for different CX use cases and written over 1,000 comprehensive software reviews. Learn how we stay transparent & our software review methodology.
-

SupportYourApp
Visit WebsiteThis is an aggregated rating for this tool including ratings from Crozdesk users and ratings from other sites.4.7 -
Tidio
Visit WebsiteThis is an aggregated rating for this tool including ratings from Crozdesk users and ratings from other sites.4.7 -
Freshdesk
Visit WebsiteThis is an aggregated rating for this tool including ratings from Crozdesk users and ratings from other sites.4.4


Reseñas de alternativas a New Relic
A continuación, tienes mis resúmenes detallados de las mejores alternativas a New Relic que figuran en mi lista corta. Mis reseñas ofrecen una mirada detallada a las características, integraciones y mejores casos de uso de cada plataforma para ayudarte a encontrar la mejor opción para ti.
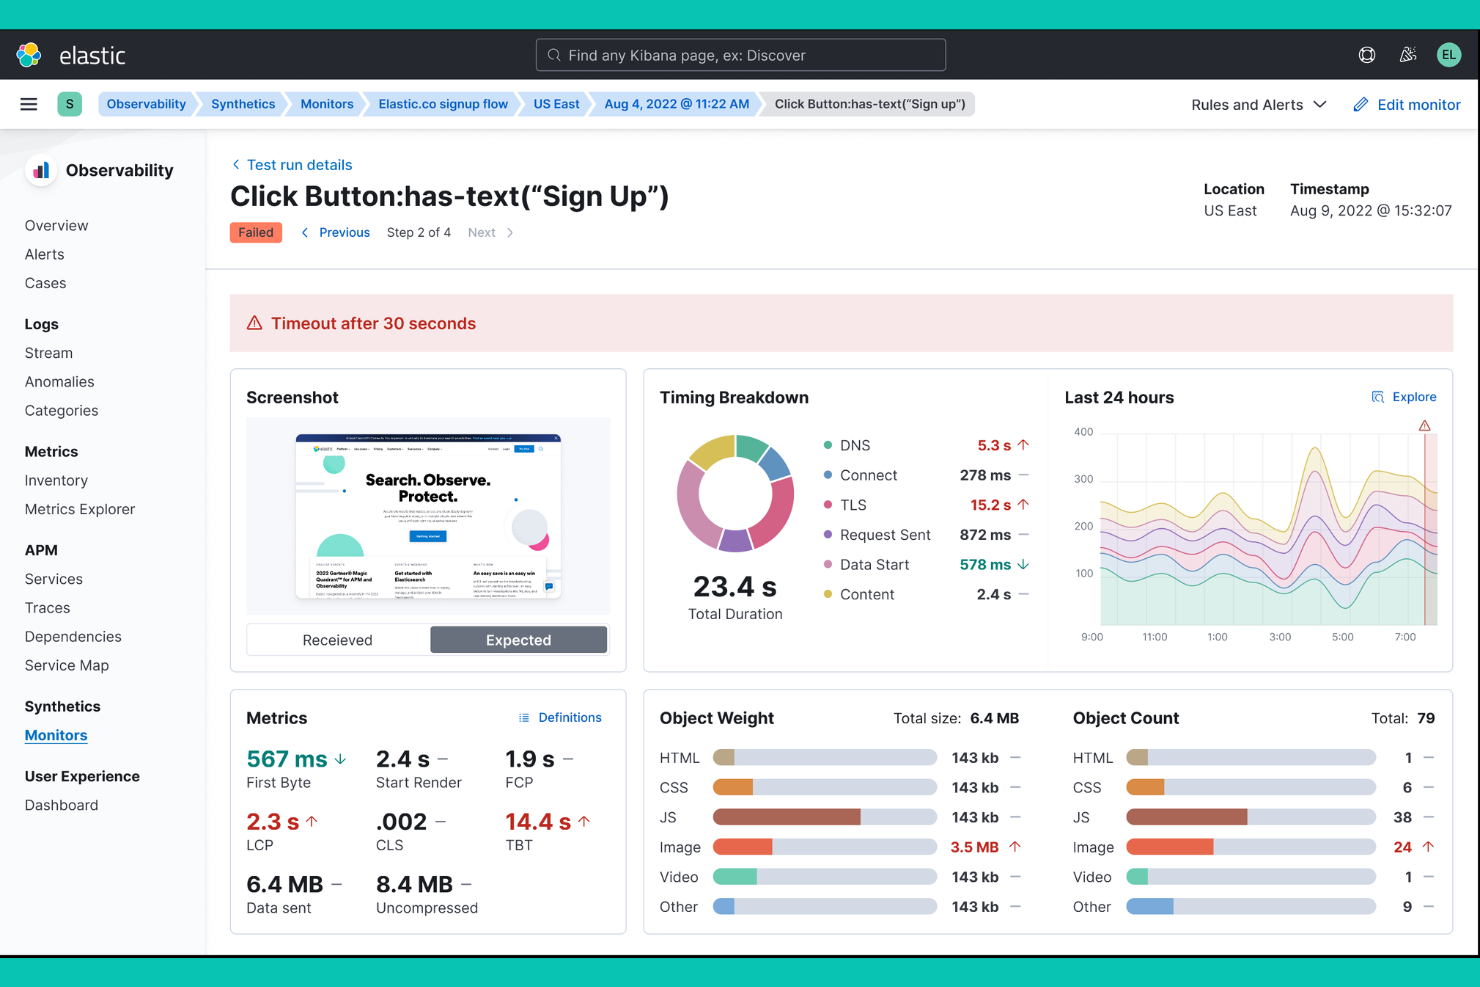
Elastic Observability, built on Elasticsearch, brings together logs, metrics, and traces in a single platform for unified analysis. This solution is a strong fit for engineering teams and IT operations that need to correlate data across complex, distributed environments. Unlike many New Relic alternatives, Elastic Observability emphasizes flexible search, AI-driven anomaly detection, and customizable dashboards for deep troubleshooting.
Why Elastic Observability Is a Good New Relic Alternative
What sets Elastic Observability apart is its unified approach to log and metric analysis across your entire stack. I appreciate how you can ingest, search, and correlate logs, metrics, and traces from multiple sources in one place. The platform’s AI-driven anomaly detection and customizable visualizations help teams quickly pinpoint and investigate issues. For organizations that need deep, flexible observability across distributed systems, Elastic Observability offers a compelling alternative to New Relic.
Elastic Observability Key Features
Some other features that make Elastic Observability stand out include:
- Uptime monitoring: Tracks service availability and response times across endpoints.
- Service map visualization: Displays relationships and dependencies between services in your environment.
- Prebuilt integrations: Connects natively with AWS, Azure, Google Cloud, Kubernetes, and more.
- Role-based access control: Manages user permissions and data access within the platform.
Elastic Observability Integrations
Integrations include AWS, Azure, Google Cloud, Kubernetes, Docker, Kafka, MongoDB, PostgreSQL, Microsoft SQL Server, and Slack.
Pros and Cons
Pros:
- Customizable dashboards and visualizations
- AI-driven anomaly detection for observability data
- Unified search across logs, metrics, and traces
Cons:
- Limited out-of-the-box business metric templates
- No built-in application profiling tools
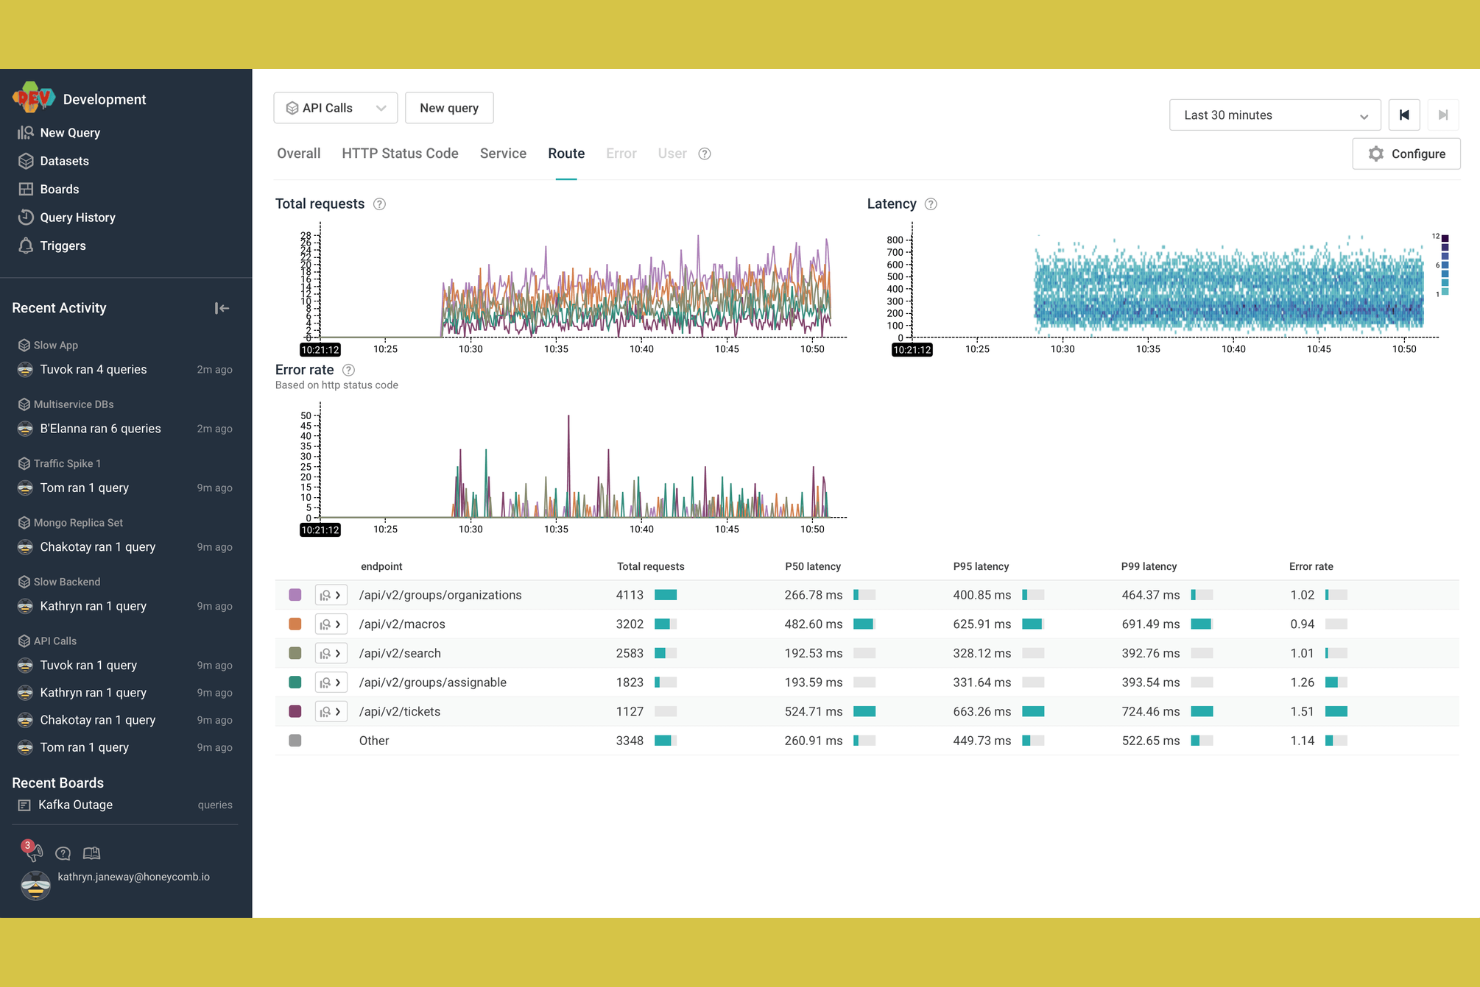
For teams that need to debug complex, high-cardinality events, Honeycomb offers a unique approach to observability. This platform is especially useful for engineers and SREs working in distributed systems where pinpointing outliers and hidden patterns is critical. Unlike many New Relic alternatives, Honeycomb excels at interactive querying and visual exploration of event data at scale.
Why Honeycomb Is a Good New Relic Alternative
Honeycomb stands out for its ability to handle high-cardinality event debugging, which is essential for teams managing complex, distributed systems. I like that you can run interactive queries on billions of events and instantly visualize patterns that would be hard to spot with traditional APM tools. Its BubbleUp feature lets you isolate outliers and anomalies within massive datasets in seconds. For organizations that need to investigate granular event data and uncover hidden issues, Honeycomb offers a level of observability that many New Relic alternatives can’t match.
Honeycomb Key Features
In addition to its event debugging strengths, Honeycomb offers several other features worth noting:
- Service Map: Visualizes relationships and dependencies between services in your environment.
- SLO tracking: Monitors and manages service level objectives directly within the platform.
- Distributed tracing: Captures and displays traces across microservices for end-to-end visibility.
- Team collaboration tools: Enables shared queries, boards, and comments for collaborative troubleshooting.
Honeycomb Integrations
Integrations include AWS Lambda, Slack, Terraform, MySQL, Prometheus, ServiceNow, AWS CloudWatch, and more.
Pros and Cons
Pros:
- Real-time querying on large event datasets
- BubbleUp feature pinpoints anomalies visually
- Handles high-cardinality data without performance loss
Cons:
- Requires instrumentation for full observability
- Limited support for legacy application environments
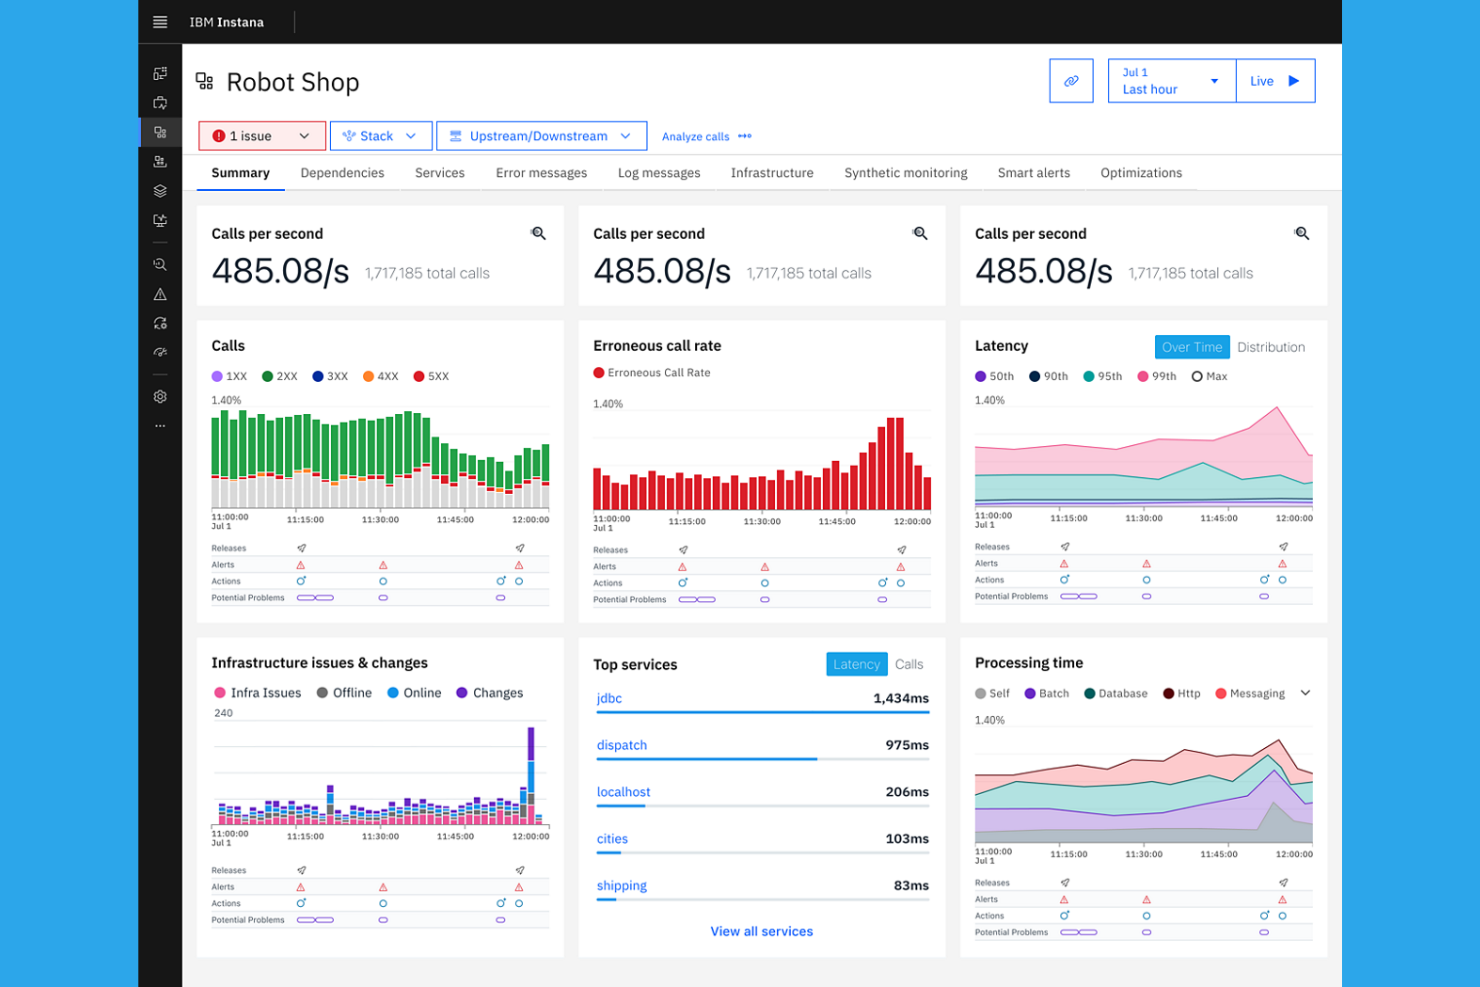
IBM Instana stands out for its automated application discovery and real-time observability. It’s a strong fit for enterprises and DevOps teams managing complex, dynamic environments where manual instrumentation is a challenge. Instana’s continuous, automated mapping of services and dependencies helps teams quickly pinpoint issues that other New Relic alternatives might miss.
Why IBM Instana Is a Good New Relic Alternative
Unlike many observability platforms, IBM Instana automatically discovers and maps every component in your application environment. I picked Instana because its automated application discovery means you don’t have to manually configure or update monitoring as your architecture evolves. Instana continuously detects new services, dependencies, and changes in real time, which is especially valuable for dynamic microservices and containerized workloads. This level of automation helps teams maintain visibility and quickly identify root causes, making it a strong alternative to New Relic for complex environments.
IBM Instana Key Features
In addition to automated discovery and mapping, I also found these features valuable:
- Unbounded analytics: Enables users to query and analyze all collected metrics, traces, and logs without sampling.
- Contextualized alerting: Delivers alerts based on real-time context and dependencies within your environment.
- End-user monitoring: Tracks user experience and performance from the browser or mobile device through backend services.
- One-second granularity: Captures and displays performance data at one-second intervals for detailed troubleshooting.
IBM Instana Integrations
Integrations include AWS EC2, IBM Cloud, Google Cloud Platform, Microsoft Azure, Red Hat OpenShift, VMware Tanzu, MongoDB, Apache Kafka, PagerDuty, and more.
Pros and Cons
Pros:
- Supports containerized and cloud-native apps
- One-second data granularity for real-time insights
- Automated discovery of microservices and dependencies
Cons:
- High resource usage for on-premises agents
- Limited customization for visualizations
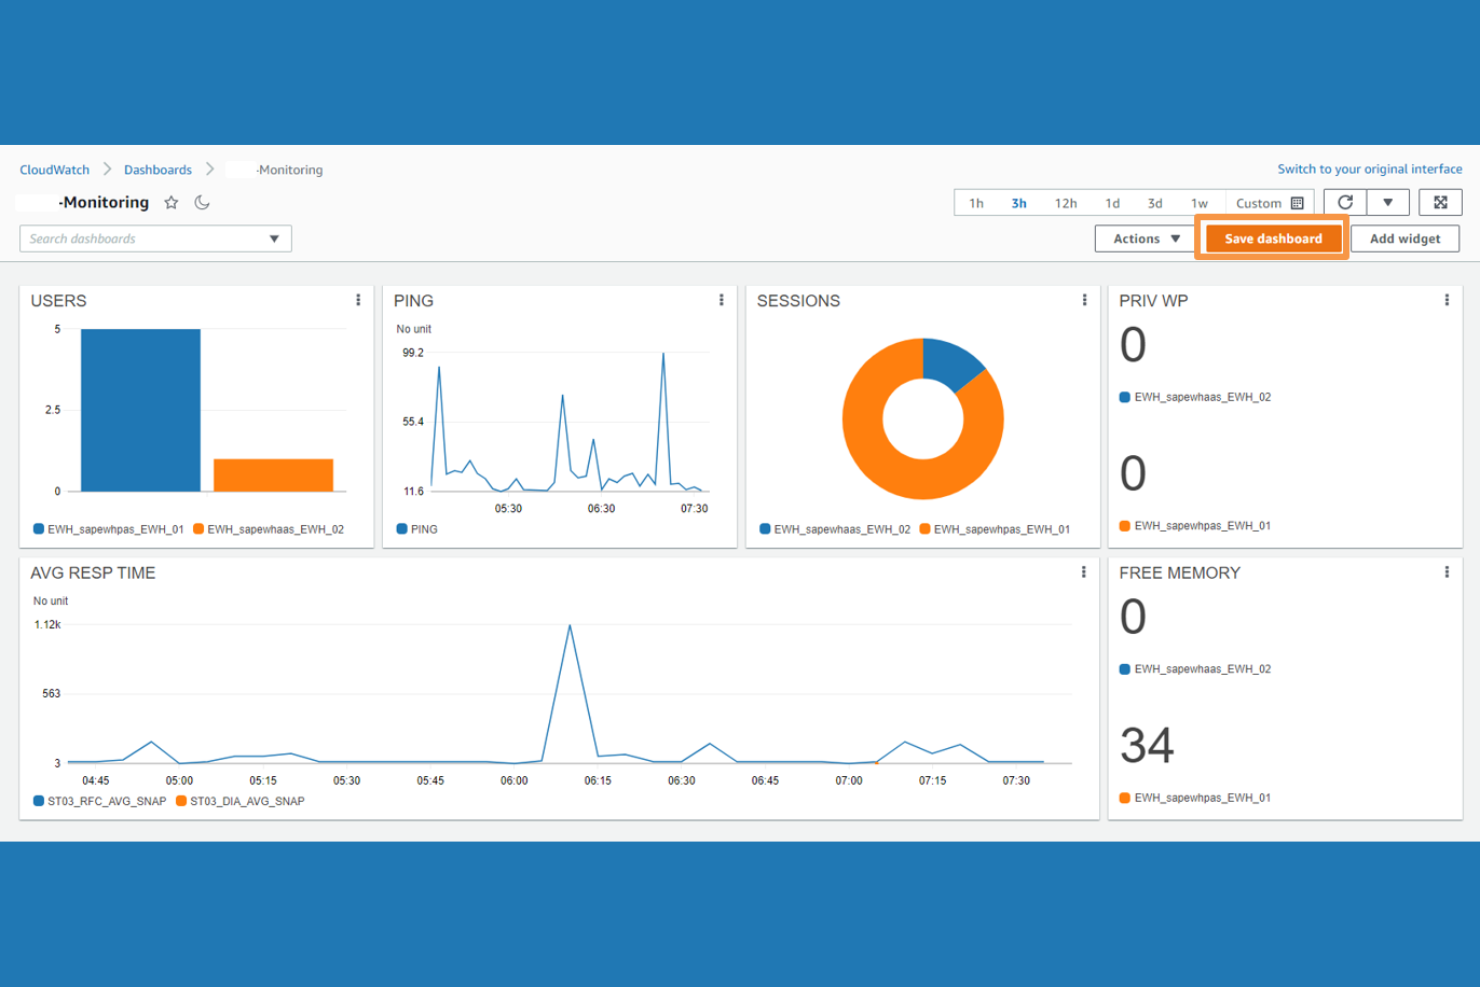
If your team relies heavily on AWS services, Amazon CloudWatch offers monitoring and observability built directly into the AWS ecosystem. It’s a strong fit for cloud architects, DevOps teams, and enterprises running workloads on AWS who want native integration with their infrastructure and services. CloudWatch stands out from other New Relic alternatives by providing easy access to AWS resource metrics, logs, and alarms without extra configuration.
Why Amazon CloudWatch Is a Good New Relic Alternative
For teams operating within the AWS ecosystem, Amazon CloudWatch delivers monitoring that’s tightly integrated with AWS services. I picked CloudWatch because it automatically collects and visualizes metrics from nearly every AWS resource, including EC2, Lambda, and RDS, without extra setup. Its native log aggregation and alarm features let you detect and respond to issues across your AWS environment in real time. If you want observability that’s purpose-built for AWS workloads, CloudWatch is a practical alternative to New Relic.
Amazon CloudWatch Key Features
Some other features that caught my attention include:
- Custom dashboards: Build visualizations that combine metrics, logs, and alarms in a single view.
- Anomaly detection: Automatically identifies unusual patterns in metric data using machine learning.
- CloudWatch Synthetics: Simulates user interactions to monitor application endpoints and APIs.
- Cross-account observability: Aggregate and analyze telemetry data from multiple AWS accounts in one place.
Amazon CloudWatch Integrations
Integrations include Amazon EC2, Amazon RDS, Amazon S3, Amazon ECS, Amazon EKS, AWS Lambda, and more.
Pros and Cons
Pros:
- Built-in synthetic monitoring for API endpoints
- Granular metric collection for AWS resources
- Direct integration with all AWS native services
Cons:
- Time-consuming alerting configuration
- Limited visibility into non-AWS environments
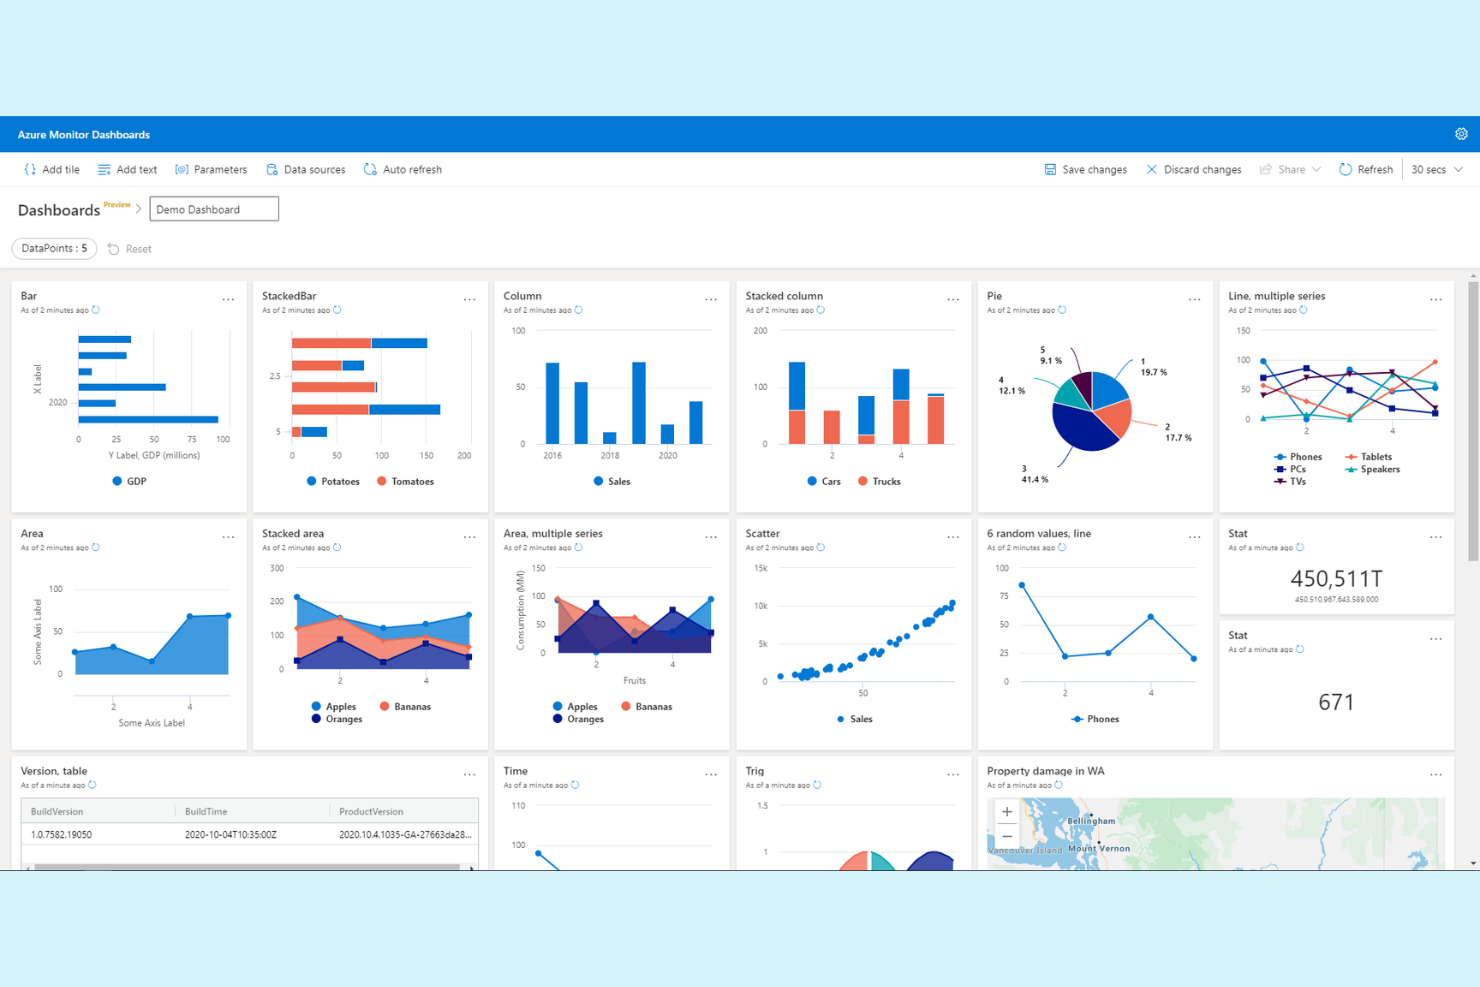
Azure Monitor is purpose-built for organizations running critical workloads on Microsoft Azure. It’s a strong choice for IT teams, cloud engineers, and enterprises that want deep, native observability across Azure resources and services. Unlike other New Relic alternatives, Azure Monitor offers unified telemetry, diagnostics, and alerting that are tightly integrated with the Azure platform.
Why Azure Monitor Is a Good New Relic Alternative
When your infrastructure is built on Microsoft Azure, Azure Monitor offers observability that’s deeply embedded in the platform. I picked Azure Monitor because it collects telemetry from every Azure service, providing unified metrics, logs, and traces without extra configuration. Its Application Insights feature delivers end-to-end monitoring for distributed applications, making it easier to diagnose issues across cloud-native workloads. For teams invested in Azure, this level of integration and visibility sets Azure Monitor apart from other New Relic alternatives.
Azure Monitor Key Features
Some other features worth highlighting include:
- Log Analytics workspace: Centralizes and queries log data from multiple Azure resources.
- Smart alerts: Uses dynamic thresholds and machine learning to reduce false positives.
- Network monitoring: Tracks connectivity, latency, and packet loss across Azure networks.
- Workbooks: Lets you build interactive reports and dashboards for custom visualizations.
Azure Monitor Integrations
Integrations include Azure Kubernetes Service, Azure Arc, Azure Cosmos DB, Azure SQL, Azure Data Factory, Azure Functions, and more.
Pros and Cons
Pros:
- Centralized log analytics across Azure resources
- Built-in support for Azure Kubernetes Service
- Deep integration with Microsoft Azure services
Cons:
- High alert noise without tuning
- Query language differs from industry standards
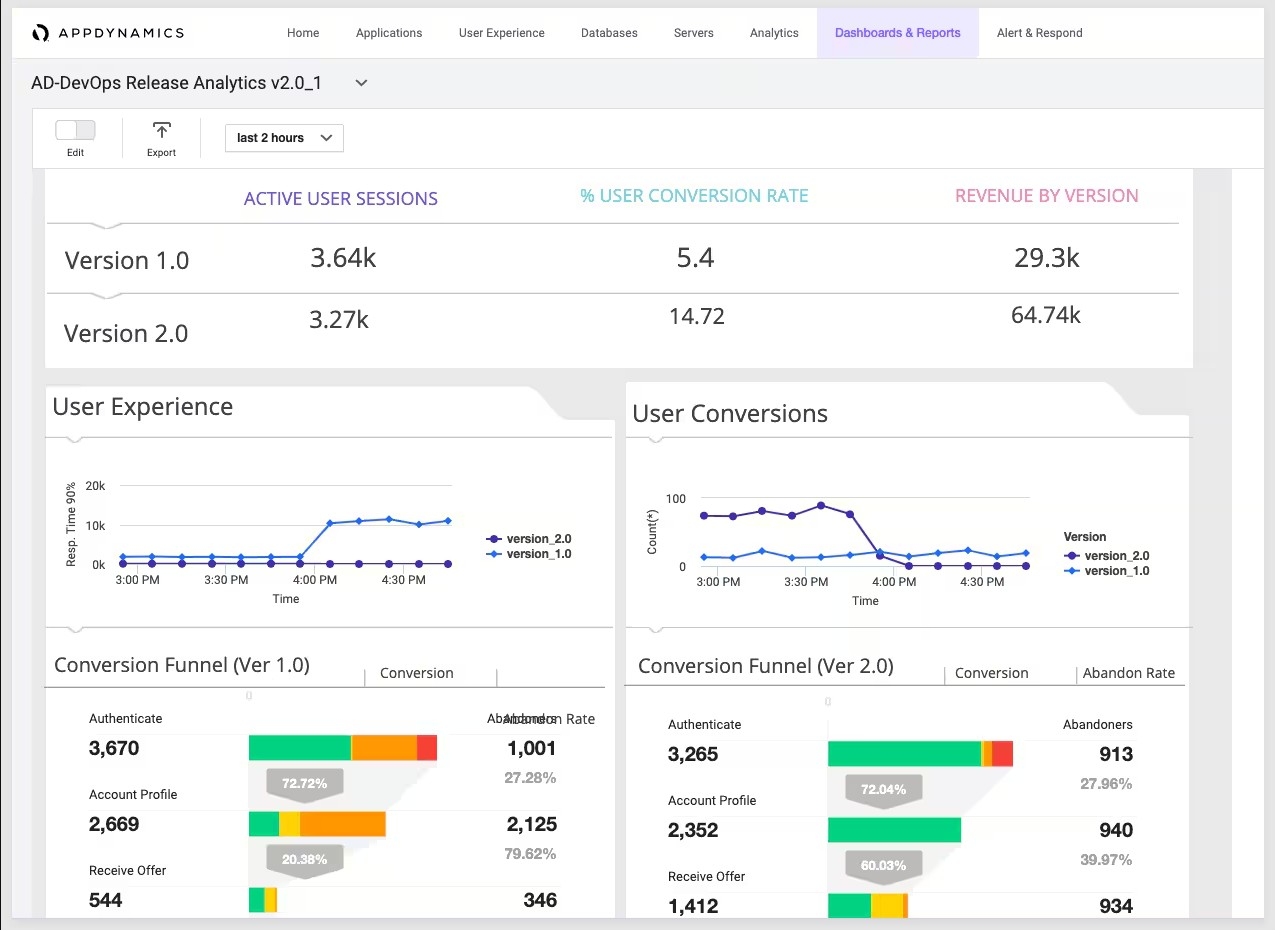
Splunk AppDynamics is designed for teams that need deep visibility into business transaction flows across complex applications. It’s especially useful for enterprises and IT leaders who want to connect application performance directly to business outcomes. If you’re looking for a New Relic alternative that excels at mapping and monitoring end-to-end business transactions, Splunk AppDynamics offers a focused approach.
Why Splunk AppDynamics Is a Good New Relic Alternative
Splunk AppDynamics stands out for its ability to monitor business transactions end-to-end, making it a strong choice for organizations that need to tie application performance directly to business metrics. I like how it automatically discovers, maps, and visualizes transaction flows across distributed environments, so you can see exactly where bottlenecks impact user experience or revenue. Its transaction snapshots and code-level diagnostics help teams quickly identify and resolve issues that affect critical business processes. For teams prioritizing business transaction monitoring over generic application metrics, Splunk AppDynamics offers a focused and actionable alternative to New Relic.
Splunk AppDynamics Key Features
In addition to its business transaction monitoring focus, I also found these features valuable:
- Dynamic baselining: Automatically establishes performance baselines and detects anomalies based on historical trends.
- End-user monitoring: Captures real user interactions and performance data from browsers and mobile devices.
- Infrastructure visibility: Monitors servers, databases, and cloud resources alongside application data.
- Custom dashboards: Lets you build tailored visualizations for different teams and stakeholders.
Splunk AppDynamics Integrations
Integrations include Splunk, SAP, Cisco ThousandEyes, OpenTelemetry, ServiceNow, AWS, Microsoft Azure, Google Cloud Platform, and more.
Pros and Cons
Pros:
- Integration with Cisco networking tools
- Code-level diagnostics for Java and .NET
- Granular business transaction mapping
Cons:
- Pricing increases with additional modules
- Limited support for open-source frameworks
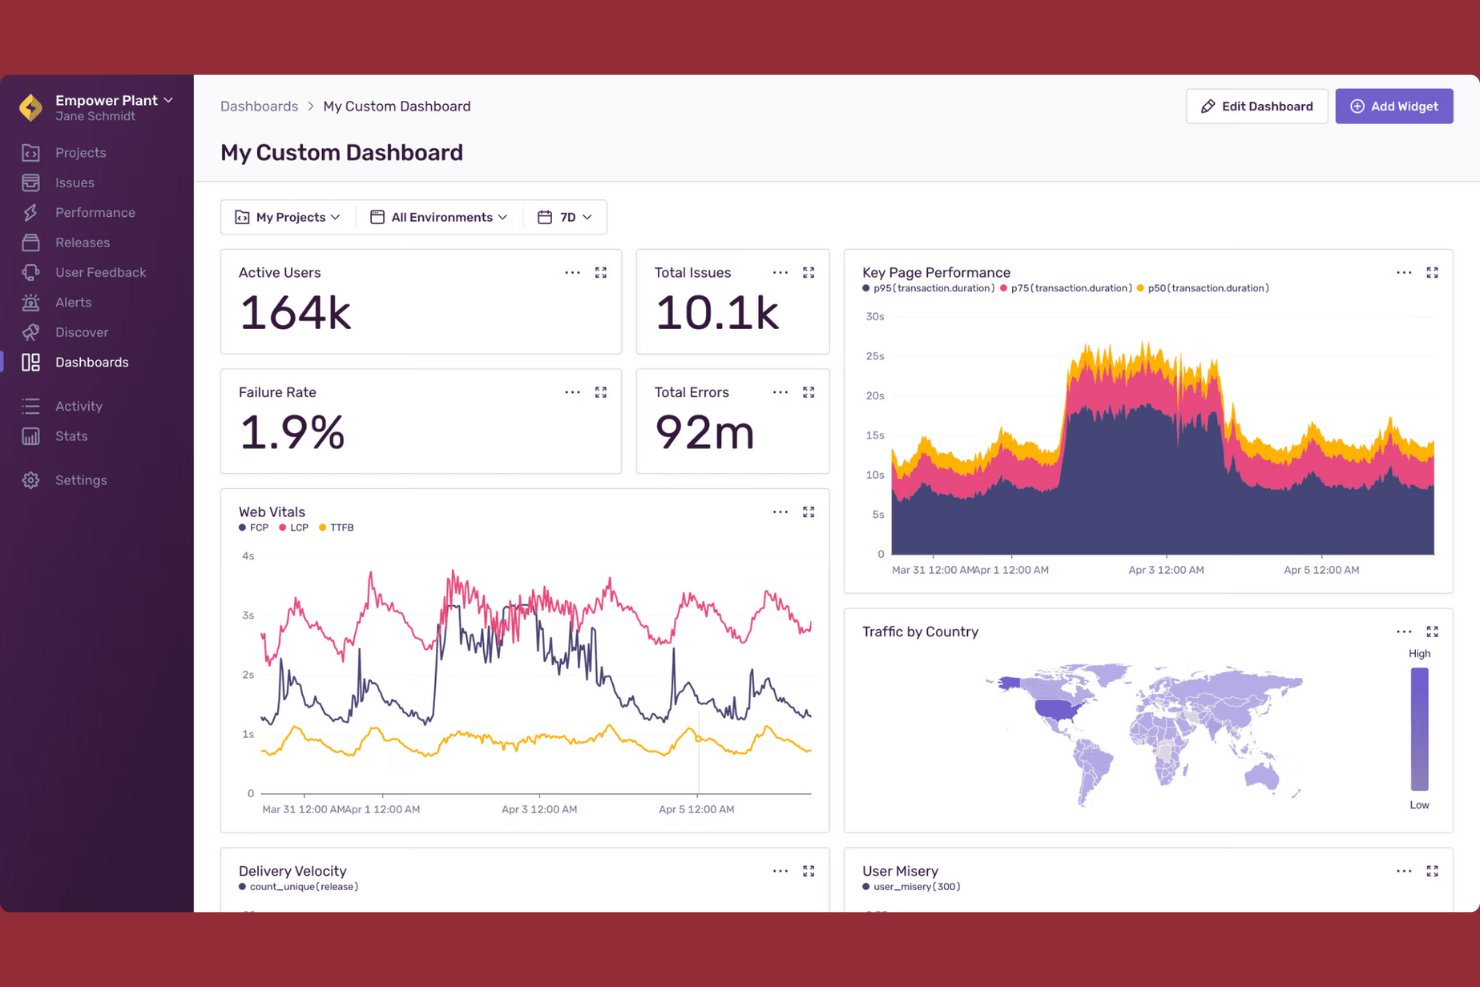
Sentry offers real-time error tracking designed for teams that need instant visibility into application issues. It’s especially useful for developers and engineering leads who want to quickly identify, triage, and resolve errors before they impact users. Unlike many New Relic alternatives, Sentry focuses on actionable error diagnostics and deep context for every incident.
Why Sentry Is a Good New Relic Alternative
For teams that need to catch and resolve errors as they happen, Sentry’s real-time error tracking stands out. I picked Sentry because it instantly notifies you of new issues and provides detailed stack traces, user context, and release tracking for every error. Sentry’s event grouping and issue resolution workflow help developers prioritize and fix the most impactful problems quickly. This focus on actionable, real-time diagnostics makes Sentry a strong alternative to New Relic for organizations that want to minimize downtime and user disruption.
Sentry Key Features
Some other features that make Sentry appealing include:
- Performance monitoring: Tracks transaction times and bottlenecks across your application stack.
- Release health tracking: Monitors the stability and adoption of each software release.
- Session replay: Captures user sessions to help visualize the steps leading up to an error.
- Custom alert rules: Lets you define specific conditions for triggering notifications.
Sentry Integrations
Integrations include GitHub, Slack, Jira, GitLab, Azure DevOps, PagerDuty, Datadog, Microsoft Teams, Vercel, and more.
Pros and Cons
Pros:
- Flexible custom alert rules for notifications
- Deep integration with developer toolchains
- Real-time error alerts with detailed context
Cons:
- No synthetic transaction monitoring features
- Limited infrastructure monitoring capabilities
New Product Updates from Sentry

Sentry Adds Log Export in CSV and JSONL
Sentry now supports exporting up to 10,000 log lines from Explore → Logs in CSV or JSON Lines, with downloads available in-browser or as background downloads and email. For more information, visit Sentry's official site.
 .
.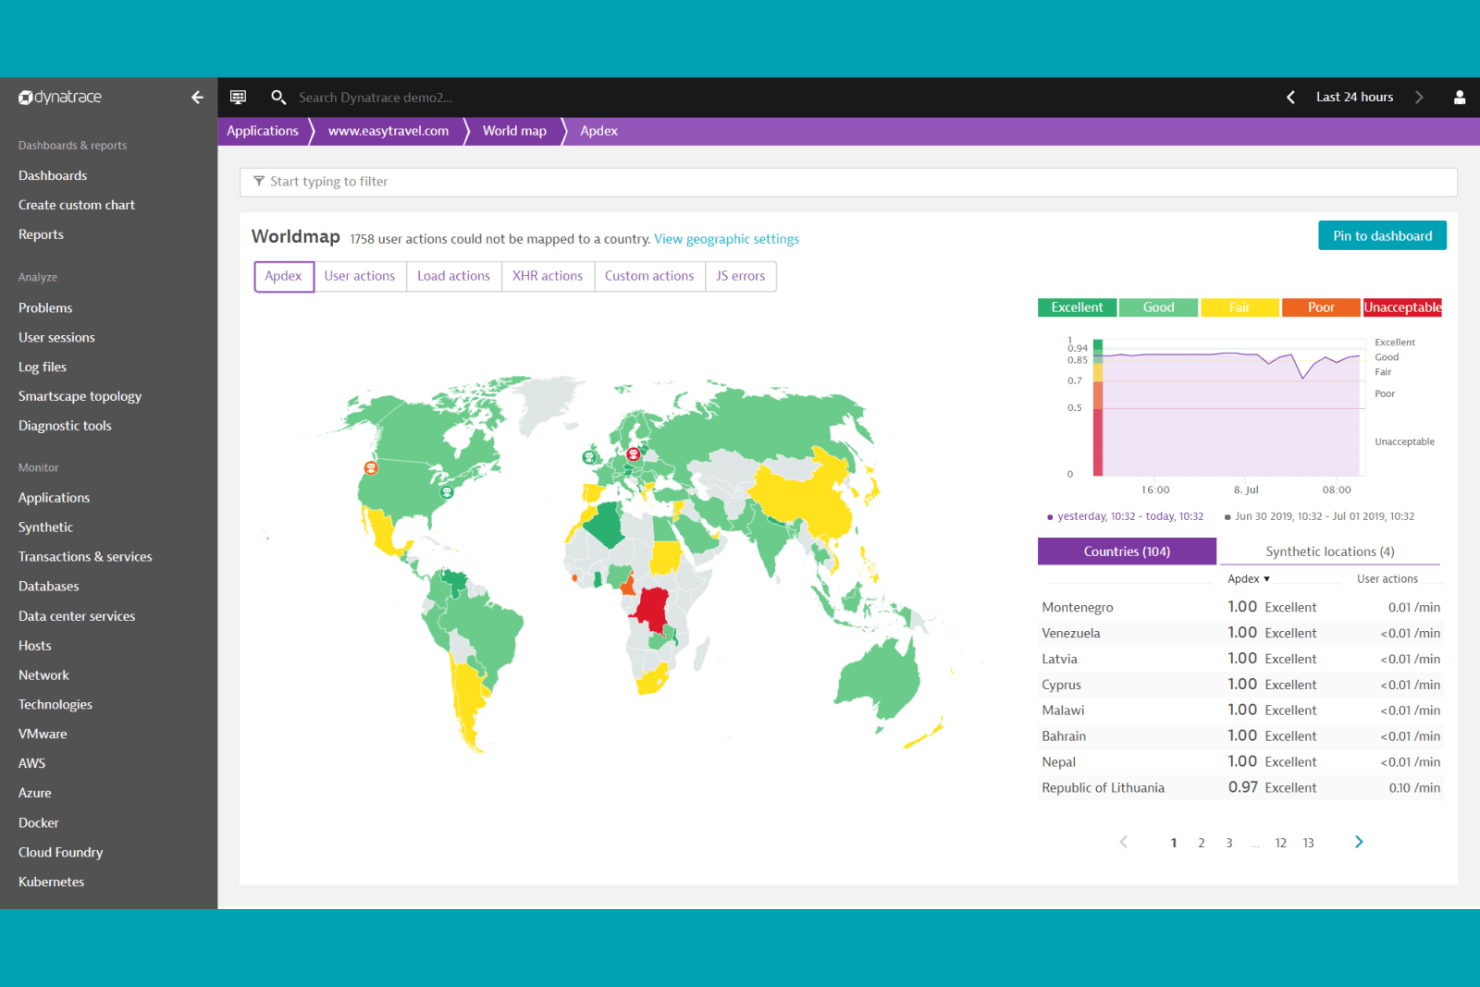
Dynatrace offers an observability solution with AI-powered root cause analysis for teams in complex environments. It’s a strong fit for enterprises and IT operations teams managing large-scale cloud-native or hybrid infrastructures. If you want to reduce manual troubleshooting and get actionable insights from observability data, Dynatrace offers a distinct approach compared to other New Relic alternatives.
Why Dynatrace Is a Good New Relic Alternative
What sets Dynatrace apart is its AI-powered root cause analysis, which helps teams quickly pinpoint and resolve issues in complex environments. I appreciate how Davis AI engine automatically analyzes dependencies and anomalies across applications, infrastructure, and user experience data. Dynatrace also provides automated problem detection and prioritization, reducing the need for manual investigation. For organizations seeking to minimize downtime and accelerate troubleshooting, these features make Dynatrace a compelling alternative to New Relic.
Dynatrace Key Features
Some other features worth highlighting include:
- Full-stack observability: Monitor applications, infrastructure, and user experience data from a single platform.
- Automatic dependency mapping: Visualize relationships between services, processes, and hosts without manual configuration.
- Real user monitoring (RUM): Track actual user interactions and performance across web and mobile applications.
- Custom metric ingestion: Bring in external metrics for unified analysis alongside native monitoring data.
Dynatrace Integrations
Integrations include AWS, Microsoft Azure, Google Cloud APIs, Alibaba Cloud, Kubernetes, Docker, Red Hat Enterprise Linux, Oracle HTTP Server, Prometheus, and more.
Pros and Cons
Pros:
- Supports multi-cloud and hybrid environments
- Real user monitoring covers web and mobile
- AI engine automates root cause analysis
Cons:
- Alert noise can require manual tuning
- Limited custom dashboarding options
Datadog is built for teams managing dynamic, cloud-native environments that need unified visibility across infrastructure, applications, and logs. It’s especially relevant for DevOps, SRE, and platform teams who want to correlate metrics, traces, and events in real time. If you’re seeking a New Relic alternative with deep integrations for cloud platforms and containerized workloads, Datadog offers a monitoring approach tailored to modern architectures.
Why Datadog Is a Good New Relic Alternative
For teams focused on cloud-native infrastructure visibility, Datadog offers a monitoring experience that’s purpose-built for modern, distributed systems. I appreciate how Datadog provides unified dashboards that correlate time-series infrastructure metrics and application traces. Its auto-discovery of cloud resources and support for container orchestration platforms like Kubernetes make it especially useful for organizations running microservices at scale. If you need granular, real-time insights into cloud workloads, Datadog is a strong alternative to New Relic.
Datadog Key Features
Some other features that stood out to me include:
- Synthetic monitoring: Simulates user interactions to test application and API performance from multiple locations.
- Network performance monitoring: Tracks network traffic, latency, and dependencies across cloud and on-premises environments.
- Security monitoring: Detects threats and suspicious activity by analyzing logs and infrastructure events.
- Custom alerting: Lets you set up tailored alerts based on thresholds, anomalies, or composite conditions.
Datadog Integrations
Integrations include AWS, Microsoft Azure, Google Cloud Platform, Kubernetes, Docker, Slack, PagerDuty, GitHub, Jira, and more.
Pros and Cons
Pros:
- Security monitoring integrated with observability data
- Real-time log analytics with custom dashboards
- Native support for Kubernetes and containers
Cons:
- Limited retention periods for logs
- High data ingestion costs for large environments
Best for monitoring hybrid IT environments
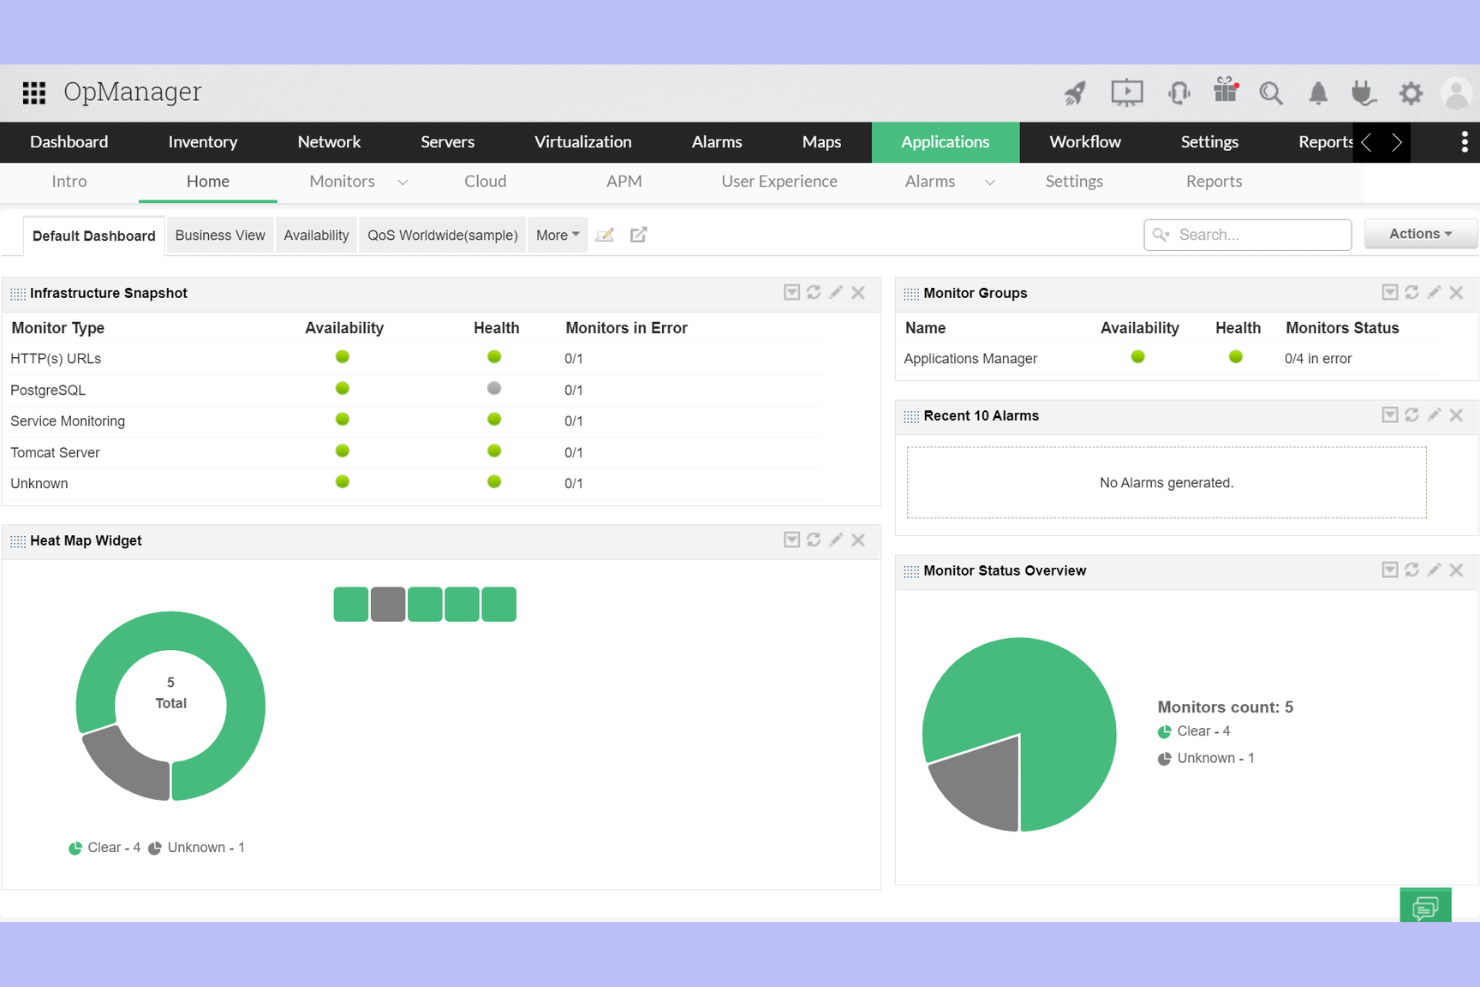
ManageEngine Applications Manager is designed for teams managing self-hosted, cloud, and on-premises systems in hybrid IT environments. It appeals to IT operations and infrastructure teams that need unified monitoring across diverse technologies. If you’re looking for deep visibility into applications, servers, and databases without being tied to a single cloud provider, this platform stands out.
Why ManageEngine Applications Manager Is a Good New Relic Alternative
For organizations juggling PHP apps and on-premises assets, ManageEngine Applications Manager offers unified monitoring. I picked it for its ability to track performance across hybrid IT environments, including legacy systems and modern cloud apps. The platform provides real-time application, server, and database monitoring from a single dashboard. Its support for over 150 technologies makes it a strong fit for teams with diverse infrastructure.
ManageEngine Applications Manager Key Features
Some other features worth noting include:
- Synthetic transaction monitoring: Simulate user interactions to proactively detect application issues before they impact real users.
- Customizable dashboards: Build tailored views to track the metrics and KPIs that matter most to your team.
- Automated alerting: Set up threshold-based alerts to notify you of performance anomalies or outages as soon as they occur.
- Root cause analysis tools: Drill down into incidents with detailed reports and dependency mapping to quickly identify the source of problems.
ManageEngine Applications Manager Integrations
Integrations include AWS, Azure, Google Cloud Platform, Oracle Cloud, Microsoft 365, ServiceNow, Docker, Kubernetes, VMware, and Apache Tomcat.
Pros and Cons
Pros:
- Monitors 150+ different application types
- Offers deep database and server visibility
- Supports both cloud and on-premises monitoring
Cons:
- Fewer AI-driven insights than competitors
- User interface can feel outdated
New Product Updates from ManageEngine Applications Manager
Oracle Cloud Application Monitoring Now Available in ManageEngine Applications Manager
ManageEngine Applications Manager introduces Oracle Cloud Application Monitoring, Oracle Cloud Function Monitoring, and Oracle Cloud NAT Gateway Monitoring. These new capabilities help teams monitor Oracle Cloud applications, serverless workloads, and network resources from a single platform. For more information, visit ManageEngine Applications Manager's official site.
 .
.

Criterios de selección de alternativas a New Relic
Al seleccionar las mejores alternativas a New Relic para incluir en esta lista, consideré las necesidades y problemas comunes de los compradores relacionados con productos de monitorización del rendimiento de aplicaciones y plataformas de observabilidad, como la solución de problemas en sistemas distribuidos e identificación de cuellos de botella en el rendimiento. También utilicé el siguiente marco para mantener mi evaluación estructurada y justa:
Funcionalidad principal (25% de la puntuación total)
Para ser considerada en esta lista, cada solución debía cumplir con estos casos de uso comunes:
- Monitorizar el rendimiento de aplicaciones en tiempo real
- Rastrear y alertar sobre errores y excepciones
- Visualizar trazas distribuidas y mapas de servicios
- Analizar logs y métricas en conjunto
- Soportar integraciones con entornos en la nube
Otras características destacadas (25% de la puntuación total)
Para ayudar a reducir aún más la competencia, también busqué características únicas como:
- Análisis de eventos de alta cardinalidad
- Detección de anomalías impulsada por IA
- Paneles y visualizaciones personalizables
- Seguimiento incorporado de objetivos de nivel de servicio (SLO)
- Herramientas avanzadas de análisis de causa raíz
Usabilidad (10% de la puntuación total)
Para tener una idea de la facilidad de uso de cada sistema, consideré lo siguiente:
- Navegación intuitiva y diseño del panel de control
- Opciones claras de visualización de datos
- Configuración mínima para las funciones principales de monitorización
- Interfaz de usuario receptiva y accesible
- Organización lógica de las herramientas de monitorización y alertas
Incorporación (10% de la puntuación total)
Para evaluar la experiencia de incorporación de cada plataforma, tuve en cuenta lo siguiente:
- Disponibilidad de guías paso a paso para la configuración
- Acceso a vídeos de formación y documentación
- Recorridos interactivos por el producto o listas de verificación de incorporación
- Plantillas predefinidas para escenarios comunes de monitorización
- Soporte para la migración de datos desde otras plataformas
Atención al Cliente (10% de la puntuación total)
Para evaluar los servicios de atención al cliente de cada proveedor de software, tuve en cuenta lo siguiente:
- Disponibilidad de chat en vivo o soporte telefónico
- Capacidad de respuesta ante problemas técnicos
- Acceso a una base de conocimientos o centro de ayuda
- Foros comunitarios o grupos de usuarios
- Disponibilidad de seminarios web de incorporación y solución de problemas
Relación Calidad-Precio (10% de la puntuación total)
Para valorar la relación calidad-precio de cada plataforma, tuve en cuenta lo siguiente:
- Modelos de precios rentables y transparentes
- Variedad de funciones incluidas en los planes básicos
- Flexibilidad para escalar según las necesidades del negocio
- Sin tarifas ocultas ni cargos inesperados
- Disponibilidad de prueba gratuita o plan gratuito
Reseñas de Clientes (10% de la puntuación total)
Para obtener una idea de la satisfacción general de los clientes, tuve en cuenta lo siguiente al leer las reseñas:
- Consistencia de los comentarios positivos entre plataformas
- Informes sobre fiabilidad y tiempo de actividad
- Comentarios sobre el soporte y la experiencia de incorporación
- Opiniones de los usuarios sobre profundidad y flexibilidad de las funciones
- Tendencias en actualizaciones o mejoras recientes
¿Por Qué Buscar una Alternativa a New Relic?
Aunque New Relic es una opción sólida, muchos usuarios buscan alternativas debido a los costos de precios y volúmenes de datos de New Relic. Es posible que estés buscando una alternativa a New Relic porque…
- Necesitas una estructura de precios más flexible para grandes volúmenes de datos
- Quieres un soporte más profundo para integraciones de código abierto
- Requieres análisis avanzados de eventos de alta cardinalidad
- Necesitas mayor control granular sobre la retención de datos
- Quieres una interfaz más sencilla para el trazado distribuido
- Operas en regiones con soporte limitado de New Relic
Si alguna de estas razones te resulta familiar, has llegado al lugar indicado. Mi lista contiene varias opciones de plataformas de monitorización del rendimiento de aplicaciones y observabilidad que están mejor adaptadas para los equipos que enfrentan estos desafíos con New Relic y buscan alternativas.
Funciones Clave de New Relic
A continuación te detallo algunas de las funciones clave de New Relic, para que puedas comparar y contrastar lo que ofrecen las soluciones alternativas:
- Supervisión APM: Rastrea métricas de rendimiento de aplicaciones, tasas de error y tiempos de transacción para ayudar a los equipos a identificar y resolver cuellos de botella en tiempo real.
- Rastreo distribuido: Sigue las solicitudes a medida que viajan a través de microservicios e infraestructuras, facilitando la identificación de dónde ocurre la latencia o los fallos.
- Monitoreo de infraestructura: Ofrece visibilidad sobre servidores, contenedores y recursos en la nube, permitiendo a los usuarios correlacionar la salud de la infraestructura con el rendimiento de las aplicaciones.
- Gestión de registros: Recopila y analiza datos de registros de múltiples fuentes, permitiendo una resolución de problemas más rápida y análisis de la causa raíz.
- Monitoreo sintético: Simula interacciones de usuarios y llamadas API para detectar de forma proactiva caídas o problemas de rendimiento antes de que afecten a los usuarios reales.
- Monitoreo real de usuarios (RUM): Captura datos de sesiones de usuarios reales, ofreciendo información sobre el rendimiento del frontend y la experiencia del usuario en diferentes dispositivos y ubicaciones.
- Alertas y gestión de incidentes: Envía alertas personalizables basadas en umbrales o anomalías, e integra con herramientas de respuesta a incidentes para gestionar los flujos de resolución.
- Paneles y visualización: Ofrece paneles personalizables que agregan métricas, rastreos y registros para una visión unificada de la salud y el rendimiento del sistema.
- Mapas de servicios: Visualizan relaciones y dependencias entre servicios, ayudando a los equipos a comprender el impacto de los problemas en entornos distribuidos.
- Integraciones: Se conecta nativamente con proveedores de nube populares, herramientas DevOps y plataformas de terceros para centralizar los datos de observabilidad y automatizar flujos de trabajo.
¿Qué sigue?
Si estás investigando alternativas a New Relic, conéctate con un asesor de SoftwareSelect para recibir recomendaciones gratuitas.
Rellena un formulario y mantén una breve charla en la que tratarán los detalles específicos de tus necesidades. Luego recibirás una lista breve de software para revisar. Incluso te acompañarán durante todo el proceso de compra, incluidas las negociaciones de precios.