10 Mejores Alternativas a Sentry Elegidas para 2026

Lista corta de alternativas a Sentry


Una alternativa sólida a Sentry ofrece un seguimiento de errores confiable, monitoreo en tiempo real y diagnósticos accionables que ayudan a tu equipo a resolver problemas rápidamente. Si estás buscando alternativas a Sentry, probablemente deseas herramientas que se adapten a tu flujo de trabajo, se integren con tu stack o proporcionen funciones que Sentry no tiene.
Con tantas opciones disponibles, es difícil saber cuál plataforma realmente te ayudará a detectar errores, entender las causas raíz y mantener tus aplicaciones funcionando sin problemas. Esta lista desglosa las principales alternativas a Sentry para 2026, para que puedas comparar sus ventajas y encontrar la mejor para las necesidades de tu equipo.
¿Qué es Sentry?
Sentry es una plataforma de monitoreo de aplicaciones y seguimiento de errores que ayuda a los equipos a identificar, diagnosticar y resolver problemas de software en tiempo real. Proporciona una variedad de funciones de monitoreo que capturan datos de errores en las aplicaciones, agrupan eventos relacionados y muestran contexto detallado para la depuración. Con soporte para múltiples lenguajes de programación y flujos de trabajo, Sentry lo utilizan equipos de todos los tamaños, incluidas startups, para mantener la fiabilidad de sus aplicaciones. Aunque no es, por defecto, una plataforma de observabilidad auto-alojada, ofrece flexibilidad de despliegue junto con funciones avanzadas que apoyan los entornos de desarrollo modernos.
Resumen de las mejores alternativas a Sentry
Esta tabla comparativa resume los detalles de precios de mis principales alternativas a Sentry para ayudarte a encontrar la mejor para tu presupuesto y necesidades de negocio.
| Tool | Best For | Trial Info | Price | ||
|---|---|---|---|---|---|
| 1 | Best for full-stack observability | Free plan available | From $49/user/month | Website | |
| 2 | Best for detailed user diagnostics | 14-day free trial + free demo available | From $40/100,000 errors/month (billed annually) | Website | |
| 3 | Best for product analytics integration | Free plan + free demo available | From $0.00005/event | Website | |
| 4 | Best for session replay features | 14-day free trial + free plan + free demo available | From $69/month (billed annually) | Website | |
| 5 | Best for stability score reporting | 14-day free trial + free plan + free demo available | From $20/month (billed annually) | Website | |
| 6 | Best with real-time error grouping | 14-day free trial + free demo available | From $15.83/month (billed annually) | Website | |
| 7 | Best for simple setup in Ruby apps | 30-day free trial + free plan available | From €18.25/month (billed annually) | Website | |
| 8 | Best for uptime and error alerts | 30-day free trial + free plan + free demo available | From $26/month (billed annually) | Website | |
| 9 | Best for pinpointing performance bottlenecks | Free trial + free plan + free demo available | From $19/month | Website | |
| 10 | Best with cloud-native monitoring | 14-day free trial | From $15/host/month (billed annually) | Website |
Por Qué Confiar en Nuestras Reseñas de Software
Llevamos probando y revisando software desde 2020. Como líderes de CX, sabemos lo crítico y difícil que es tomar la decisión correcta al seleccionar software. Invertimos en investigación a fondo para que nuestra audiencia tome mejores decisiones de compra de software. Hemos probado más de 2,000 herramientas para distintos casos de uso de CX y escrito más de 1,000 reseñas integrales de software. Descubre cómo mantenemos la transparencia y nuestra metodología para reseñas de software.
-

SupportYourApp
Visit WebsiteThis is an aggregated rating for this tool including ratings from Crozdesk users and ratings from other sites.4.7 -
Tidio
Visit WebsiteThis is an aggregated rating for this tool including ratings from Crozdesk users and ratings from other sites.4.7 -
Freshdesk
Visit WebsiteThis is an aggregated rating for this tool including ratings from Crozdesk users and ratings from other sites.4.4


Reseñas de alternativas a Sentry
A continuación encontrarás mis resúmenes detallados de las mejores alternativas a Sentry que han entrado en mi lista corta. Mis reseñas ofrecen un análisis detallado de las funciones, integraciones y mejores casos de uso de cada plataforma para ayudarte a encontrar la ideal para ti.

When you need visibility across your entire technology stack, New Relic offers unified observability for applications, infrastructure, and digital experiences. It’s a strong fit for engineering and operations teams who want to monitor everything from frontend performance to backend services in one place.
Unlike many Sentry alternatives, New Relic brings together real user monitoring, distributed tracing, and infrastructure insights for a complete view of system health.
Why New Relic Is a Good Sentry Alternative
If you’re looking for a Sentry alternative that covers every layer of your stack, New Relic is built for full-stack observability. I picked New Relic because it combines application performance monitoring, infrastructure monitoring, and real user monitoring in a single platform.
With distributed tracing and detailed error analytics, you can track issues from frontend to backend and understand their impact on users. This approach helps teams quickly identify, prioritize, and resolve problems across complex environments.
New Relic Key Features
Some other features in New Relic that are helpful for teams evaluating Sentry alternatives include:
- Custom dashboards: Build visualizations and reports tailored to your team’s specific monitoring needs.
- Alert policies: Configure detailed alert conditions and notification channels for proactive incident response.
- Log management: Ingest, search, and analyze logs alongside other telemetry data in one place.
- Synthetic monitoring: Simulate user interactions to test application availability and performance from multiple locations.
New Relic Integrations
Integrations include AWS, Azure, Google Cloud Platform, Kubernetes, Docker, Jenkins, PagerDuty, Slack, Datadog, and GitHub.
Pros and Cons
Pros:
- Query builder enables custom metric analysis
- Real user monitoring tracks actual user sessions
- Full-stack observability covers frontend and backend
Cons:
- UI performance slows with large data volumes
- Alert configuration can be time-consuming
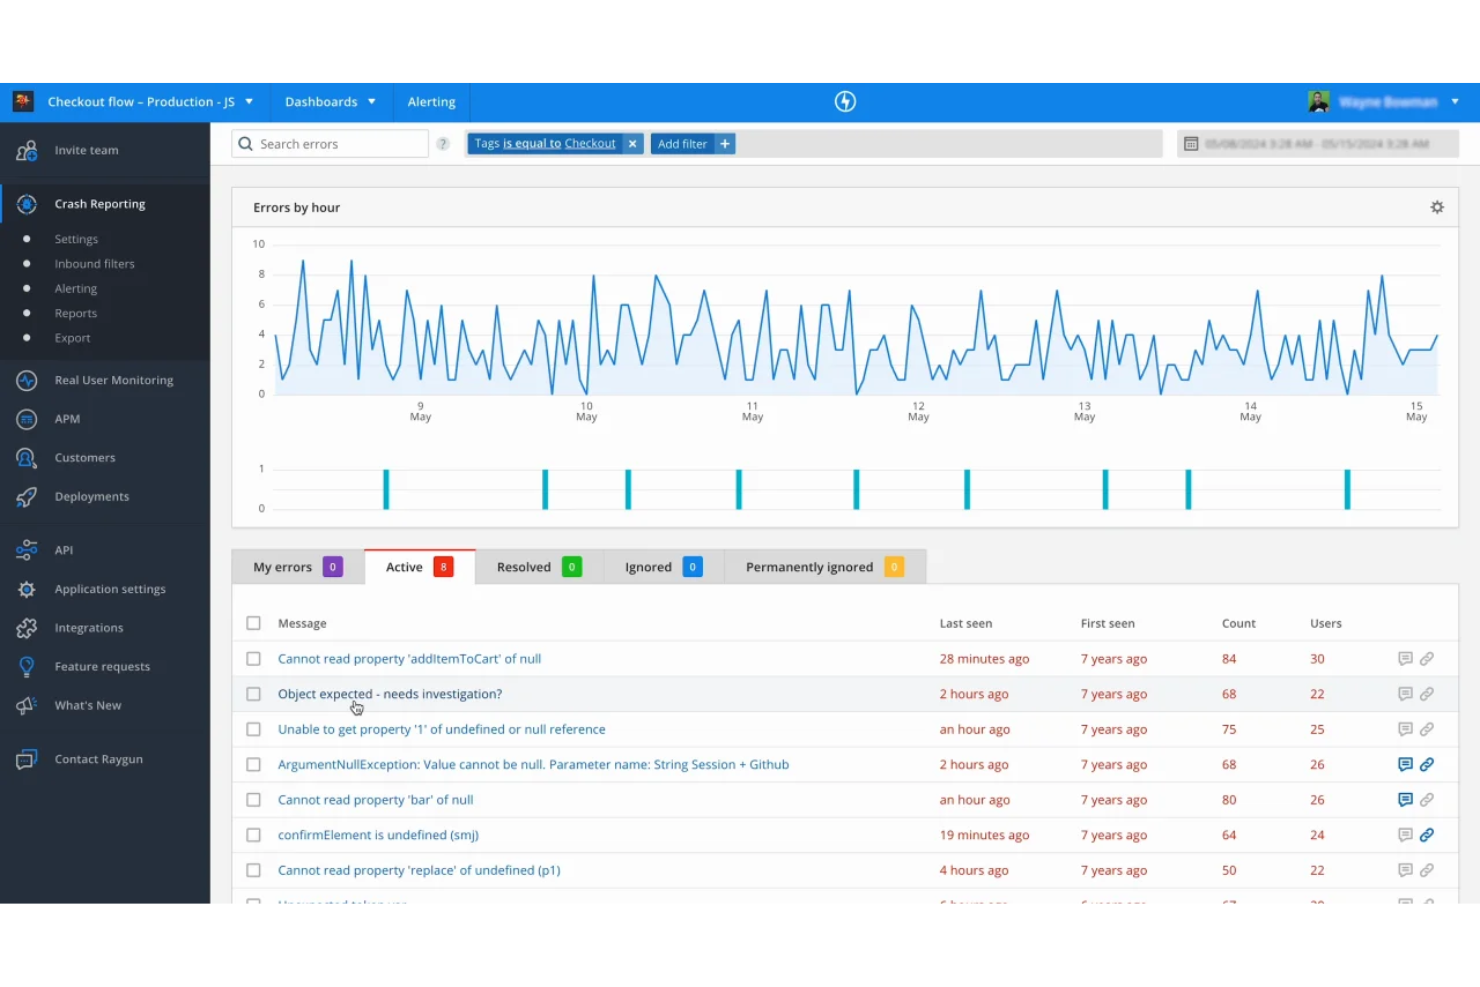
For teams that need to dig deep into user-level diagnostics, Raygun offers a unique approach to error and performance monitoring. This platform is especially useful for SaaS businesses and product teams who want to trace issues back to individual users and sessions. Raygun stands out from Sentry alternatives by providing detailed user tracking and session timelines, making it easier to understand the real impact of errors on your customers.
Why Raygun Is a Good Sentry Alternative
Unlike many error monitoring tools, Raygun gives you a clear window into how issues affect individual users. I picked Raygun as a Sentry alternative because its user diagnostics features let you trace errors and performance problems back to specific sessions and user journeys.
With detailed session timelines and user-level tracking, you can see exactly when and how a problem occurred. This level of granularity is especially helpful for teams that want to prioritize fixes based on real customer impact.
Raygun Key Features
Some other features in Raygun that are valuable for teams considering Sentry alternatives include:
- Real user monitoring: Track actual user experiences and performance metrics across web and mobile applications.
- Crash reporting: Automatically capture and report application crashes with detailed stack traces.
- Deployment tracking: Link errors and performance changes to specific code deployments for easier troubleshooting.
- Custom dashboards: Build personalized dashboards to visualize error and performance data that matters most to your team.
Raygun Integrations
Integrations include GitHub, Jira software, Slack, Asana, Amazon SQS, Azure DevOps services, Bitbucket, GitLab, Lighthouse, Microsoft Teams, Trello, Zendesk, and more.
Pros and Cons
Pros:
- Deployment tracking links errors to releases
- Real user monitoring covers web and mobile
- Session timelines show user impact clearly
Cons:
- Limited open-source SDK options
- Pricing increases with higher event volume
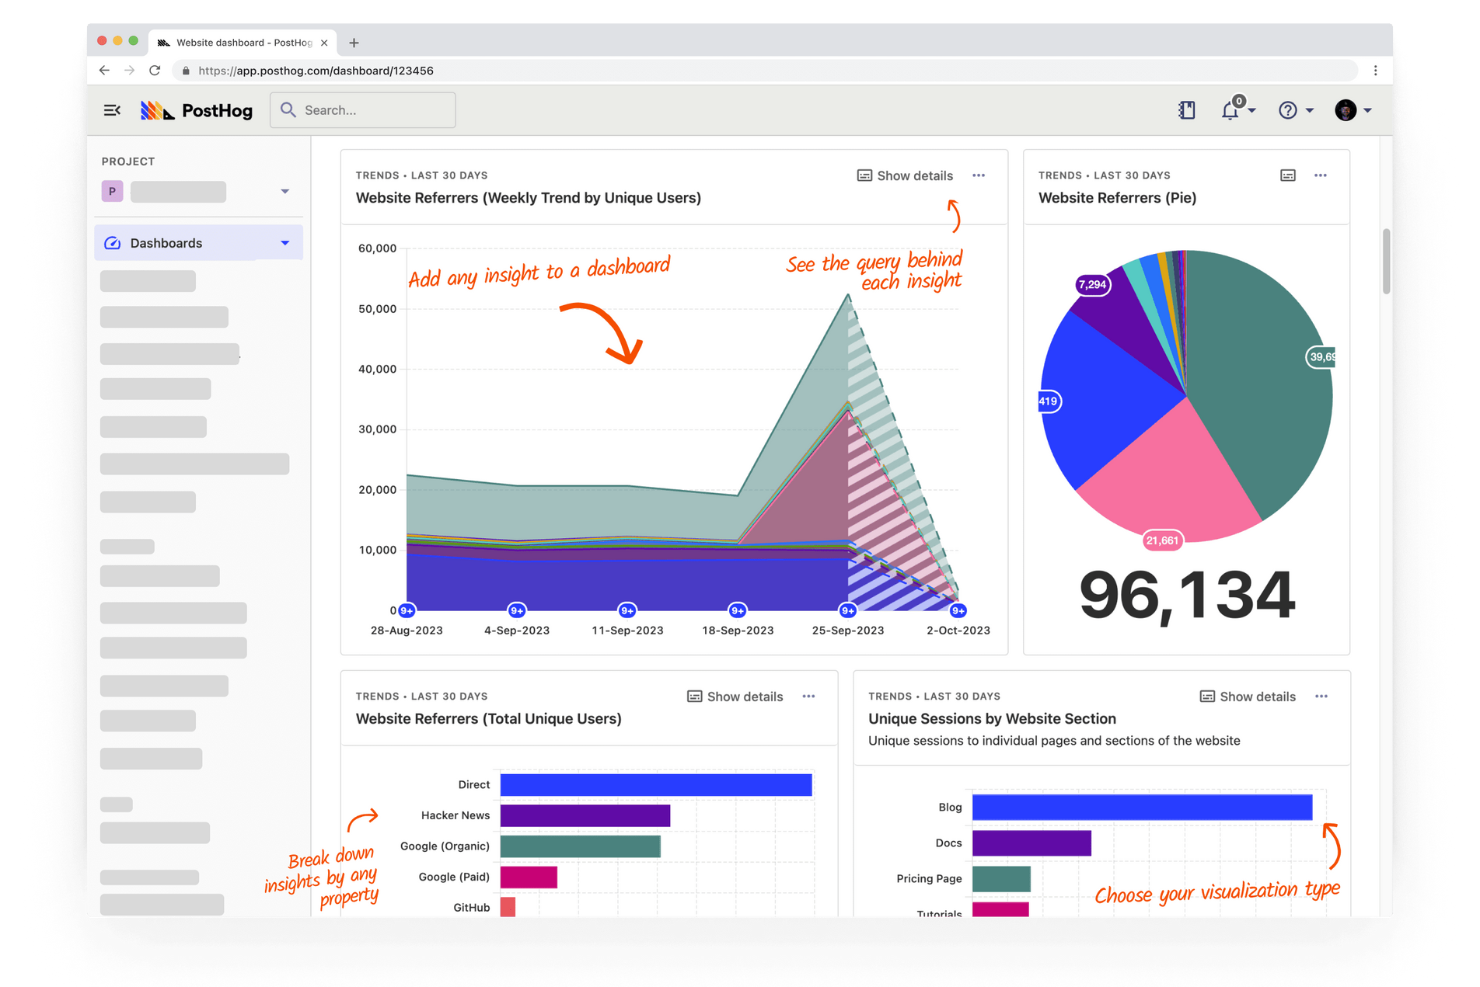
If you’re looking for a Sentry alternative with built-in product analytics, PostHog is worth a close look. This platform combines error tracking with user behavior insights, making it a strong fit for product teams and SaaS businesses. PostHog helps you connect technical issues to real user actions, so you can prioritize fixes that matter most.
Why PostHog Is a Good Sentry Alternative
What sets PostHog apart as a Sentry alternative is its deep integration of product analytics with error tracking. I picked PostHog for teams that want to see how user actions and technical issues intersect in one place. You can track errors alongside user flows, funnels, and session recordings, which helps you understand the real impact of bugs on your product experience. This combination makes it easier to prioritize fixes based on actual user behavior, not just error frequency.
PostHog Key Features
Some other features in PostHog that stand out for teams comparing Sentry alternatives include:
- Custom event tracking: Capture and analyze any event in your application with flexible event definitions.
- Feature flags: Roll out new features to specific user segments and control releases without redeploying code.
- A/B testing: Run experiments directly within the platform to measure the impact of changes on user behavior.
- API access: Integrate PostHog data with your existing tools and workflows using a robust API.
PostHog Integrations
Integrations include Slack, Segment, Shopify, WordPress, Google Tag Manager, Webflow, WooCommerce, Django, Next.js, and Vercel.
Pros and Cons
Pros:
- Supports feature flags and A/B testing
- Offers session replay for debugging context
- Combines error tracking with product analytics
Cons:
- Fewer integrations with developer tools
- Lacks advanced alerting compared to Sentry
For teams who want to see exactly what users experienced before a bug, LogRocket delivers detailed session replay alongside error tracking. It’s especially useful for product managers, QA teams, and front-end engineers who need to understand user behavior and UI issues in context. Unlike most Sentry alternatives, LogRocket lets you watch user sessions and inspect network activity, console logs, and DOM changes all in one place.
Why LogRocket Is a Good Sentry Alternative
What sets LogRocket apart from Sentry is its focus on session replay features that let you see exactly what users experienced before and during an issue. I picked LogRocket because it records user sessions, capturing clicks, scrolls, and navigation events alongside error data.
You can also inspect network requests, console logs, and DOM changes directly from the session timeline. This level of visual context helps teams quickly reproduce bugs and understand the root cause in a way that traditional error tracking tools can’t match.
LogRocket Key Features
Some other features in LogRocket that are useful for teams comparing Sentry alternatives include:
- Performance monitoring: Track page load times, resource usage, and frontend performance metrics.
- Custom event tracking: Define and capture specific user actions or milestones within your application.
- Issue management integration: Connect with tools like Jira and GitHub to create and track issues directly from LogRocket.
- User identification: Link session data to specific user profiles for more targeted debugging and support.
LogRocket Integrations
Native integrations are not currently listed.
Pros and Cons
Pros:
- Custom event tracking for specific user flows
- Network and console logs captured with sessions
- Session replay shows user actions before errors
Cons:
- Data export options are limited
- No backend error monitoring or tracing

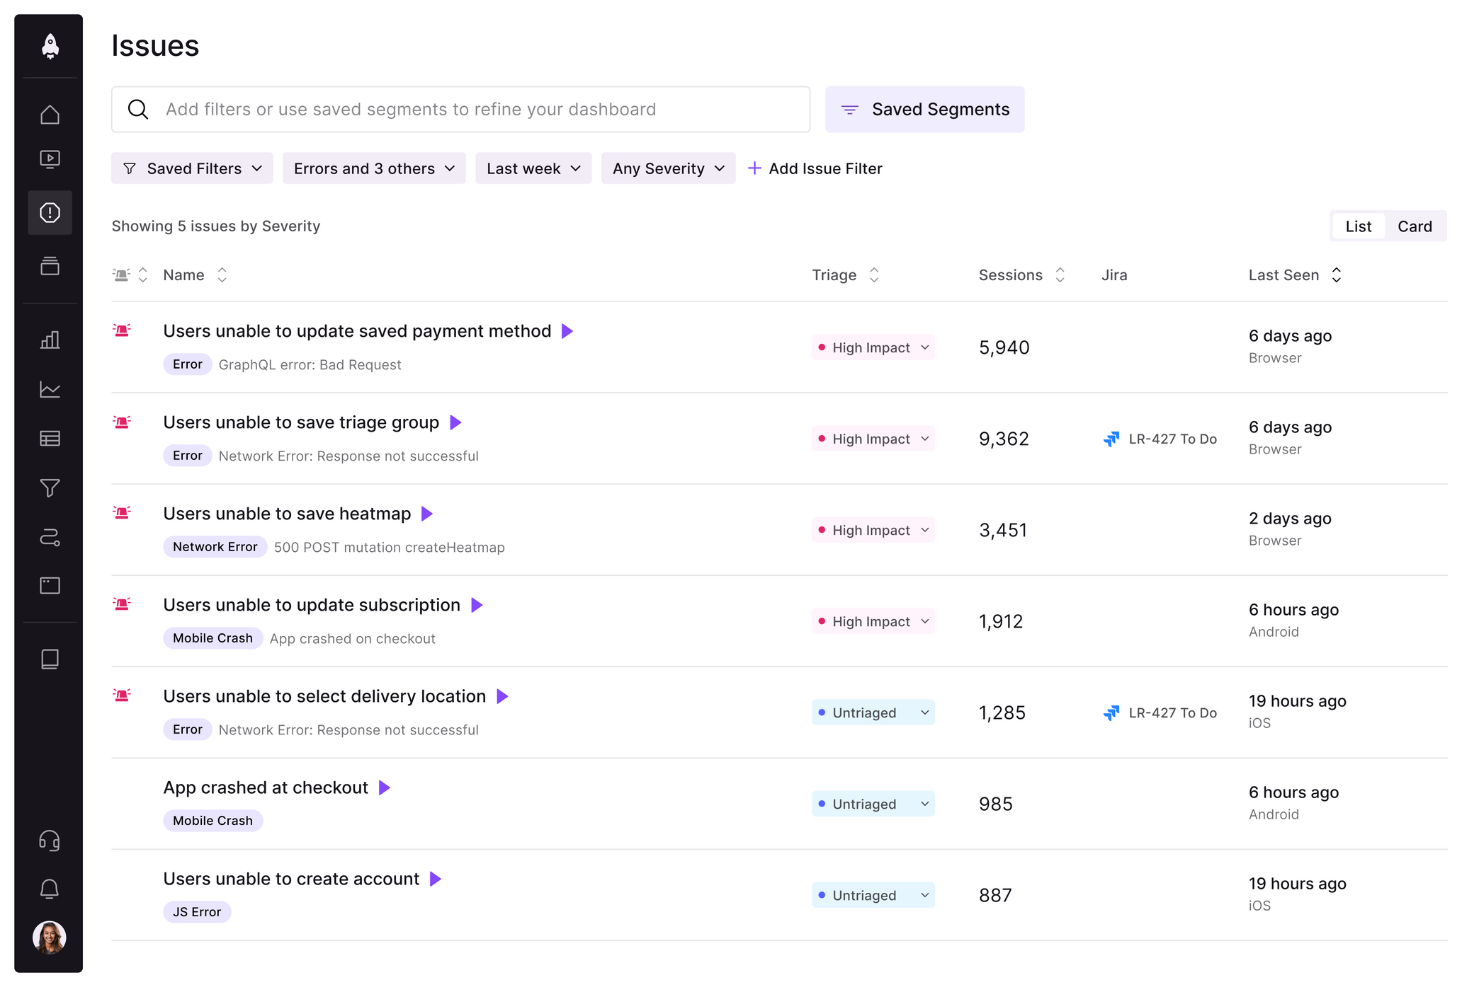
Teams that want to measure and improve application reliability often turn to BugSnag as a Sentry alternative. It’s built for engineering and product teams who need detailed stability scores and actionable error insights across web and mobile apps. BugSnag stands out for its stability score reporting, which helps you prioritize fixes based on real user impact rather than just error volume.
Why BugSnag Is a Good Sentry Alternative
Unlike many error monitoring tools, BugSnag gives you a stability score that quantifies how reliable your application is for end users. I picked BugSnag because its stability score reporting lets you track release health and set clear targets for error budgets.
You can drill down into error trends by release, device, or user segment, making it easier to prioritize fixes that matter most. This focus on actionable reliability metrics helps teams move beyond just tracking errors to actually improving user experience.
BugSnag Key Features
Some other features in BugSnag that are useful for teams comparing Sentry alternatives include:
- Breadcrumbs: Capture a timeline of events leading up to each error for easier debugging.
- Session tracking: Monitor user sessions to understand how errors affect user experience.
- Custom error grouping: Adjust how errors are grouped to reduce noise and focus on unique issues.
- Release tracking: Track errors by deployment version to quickly identify problematic releases.
BugSnag Integrations
Integrations include Slack, Microsoft Teams, Jira, PagerDuty, and more.
Pros and Cons
Pros:
- Custom error grouping reduces alert noise
- Supports error monitoring for mobile platforms
- Stability score quantifies app reliability trends
Cons:
- Limited support for distributed tracing
- No built-in performance monitoring tools
Teams that need instant visibility into production errors often turn to Rollbar for its real-time error grouping capabilities. This tool is especially useful for engineering and DevOps teams who want to quickly identify, categorize, and resolve issues as they happen. Rollbar helps you cut through noise by automatically grouping related errors, so you can focus on what matters most.
Why Rollbar Is a Good Sentry Alternative
If you’re looking for a tool that excels at surfacing and organizing errors as they happen, Rollbar is a strong Sentry alternative. I picked Rollbar because its real-time error grouping automatically clusters related issues, so you don’t waste time sorting through duplicate alerts.
The platform’s live error feed and instant notifications help teams respond to new problems as soon as they occur. This focus on real-time grouping and visibility makes Rollbar especially useful for fast-moving development teams.
Rollbar Key Features
Some other features in Rollbar that are valuable for teams comparing Sentry alternatives include:
- Deploy tracking: Monitor errors introduced by new code deployments and link them to specific releases.
- Telemetry data: Capture detailed logs and breadcrumbs leading up to each error for better debugging context.
- Custom alert rules: Set up personalized notification triggers based on error type, frequency, or severity.
- SDK support for multiple languages: Integrate Rollbar with applications built in Python, JavaScript, Ruby, PHP, and more.
Rollbar Integrations
Integrations include Slack, Jira, GitHub, GitLab, Microsoft Teams, PagerDuty, Trello, Asana, Bitbucket, and FullStory.
Pros and Cons
Pros:
- Telemetry data provides detailed debugging context
- Supports deploy tracking for release monitoring
- Real-time error grouping reduces alert noise
Cons:
- Fewer analytics features than Sentry
- Limited support for performance monitoring
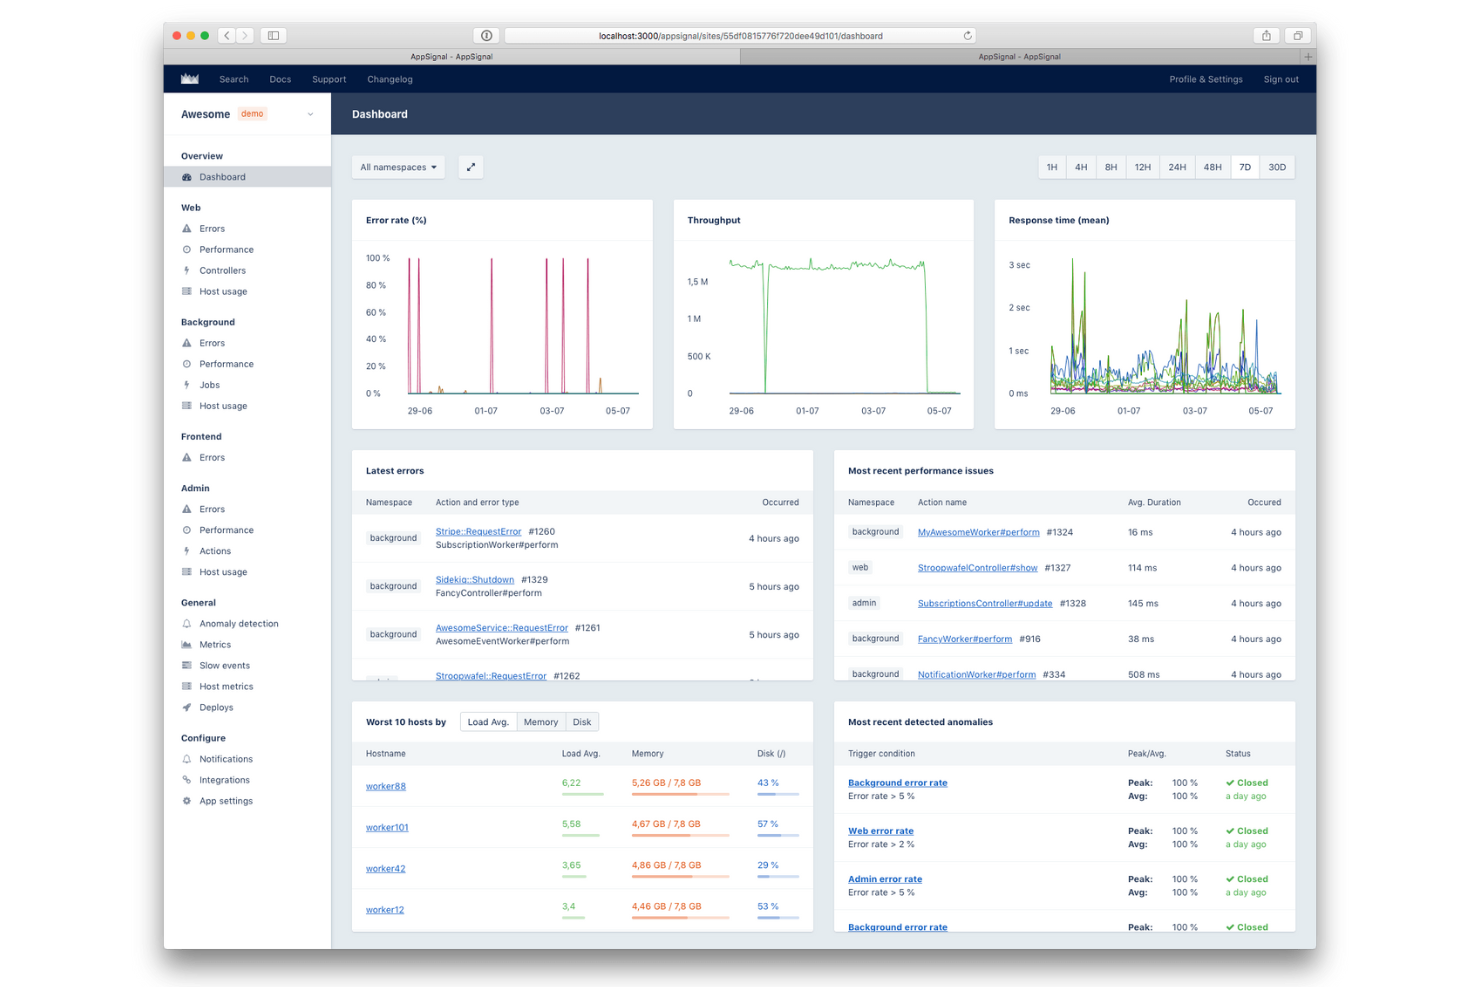
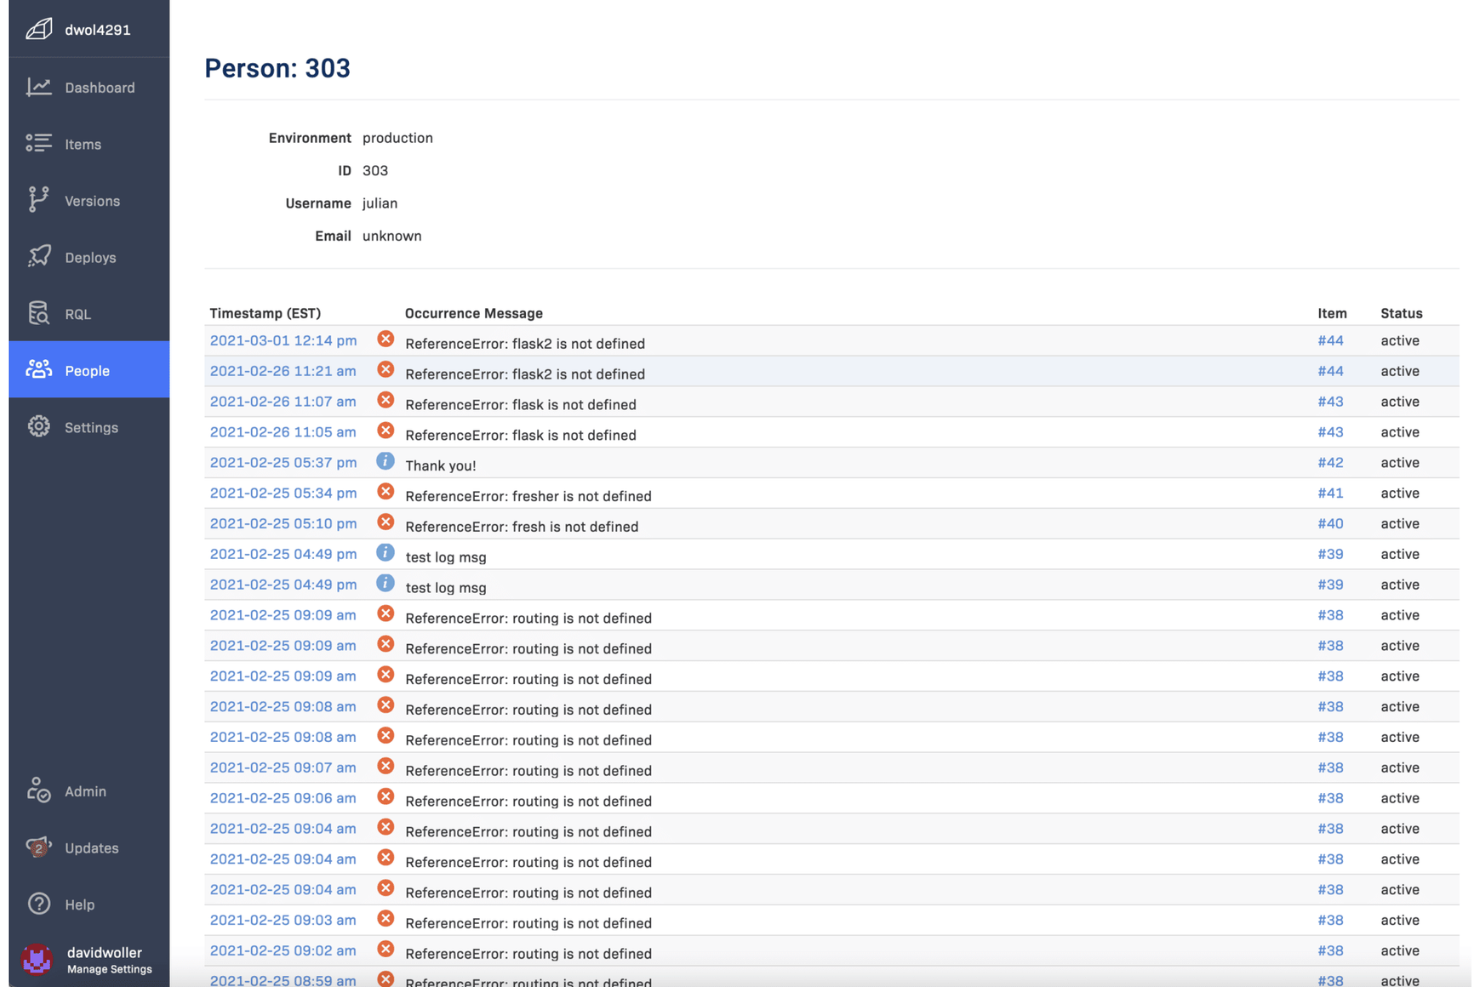
If you’re looking for a Sentry alternative that’s especially easy to set up in Ruby environments, AppSignal is worth a close look. It’s designed for developers and engineering teams who want fast, reliable error tracking and performance monitoring without complex configuration.
AppSignal stands out for its Ruby-first approach, offering native integrations and automatic instrumentation that help teams get started quickly and focus on debugging, not setup.
Why AppSignal Is a Good Sentry Alternative
For teams working primarily with Ruby applications, AppSignal offers a setup process that’s much simpler than most Sentry alternatives. I picked AppSignal because it provides native Ruby support, automatic instrumentation, and pre-built dashboards tailored for Ruby environments.
You can monitor errors, performance, and host metrics without needing to manually configure complex settings or add extra dependencies. This focus on Ruby-first functionality helps developers get actionable insights quickly, making it a strong choice for anyone prioritizing fast deployment in Ruby projects.
AppSignal Key Features
Some other features in AppSignal that are helpful for teams evaluating Sentry alternatives include:
- Anomaly detection: Automatically flags unusual spikes or drops in application metrics.
- Custom dashboards: Build and customize dashboards to visualize key metrics and events.
- Host monitoring: Track server health, CPU, memory, and disk usage alongside application data.
- Alerting system: Set up alerts for errors, performance issues, or custom metric thresholds.
AppSignal Integrations
Integrations include Ruby on Rails, Elixir, Phoenix, Sidekiq, Redis, PostgreSQL, MySQL, and AWS Lambda.
Pros and Cons
Pros:
- Built-in anomaly detection for metrics
- Automatic instrumentation for background jobs
- Native support for Ruby, Elixir, and Node.js
Cons:
- Limited language support outside Ruby and Elixir
- No support for mobile or frontend frameworks
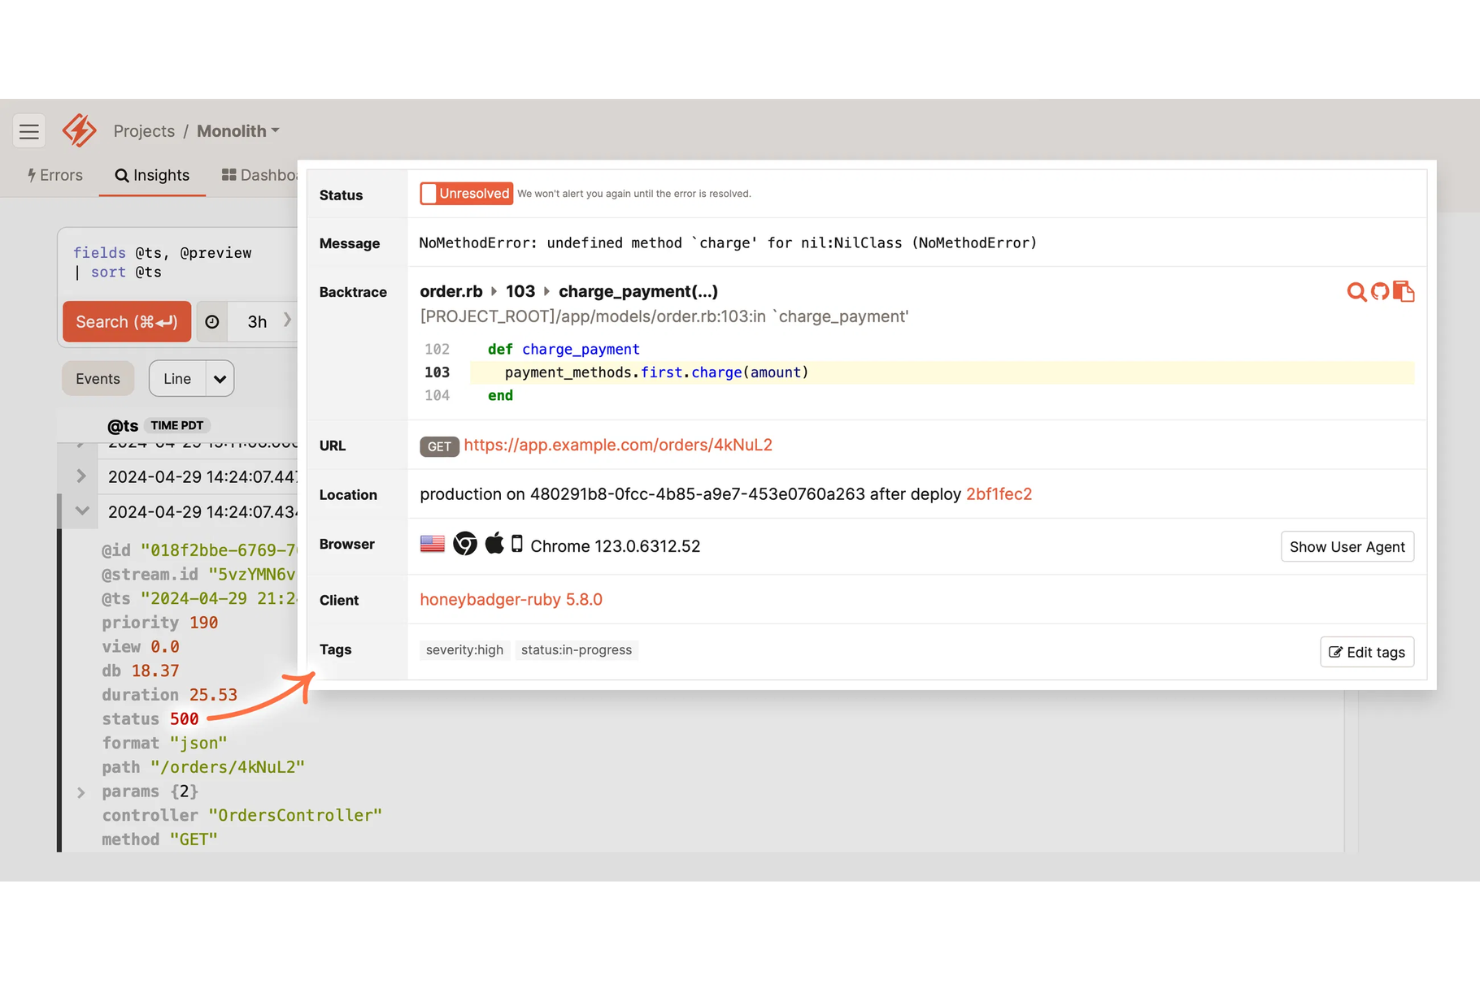
If you’re looking for a Sentry alternative that combines uptime monitoring with error alerting, Honeybadger is worth a close look. It’s designed for engineering teams and SaaS businesses that want to catch outages and application errors in one place. Honeybadger stands out by offering unified alerts for both downtime and exceptions, so you can respond quickly to issues that affect your users.
Why Honeybadger Is a Good Sentry Alternative
For teams that want both uptime and error alerts in one platform, Honeybadger offers a unique approach compared to Sentry. I picked Honeybadger because it combines real-time uptime monitoring with detailed error tracking, so you can catch both outages and application exceptions from a single dashboard.
The tool sends instant alerts for downtime and errors, helping you respond quickly to incidents that impact users. This all-in-one alerting system is especially useful for SaaS businesses and web app teams that need to minimize both outages and bugs.
Honeybadger Key Features
Some other Honeybadger features that are helpful for teams comparing Sentry alternatives include:
- Error aggregation: Group similar errors together to reduce alert fatigue and focus on unique issues.
- Deploy tracking: Monitor deployments and correlate them with new errors or outages.
- Customizable alert channels: Send notifications to Slack, email, SMS, or webhooks based on your team’s preferences.
- Public status pages: Share real-time uptime and incident information with your users through hosted status pages.
Honeybadger Integrations
Integrations include GitHub, GitLab, Bitbucket, Slack, PagerDuty, Jira, Trello, Microsoft Teams, AWS Lambda, and Heroku.
Pros and Cons
Pros:
- Deploy tracking links errors to releases
- Public status pages for incident communication
- Uptime and error alerts in one dashboard
Cons:
- Fewer SDKs for less common languages
- Lacks distributed tracing capabilities
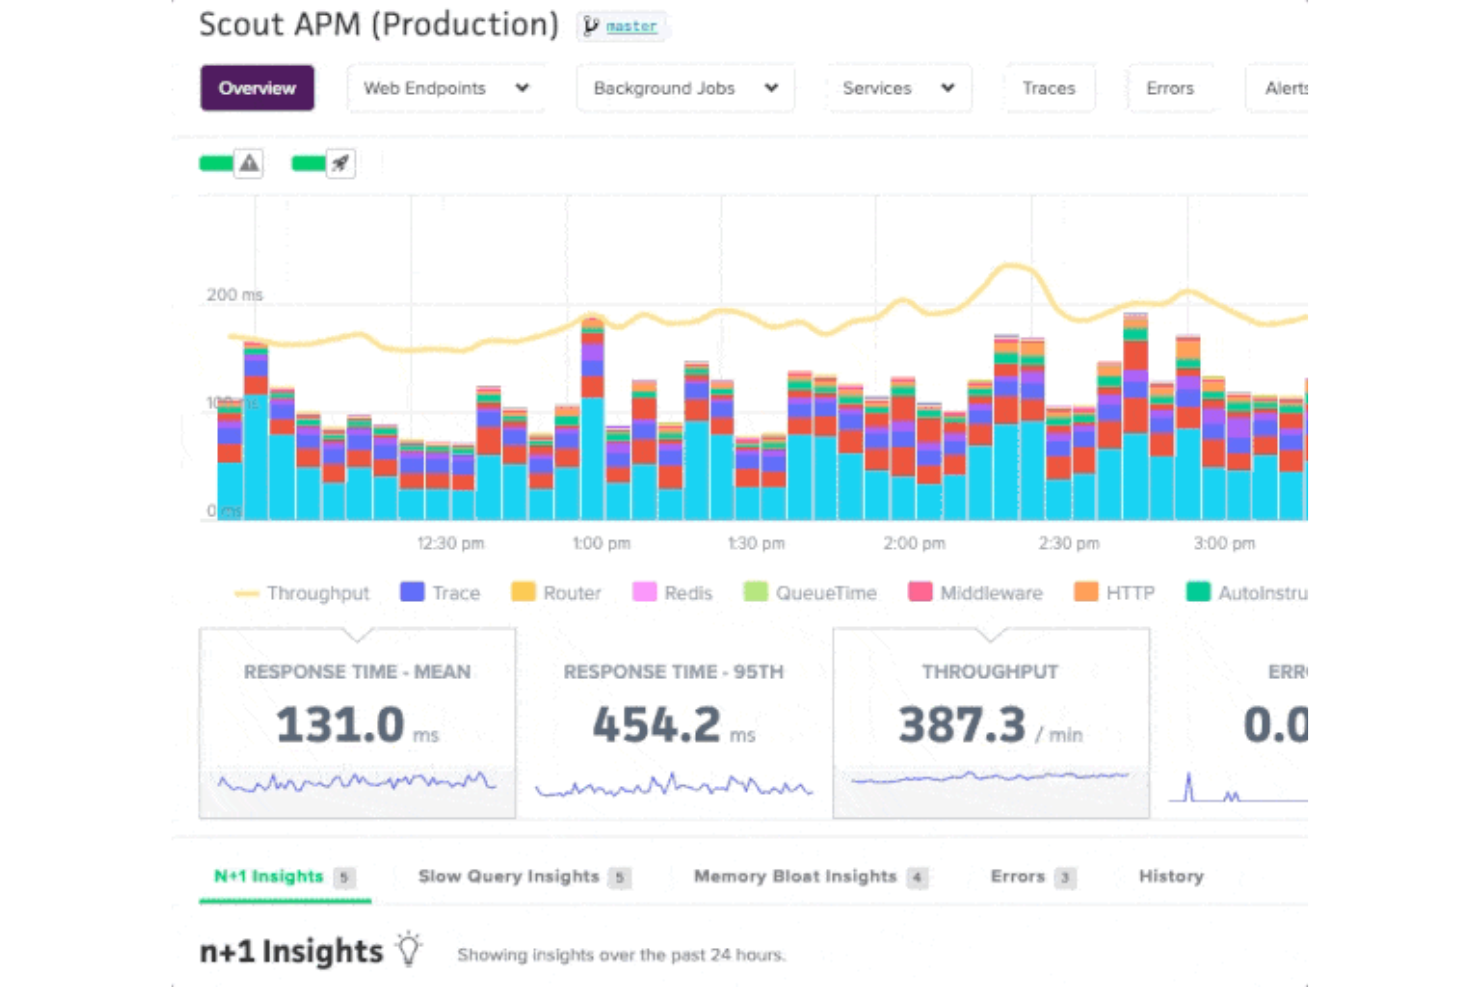
When you need to identify exactly where your application slows down, Scout offers deep performance insights that go beyond error tracking. This tool is a strong fit for engineering teams and SaaS businesses that want to diagnose and resolve performance bottlenecks at the code level. Unlike Sentry, Scout specializes in tracing slow database queries, memory bloat, and endpoint latency, helping you optimize user experience.
Why Scout Is a Good Sentry Alternative
If your main concern is finding and fixing performance bottlenecks, Scout offers a focused solution that Sentry doesn’t match. I picked Scout because it provides detailed transaction traces and pinpoints slow database queries, so you can quickly identify what’s slowing down your application.
The tool also highlights memory bloat and tracks endpoint latency, giving you a clear view of where performance issues originate. For teams that want to go beyond error alerts and actually optimize application speed, Scout brings specialized features that fill the gap left by Sentry.
Scout Key Features
Some other features in Scout that are useful for teams considering Sentry alternatives include:
- GitHub integration: Link performance issues directly to specific commits and code changes.
- Custom dashboards: Build dashboards to visualize key metrics and trends for your applications.
- Alerting rules: Set up custom alerts for specific performance thresholds or anomalies.
- Tag-based filtering: Filter and segment performance data by tags such as environment, server, or deployment.
Scout Integrations
Integrations include GitHub, GitLab, Bitbucket, Slack, PagerDuty, Datadog, New Relic, AWS, Heroku, and Azure.
Pros and Cons
Pros:
- Tag-based filtering for granular data analysis
- Custom dashboards for performance visualization
- GitHub integration links issues to commits
Cons:
- No built-in log management features
- No error tracking for frontend JavaScript
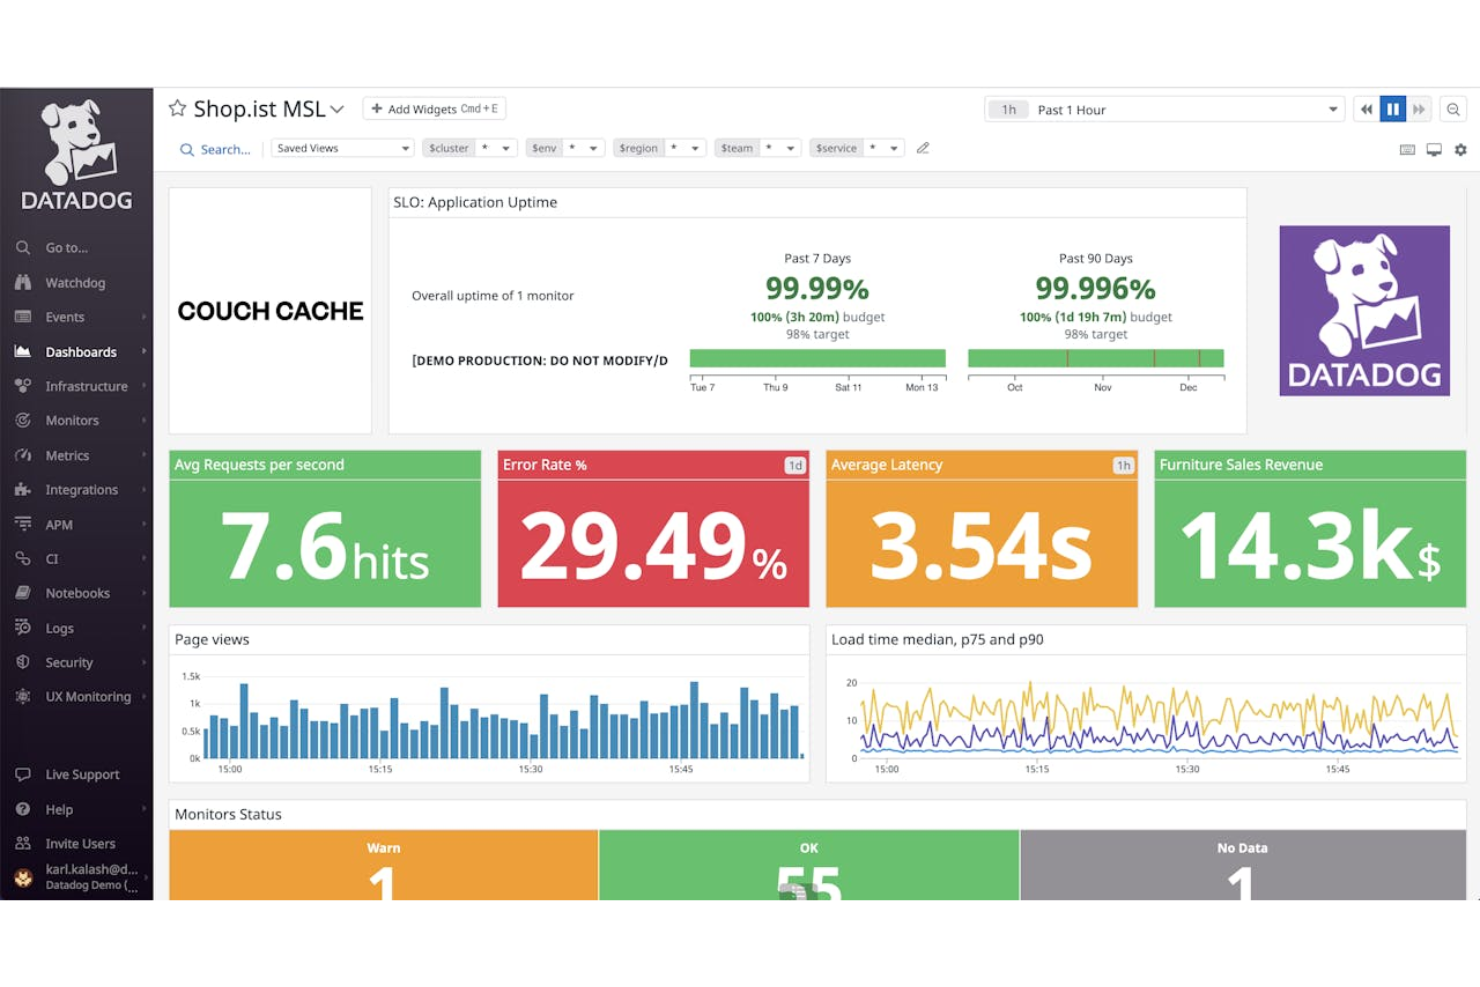
If your team manages cloud-native applications and infrastructure, Datadog brings together monitoring, error tracking, and observability in one platform. It’s especially useful for DevOps teams and enterprises running distributed systems that need to correlate errors with infrastructure and service health. Datadog stands out from other Sentry alternatives by offering deep integrations with cloud providers and real-time visibility across your entire stack.
Why Datadog Is a Good Sentry Alternative
For teams operating in cloud-native environments, Datadog offers monitoring capabilities that go far beyond basic error tracking. I picked Datadog as a Sentry alternative because it provides unified visibility into both application errors and the underlying cloud infrastructure.
With features like distributed tracing and real-time service maps, you can quickly pinpoint the root cause of issues across complex, multi-cloud systems. This makes Datadog especially valuable for organizations that need to connect application health with infrastructure performance.
Datadog Key Features
Some other features in Datadog that are useful for teams comparing Sentry alternatives include:
- Log management: Collect, search, and analyze logs from multiple sources in a single platform.
- Synthetic monitoring: Simulate user interactions to proactively test application endpoints and workflows.
- Security monitoring: Detect threats and monitor security signals across your infrastructure and applications.
- Custom alerting: Set up tailored alerts based on specific metrics, thresholds, or anomaly detection.
Datadog Integrations
Integrations include AWS, Azure, Google Cloud Platform, Kubernetes, Docker, Slack, PagerDuty, Jenkins, GitHub, and Terraform.
Pros and Cons
Pros:
- Synthetic monitoring tests APIs and user journeys
- Distributed tracing visualizes request flows end-to-end
- Cloud-native monitoring covers infrastructure and apps
Cons:
- Setup complexity for multi-cloud environments
- Log retention is limited on lower tiers
Otras alternativas a Sentry
Aquí tienes algunas alternativas adicionales a Sentry que no entraron en mi lista corta, pero que igual vale la pena consultar:
- Better Stack
With incident timeline visualization
- Dash0
For multilingual error monitoring


Criterios de selección de alternativas a Sentry
Al seleccionar las mejores alternativas a Sentry para incluir en esta lista, consideré necesidades y puntos de dolor comunes de los compradores de productos alternativos a Sentry, como querer un monitoreo de rendimiento más granular y la necesidad de mejor integración con los flujos de trabajo existentes de los desarrolladores. También utilicé el siguiente marco para que mi evaluación fuera estructurada y justa:
Funcionalidad principal (25% de la puntuación total)
Para ser considerado en esta lista, cada solución debía cumplir estos casos de uso comunes:
- Capturar e informar errores de aplicación
- Monitorear métricas de rendimiento de la aplicación
- Proporcionar alertas en tiempo real para incidentes
- Ofrecer trazabilidad detallada de errores y rendimiento
- Soportar múltiples lenguajes de programación
Otras funciones destacadas (25% de la puntuación total)
Para ayudar a reducir aún más la competencia, también busqué funciones únicas, como:
- Herramientas avanzadas para el análisis de causas raíz
- Paneles y reportes personalizables
- Integración con repositorios de código
- Soporte para trazabilidad distribuida
- Detección automática de anomalías
Usabilidad (10% de la puntuación total)
Para obtener una idea sobre la facilidad de uso de cada sistema, consideré lo siguiente:
- Interfaz de usuario simple e intuitiva
- Navegación clara y estructura de menús evidente
- Acceso rápido a las funciones principales
- Pasos mínimos requeridos para la configuración
- Diseño adaptable a diferentes dispositivos
Incorporación (10% de la puntuación total)
Para evaluar la experiencia de incorporación en cada plataforma, consideré lo siguiente:
- Disponibilidad de guías paso a paso para la configuración
- Acceso a videos de formación y tutoriales
- Recorridos interactivos del producto para nuevos usuarios
- Plantillas predefinidas para casos de uso comunes
- Soporte de chat en vivo o chatbot durante la incorporación
Atención al cliente (10% de la puntuación total)
Para valorar los servicios de soporte al cliente ofrecidos por cada proveedor de software, consideré lo siguiente:
- Disponibilidad de canales de soporte 24/7
- Acceso a una base de conocimientos completa
- Tiempos de respuesta rápidos ante consultas
- Opciones de gestión de cuentas dedicadas
- Foros comunitarios para apoyo entre pares
Relación calidad-precio (10% de la puntuación total)
Para evaluar la relación calidad-precio de cada plataforma, consideré lo siguiente:
- Planes de precios transparentes y flexibles
- Disponibilidad de prueba gratuita o demo
- Funciones incluidas en los planes de nivel inicial
- Costo comparado con herramientas similares
- Descuentos para facturación anual o por volumen
Opiniones de clientes (10% de la puntuación total)
Para obtener una idea de la satisfacción general, tuve en cuenta lo siguiente al leer las opiniones de los clientes:
- Comentarios positivos sobre la fiabilidad y disponibilidad
- Elogios a la calidad del soporte al cliente
- Informes de resolución exitosa de incidencias
- Comentarios sobre la facilidad de integración
- Críticas sobre funciones ausentes o limitaciones
¿Por qué buscar una alternativa a Sentry?
Aunque Sentry es una buena opción entre las alternativas a Sentry, existen varias razones por las cuales algunos usuarios buscan soluciones diferentes. Es posible que busques una alternativa a Sentry porque…
- Necesitas un monitoreo de rendimiento más profundo que solo la detección de errores
- Tu equipo desea opciones de integración más flexibles
- Requieres soporte para lenguajes de programación menos comunes
- Necesitas mayor visibilidad sobre problemas en el backend o la infraestructura
- Tu organización tiene requisitos estrictos de residencia de datos
- Quieres herramientas más avanzadas para el análisis de causas raíz
Si alguna de estas situaciones te resulta familiar, has llegado al lugar adecuado. Mi listado contiene varias alternativas a Sentry que se adaptan mejor a equipos que enfrentan estos desafíos y buscan soluciones diferentes.
Funciones clave de Sentry
A continuación, algunas de las funciones clave de Sentry, para que puedas contrastar y comparar lo que ofrecen las soluciones alternativas:
- Seguimiento y alertas de errores en tiempo real
- Monitoreo del rendimiento para aplicaciones web y móviles
- Rastreo detallado de pilas para depuración
- Seguimiento de versiones y gestión de lanzamientos
- Integración con repositorios de código populares
- Asignación de incidencias y gestión de flujos de trabajo
- Análisis de impacto en usuarios y seguimiento de sesiones
- Soporte para múltiples lenguajes de programación
- Tableros y reportes personalizables
- "Breadcrumbs" para rastrear acciones de usuario previas a los errores
¿Qué sigue?
Si estás investigando alternativas a Sentry, conéctate con un asesor de SoftwareSelect para recibir recomendaciones gratis.
Llenas un formulario y tienes una breve charla donde profundizan en los detalles de tus necesidades. Luego recibirás una lista corta de software para revisar. Incluso te apoyarán durante todo el proceso de compra, incluyendo la negociación de precios.