10 Best Digital Experience Monitoring Tools For 2026

10 Best Digital Experience Monitoring Tools


Digital experience monitoring (DEM) tools help you track and optimize how users interact with your digital channels in real time. If you're dealing with performance issues, customer drop-offs, or limited visibility into digital journeys, DEM tools can help you identify problems faster and deliver smoother, more reliable experiences.
In this article, I draw from my personal experience with researching and testing leading CX software to review the best digital experience monitoring tools for optimizing user satisfaction and digital reliability.
Why Trust Our Software Reviews
We’ve been testing and reviewing software since 2020. As CX leaders ourselves, we know how critical and difficult it is to make the right decision when selecting software.
We invest in deep research to help our audience make better software purchasing decisions. We’ve tested more than 2,000 tools for different CX use cases and written over 1,000 comprehensive software reviews. Learn how we stay transparent & our software review methodology.
The 20 Best Digital Experience Monitoring Tools: Pricing Comparison Chart
This comparison chart summarizes basic details about each of my top digital experience monitoring software selections. You can view pricing details and the availability of free trials or demos side-by-side to help you find the best tool for your budget and business needs.
| Tool | Best For | Trial Info | Price | ||
|---|---|---|---|---|---|
| 1 | Best for real-time website monitoring | 30-day free trial + free demo available | From $10/month (billed annually) | Website | |
| 2 | Best for visualizing user interactions | Free plan available | From $39/month (billed annually) | Website | |
| 3 | Best for real-time user behavior insights | Free plan + free demo available | Pricing upon request | Website | |
| 4 | Best for uptime and performance monitoring of web applications | 30-day free trial + demo available | From $10/month | Website | |
| 5 | Best for real-time session replay | Free demo available | Pricing upon request | Website | |
| 6 | Best for application performance management | Free trial available | Pricing upon request | Website | |
| 7 | Best for software analytics | Free plan available | From $49/user/month | Website | |
| 8 | Best for end-to-end diagnostics from code to user session | 14-day free trial + free demo available | From $40/100,000 errors/month (billed annually) | Website | |
| 9 | Best for customer success management | Free demo available | Pricing upon request | Website | |
| 10 | Best for observing real end-user steps, experience and bottlenecks | Free demo + free trial available | Pricing upon request | Website |
-

SupportYourApp
Visit WebsiteThis is an aggregated rating for this tool including ratings from Crozdesk users and ratings from other sites.4.7 -
Tidio
Visit WebsiteThis is an aggregated rating for this tool including ratings from Crozdesk users and ratings from other sites.4.7 -
Freshdesk
Visit WebsiteThis is an aggregated rating for this tool including ratings from Crozdesk users and ratings from other sites.4.4


Overviews Of The 20 Best Digital Experience Monitoring Tools
To help you find the digital experience monitoring tool for you, I’ve provided detailed summaries of my top 20 choices and explained why I included each option in this list. I’ve also highlighted their noteworthy features, pros & cons, and best use cases to help you find the best option for your needs.
Plus, I’ve included some additional options below, in case you’d like even more choices to consider.

Site24x7 offers a dynamic solution tailored for businesses eager to optimize user interactions and application performance. This tool provides real-time insights through synthetic and real user monitoring, addressing performance challenges and ensuring seamless digital operations. With its broad integration capabilities and focus on enhancing user satisfaction, Site24x7 stands out as a versatile choice for IT teams looking to proactively manage and improve digital environments.
Why I Picked Site24x7
I picked Site24x7 for its unparalleled real-time website monitoring capabilities, which are crucial for businesses focused on maintaining optimal digital experiences. Its synthetic monitoring feature allows you to simulate user interactions and monitor transaction flows, providing detailed insights into performance bottlenecks. Additionally, the real user monitoring (RUM) feature offers a comprehensive view of actual user experiences across web and mobile platforms, ensuring that you can address issues affecting user satisfaction. With its global monitoring from over 130 locations, Site24x7 ensures that your website's uptime and performance are consistently tracked, making it an invaluable tool for those dedicated to enhancing digital presence.
Site24x7 Key Features
In addition to its real-time website monitoring capabilities, Site24x7 offers a range of features designed to enhance digital experience monitoring.
- Log Management: Centralizes log collection and analysis, providing a streamlined approach to troubleshooting and identifying issues within your digital infrastructure.
- Network Monitoring: Offers comprehensive network performance tracking, including configuration management and IP management, ensuring your network remains healthy and efficient.
- Application Performance Monitoring (APM): Delivers insights into application health and user journeys, helping you understand and enhance user experiences across various platforms.
- AIOps: Utilizes artificial intelligence for anomaly detection and IT automation, allowing your team to proactively address potential issues before they impact user experience.
Site24x7 Integrations
Integrations include ServiceNow, PagerDuty, Jira, Slack, Microsoft Teams, Zoho Flow, Zapier, Opsgenie, ManageEngine, and Freshdesk.
Pros and Cons
Pros:
- AI-driven anomaly detection enhances proactive issue identification
- User-friendly interface simplifies navigation and data interpretation
- All-in-one platform for a variety of monitoring features
Cons:
- Complex data presentation can be challenging for non-technical users
- Limited offline access to monitoring data hinders flexibility
New Product Updates from Site24x7
Site24x7 Adds Synchronization Statuses for MSPs
Site24x7 now provides MSPs enhanced alerts and synchronization statuses in a centralized notification center to spot configuration sync issues sooner and accelerate incident response. For more information, visit Site24x7's official site.


Hotjar is a digital experience monitoring tool renowned for its focus on visualization. It allows you to track and understand user behavior on your website through heatmaps, session recordings, and conversion funnels, allowing website owners and marketers to gain insights into how users interact with their website.
In a recent conversation, Ritika Dubash, CEO & Founder, HowToDigital, explained why she needed Hotjar. “I needed fast, visual proof of what people actually do on our site without begging devs for custom tracking. Hotjar gave me heatmaps, recordings, and on-page surveys in one place. Before implementing Hotjar we used GA4, Clarity, and a separate survey tool. Hotjar was simpler for the team to use, easier to share, and better for getting non-technical stakeholders to buy into changes from a CRO perspective.”
Why I picked Hotjar: I selected Hotjar because of its unique and visually-appealing way of representing user interactions. For example, Hotjar offers different types of heatmaps, including click heatmaps, move heatmaps, and scroll heatmaps. It additionally offers session recordings, which are video recordings of individual user sessions on your website. These recordings capture the user's mouse movement, clicks, scrolls, and other interactions, allowing you to replay and analyze their behavior.
By leveraging these visualizations, website owners and marketers can gain valuable insights into user behavior and make data-driven decisions to improve website design, layout, and overall user experience.
Standout Features & Integrations:
Features include conversion funnels, form analytics, feedback polls, surveys, behavior analytics, multi-device support, features to help recruit user testers, and feedback buttons that can be embedded into your websites.
Integrations include Slack, Jira, HubSpot, Asana, Trello, WordPress, Shopify, Webhooks, Mixpanel, and Google Analytics.
Pros and Cons
Pros:
- One-stop tool for qualitative website analysis
- Offers detailed user data and actionable insights
- User-friendly, intuitive interface
Cons:
- Data storage is limited in the basic plan
- Advanced features only available at higher pricing tiers
- No free version for commercial use

FullStory is a behavioral data analytics platform that offers businesses insights into user interactions and sentiments through real-time data visualization. It helps technology leaders make better, more informed, and customer-centric decisions by injecting digital behavioral data into their analytics stack, providing quality behavioral data at scale.
Why I Picked FullStory: In my opinion, FullStory stands out due to its advanced suite of features designed to enhance user experience and provide actionable insights. One of the key features is its Product Analytics, which allows businesses to delve deep into user interactions through intuitive dashboards and funnel analytics. By transforming every digital visit into actionable insights, this feature enables organizations to move closer to their customers and detect behaviors like fraud or high-value customer activity more effectively.
Another standout solution is its Behavioral Insights capability. This feature provides real-time monitoring of user interactions, offering a detailed view of how users navigate and engage with digital products. Such insights are crucial for identifying and addressing user frustrations, which can lead to increased conversion rates and improved customer satisfaction.
Standout Features & Integrations:
Features include product analytics, mobile analytics, behavioral insights, session replay, heatmaps, funnels and conversions, journey mapping, and direct data access.
Integrations include Slack, HubSpot, Google Sheets, Intercom, Jira, CopperCRM, Notion, monday.com, and Pipedrive.
Pros and Cons
Pros:
- Effective support for product teams
- Data analytics and reports
- Advanced session replay
Cons:
- Limited data transfer
- Difficulty finding sessions
- Inaccurate feature potentiality
Pingdom
Best for uptime and performance monitoring of web applications

Pingdom gives your team visibility into the availability and performance of web applications, servers and endpoints around the world. It helps you detect downtime, measure page-load performance and alert when user experience suffers.
Why I Picked Pingdom: I picked Pingdom because uptime and response-time are fundamental to digital experience, and this tool delivers on real-world performance monitoring from multiple global locations. When your website or web app is your customer front door, knowing instantly when it slows or fails is critical.
Standout Features & Integrations
Features include synthetic checks of web pages at frequent intervals, real-user monitoring (RUM) of page-load speed, global alerting to notify teams of availability issues, and performance-trend dashboards that tie slowdowns to regions or devices.
Integrations include Slack, PagerDuty, email/SMS alerts, API access and SolarWinds log-management connection.
Pros and Cons
Pros:
- Real-user monitoring adds actual performance context
- Easy to set alert thresholds and notify relevant teams
- Synthetic checks catch downtime and slow-downs
Cons:
- Custom dashboards and visualisation options can feel basic
- Deep code-level diagnostics (APM) are not included

Glassbox is a digital experience analytics platform that provides real-time session replay to aid businesses in understanding user behavior. Its capacity to offer in-depth visibility into customer interactions on apps and websites makes it an essential tool for businesses focusing on customer experience optimization.
Why I picked Glassbox: I chose Glassbox for its strong capabilities in capturing user sessions as they interact with a website or mobile app. The session replay feature then allows businesses to visually replay these sessions, providing a pixel-perfect playback of the user's actions, including mouse movements, clicks, form inputs, and scrolling behavior.
Session replay is also available in real-time, allowing businesses to monitor user sessions as they happen. By observing how users interact with a website or app in real-time, businesses can gain valuable information about user engagement, interests, and interactions with specific elements or features. This capacity to reveal customer behavior patterns sets Glassbox apart from many other tools in the market.
Standout Features & Integrations:
Features include user journey mapping, collaboration and sharing features, conversion funnel analysis, and issue identification and troubleshooting. GlassBox additionally ensures data privacy and compliance by allowing businesses to mask or exclude sensitive information during session replay.
Integrations include Adobe Analytics, Google Analytics, GetFeedback, SurveyMonkey, Qualtrics, Medallia, Jira, Slack, Adobe Target, and Optimizely.
Pros and Cons
Pros:
- Provides robust analytics
- Business flow feature helps track KPIs
- Funnels are searchable and easy-to-use
Cons:
- Requires a learning curve to fully utilize its features
- May not be scaled for smaller businesses
- No transparent pricing structure

AppDynamics, a part of Cisco, is a DEM solution provider that focuses on end-user monitoring (EUM) and tracking business transactions. It also offers end-to-end application performance management (APM) to help businesses ensure peak application performance.
Why I picked AppDynamics: AppDynamics made it to my list because of its extensive focus on application performance management (APM) and its clear emphasis on end-user experience and trend analysis. For example, AppDynamics provides real-time visibility into application performance metrics, transaction tracing, code-level diagnostics, and database monitoring. This allows organizations to identify performance bottlenecks, inefficient code, and database issues impacting application performance.
AppDynamics is also designed to handle large-scale, distributed environments. It can monitor applications across multiple servers, containers, and cloud platforms, including web, mobile, and desktop. This provides visibility into the performance of distributed components, enabling organizations to optimize performance in complex and dynamic architectures.
Standout Features & Integrations:
Features include end-to-end transaction tracing, alerting and proactive issue detection, cloud and microservice monitoring, and dynamic baselining. AppDynamics also allows monitoring and tracking of critical business transactions within applications. It can provide insights into transaction flow, response times, and performance metrics.
Integrations include Medallia, Moogsoft Platform, Contentsquare, Zenduty, SquaredUp, ThousandEyes, Sainapse, Squadcase, Atlassian, and Slack.
Pros and Cons
Pros:
- Provides easy-to-understand graphics and visual data
- Offers customizable alert thresholds
- Simple, straightforward user interface
Cons:
- Advanced features require a steep learning curve
- Business transaction tracking can be slow
- Can be complex for beginners
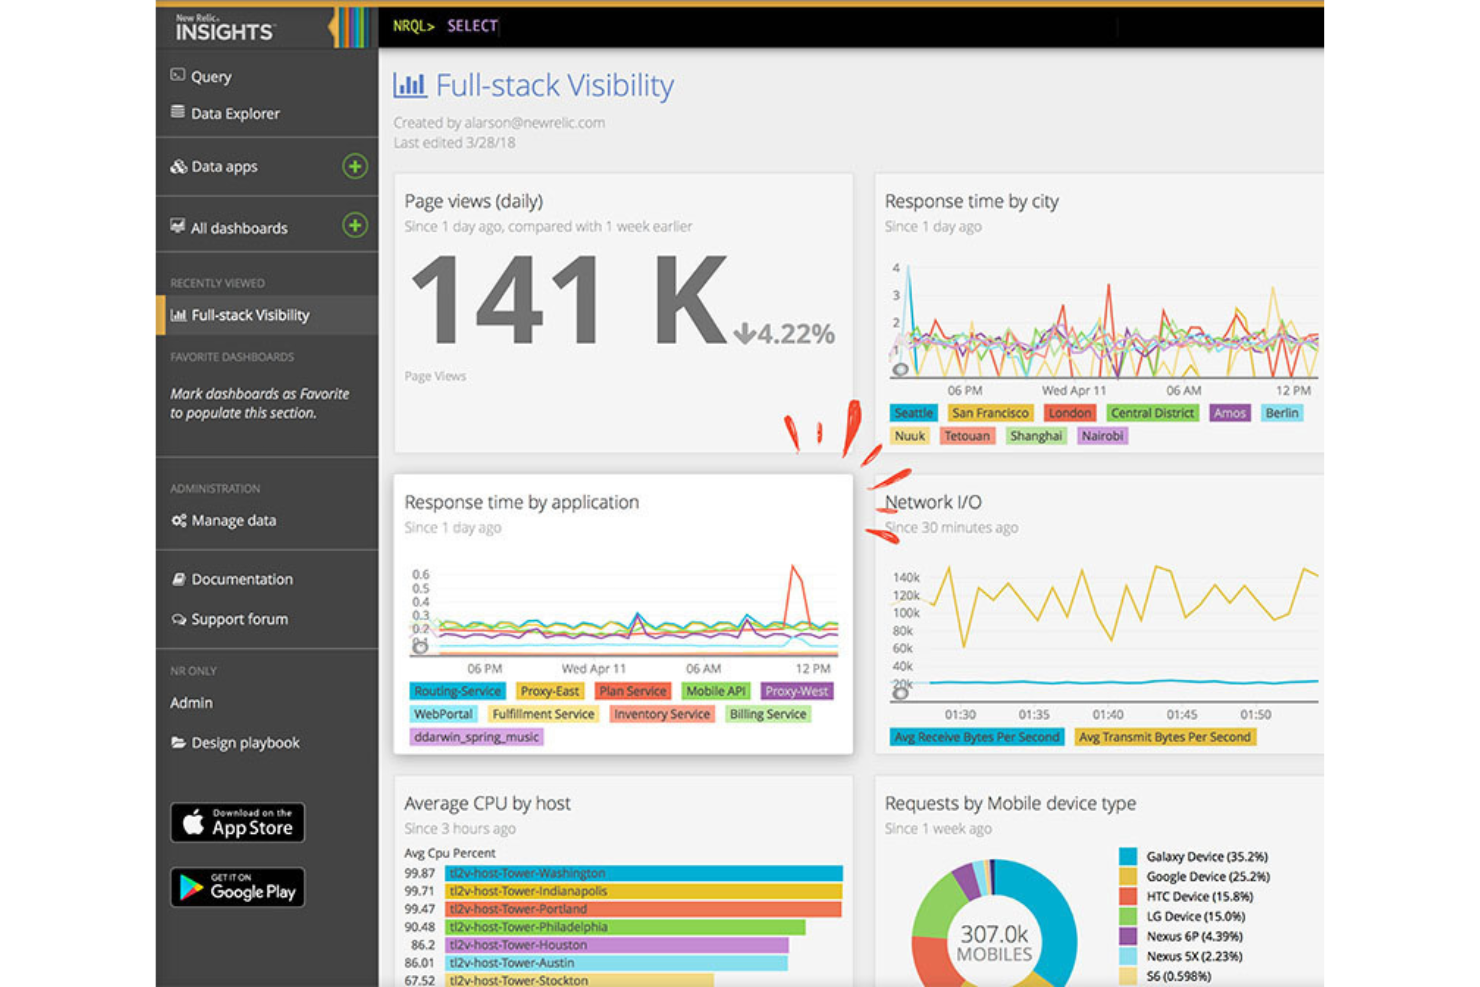
New Relic is an observability platform that enables full-stack visibility and robust software analytics. With a data-driven approach, it helps businesses understand and improve their software performance. Considering its deep software analytics capabilities, New Relic is ideal for those seeking insights into their software systems.
Why I Picked New Relic: I picked New Relic for this list because of its comprehensive ability to gather, analyze, and interpret software data. It particularly stands apart for its 360-degree view of software performance, which is crucial for identifying issues and understanding user experience. For example, New Relic's distributed tracing feature allows you to track requests as they flow through different services and components in a distributed system. This provides end-to-end visibility into request paths, latency, and dependencies.
New Relic also offers mobile application monitoring capabilities, which allow you to monitor the performance and user experience of your mobile apps on different platforms and devices. You can track metrics like app crashes, response times, and user interactions to optimize the performance and usability of your mobile applications.
Standout Features & Integrations:
Features include real-time analytics, end-to-end transaction tracing, synthetic monitoring, infrastructure monitoring, application performance monitoring (APM), and customizable dashboards. It also offers features for software diagnostics, such as error tracking, performance insights, and data visualization.
Integrations include AWS, Microsoft Azure, Google Cloud Platform (GCP), Kubernetes, Prometheus, Cassandra, Elasticsearch, HiveMQ, Kafka, and Linux.
Pros and Cons
Pros:
- Scalable for both small teams and large enterprises
- Provides real-time data for instant insights
- Workload features help group services for efficiency
Cons:
- The user interface can be complex for beginners
- Requires some technical expertise to maximize utility
- Official documentation is limited

Raygun helps your team detect, diagnose and fix software performance issues across applications, services and user sessions. It surfaces errors, slowdowns and crashes in real-time so you can trace root causes and improve user experience.
Why I Picked Raygun: I picked Raygun because it bridges application performance monitoring (APM) and error tracking in one tool, making it ideal when development and operations teams share responsibility for user experience. It supports full lifecycle diagnostics—code errors, session traces, release tracking—which helps you move from issue detection to resolution faster.
Standout Features & Integrations:
Features include crash and error reporting across platforms, session tracing that lets you follow a user’s journey to a fault, performance-metric capture (such as slow requests or memory use), and release/deploy tracking so you know when issues began.
Integrations include GitHub, GitLab, Jira, Slack, Azure DevOps, AWS, SAML SSO, webhooks and REST API.
Pros and Cons
Pros:
- Integrates tightly with dev tools and alerting workflows
- Traces performance issues across back-end, browser and mobile
- Captures code-level errors and user session context
Cons:
- Advanced setup and fine-tuning may require developer resources
- UX and dashboard design feel more dev-focused, less UX-friendly
Totango is a customer success platform designed to provide real-time, actionable insights about customers. It aims to assist businesses with customer success management by driving customer engagement, reducing churn, and maximizing customer lifetime value.
Why I picked Totango: I chose Totango for this list because of its ability to simplify complex customer success processes using a proactive and goal-oriented approach to managing customer relationships. For example, Totango provides tools for businesses to engage with customers proactively. This enables personalized and automated communications, such as in-app messaging, emails, and notifications, to nurture customer relationships, provide support, and drive desired actions.
Totango also enables businesses to monitor the health and engagement of their customers. It tracks various metrics and signals to assess customer satisfaction, product adoption, and usage patterns. This helps organizations identify at-risk customers and take proactive measures to mitigate churn and drive upsell opportunities.
Standout Features & Integrations:
Features include customer segmentation, role-specific success metrics, customer success workflows and playbooks, customer lifecycle management capabilities, visual dashboards, and custom reports. Totango also facilitates collaboration among customer success teams by providing a centralized platform for sharing customer information, tasks, and notes.
Integrations include Salesforce, Microsoft Outlook, Slack, HubSpot, Jira, Monday, Tableau, Stripe, Zoom, and Google Analytics.
Pros and Cons
Pros:
- Automated processes free up team time for other obligations
- Helps keep track of client information and activities
- User-friendly, intuitive interface
Cons:
- Customer health parameters are not stackable
- High level of customization might lead to complexity
- Lack of transparent pricing
Germain UX
Best for observing real end-user steps, experience and bottlenecks

Germain UX (also seen as Germain Apm/UX) focuses on real user experience (RUX) and performance analytics—tracking user journeys, session replays, performance metrics, and experience issues across applications and web.
Why I Picked Germain UX: I picked Germain UX because it fills the gap between standard application monitoring and real user-experience intelligence. When you want to understand how actual users are impacted by performance or usability issues—across platforms, devices and geographies—this tool is built for that.
Standout Features & Integrations
Features include session recording and replay, real-user monitoring of performance and page-flows, technology monitoring (browser/device detection, errors), automation alerts for user-experience degradation, and journey-based analytics.
Integrations include data export APIs, alerting/webhook connections, CRM/analytics platform links (for segmentation), and customizable plugins for major platforms.
Pros and Cons
Pros:
- Automated alerts on experience deterioration and conversion-impacting issues
- Monitors performance and technology stack together with experience flow
- Real-user session replays show user behaviour in context
Cons:
- Interface and navigation may feel less refined
- Setup and configuration may require technical resources
Other Digital Experience Monitoring Tools
Below is a list of additional digital experience monitoring solutions that I considered for this list. While they didn’t make my top 20, they are still worth checking out. One of them might be the right tool for you!
- Elastic
For log data analysis and visualization
- Contentsquare
For customer journey analytics
- ControlUp
For IT infrastructure monitoring
- eG Innovations
For end-user experience tracking
- Compass
For monitoring digital adoption
- LiveAgent
For real-time visitor monitoring
- Sentry
For error tracking in real-time
- Dynatrace
For AI-powered insights
- Zoho Pagesense
For conversion optimization
- Datadog
For comprehensive cloud-based monitoring
- SolarWinds AppOptics
For a combined infrastructure and application monitoring solution
- Uptrends
For synthetic and real user monitoring
- Catchpoint
For comprehensive digital experience monitoring
- Centreon
For open-source IT operations monitoring
- ThousandEyes
For network intelligence and cloud monitoring
- Moogsoft
For AI-driven IT Operations (AIOps) and observability
- IBM Instana
For application performance management in microservices and cloud environments
- Apica
For testing and monitoring web application performance
- BMC TrueSight
For AIOps-driven automation and cost prediction
- Riverbed SteelCentral
For end-to-end visibility into network and application performance
- Splunk APM
For analyzing and visualizing application performance data


How I Evaluate Digital Experience Monitoring Tools
Digital experience monitoring tools are what SRE teams reach for when a spike in cart abandonment needs to be traced back to a slow API call, or when IT ops needs to prove that a remote employee's Zoom lag is a last-mile network issue and not a VPN misconfiguration. When I evaluate tools in this space, I split my thinking into two layers: the baseline capabilities every tool must cover to earn a spot on this list, and the differentiators that actually separate one pick from another.
Core Functionality (Table Stakes for This List)
For digital experience monitoring tools, the core functionality I test and evaluate is:
- Real user monitoring: I check whether the tool captures actual session data like page loads, interaction delays, and crashes across both web and mobile channels.
- Synthetic monitoring: Scripted transaction checks from distributed locations matter. I evaluate how well a tool simulates multi-step flows like logins or checkouts before users are affected.
- Network path analysis: When a remote worker's app lag could be DNS, ISP, or VPN related, the tool needs to trace every hop. I look for visibility into last-mile connectivity.
- End-to-end journey visualization: I evaluate whether the tool can map a single user request from browser through CDN, API, and microservices layers in one coherent view.
- Experience scoring: Raw metrics aren't enough. I look for composite scores like Apdex that correlate back-end slowdowns with front-end impact such as increased bounce rates.
- Alerting and anomaly detection: Baseline-aware alerts that flag experience degradation relative to normal patterns are what I look for, not just static threshold notifications.
- Multi-channel coverage: A tool that only monitors web pages leaves blind spots. I check for support across mobile apps, SaaS platforms, and API endpoints at minimum.
A tool has to deliver most of these capabilities to earn a spot on the list. From there, I consider what sets each tool apart.
Standout Features (What Separates the Picks)
AI-powered root cause analysis stands out, especially in tools that connect anomalies across microservices or network layers with likely single-point causes. I consider integrations with ITSM systems and CI/CD pipelines essential when teams want closed-loop incident workflows or to tie experience shifts directly to deployments. Advanced support for employee experience—including endpoint analytics for SaaS and VDI—adds value for IT ops teams troubleshooting internal productivity issues.
What I Weigh Beyond Features
Pricing model matters here more than in most categories. I evaluate whether a vendor charges per host, per session, or per GB of telemetry, because high-traffic teams can face unexpected costs with ingestion-based pricing. Deployment flexibility is another factor—regulated industries like healthcare or finance often need on-premises or region-locked data residency options, so I check whether SaaS-only is the only path. I also consider whether a tool suits customer-facing monitoring, employee experience, or both, since that shapes who on your team actually gets value from it.
How to Choose Digital Experience Monitoring Tools
It’s easy to get bogged down in long feature lists and complex pricing structures. To help you stay focused as you work through your unique software selection process, here’s a checklist of factors to keep in mind:
| Factor | What to Consider |
|---|---|
| Scalability | Can the tool grow with your business? Consider future growth, user limits, and data handling capabilities. Look for tools that can scale smoothly. |
| Integrations | Does it work with your existing systems? Ensure it seamlessly connects with current tools to avoid workflow disruption. |
| Customizability | Can you tailor it to your needs? Look for options to adjust dashboards, reports, and alerts to fit your team’s workflow. |
| Ease of use | Is the interface intuitive? Choose tools that require minimal training, allowing your team to focus on monitoring rather than learning the system. |
| Implementation and onboarding | How long does setup take? Assess the time and resources needed to get the tool running effectively. Look for streamlined processes. |
| Cost | Does it fit your budget? Evaluate upfront costs, subscription fees, and hidden charges. Compare value against price. |
| Security safeguards | Are your data and operations protected? Check for encryption, compliance standards, and past security incidents. |
| Support availability | Is help readily available? Ensure robust support options, like 24/7 assistance or dedicated account managers, to solve issues quickly. |
What is a Digital Experience Monitoring Tool?
Digital experience monitoring tools are platforms that track and analyze how users interact with digital services in real time. They help identify performance issues, measure user behavior, and optimize the end-to-end experience across websites, apps, and backend systems.
Features of Digital Experience Monitoring Tools
When selecting digital experience monitoring tools, keep an eye out for the following key features:
- Real-time monitoring: Get instant insights into your users’ interactions and experiences as they happen, so you can spot issues before they turn into headaches. This feature helps you quickly identify slowdowns or outages and respond proactively.
- End-user performance analytics: See how real people experience your digital platforms—right down to load times, errors, and navigation hiccups. This empowers you to make targeted improvements that actually impact your users.
- Synthetic transaction monitoring: Simulate user behavior around the clock by running scripted actions, such as logins or purchases, to catch performance bottlenecks—even while everyone else is sleeping.
- Multi-channel tracking: Track user experiences across web, mobile, and desktop platforms, giving you a holistic view of every touchpoint. It’s your all-in-one lens to keep tabs on the entire digital journey.
- Alerting and notifications: Receive timely alerts when user experiences fall below your benchmarks. This keeps you one step ahead, letting you tackle issues before your users even notice.
- Root cause analysis: Quickly drill down into problems with detailed diagnostics, helping you pinpoint exactly where things went wrong—whether it’s a server hiccup or a flaky network.
- Customizable dashboards: Build your own views using metrics that matter to you. Spot trends, track KPIs, and share results with your team—all from a single, easy-to-understand dashboard.
Common Digital Experience Monitoring Tools AI Features
Beyond the standard digital experience monitoring tools features listed above, many of these solutions are incorporating AI with features like:
- Anomaly detection: Automatically spot unusual patterns in user behavior or performance metrics, so you catch issues that might fly under the radar with traditional monitoring.
- Predictive analytics: Forecast future performance issues or downtimes before they impact your users, using AI to analyze trends and usage patterns.
- Automated issue triage: Let AI assess the urgency and likely cause of problems, helping you prioritize fixes based on business impact rather than guesswork.
- Intelligent user experience scoring: AI evaluates user sessions and assigns experience scores, allowing you to focus on parts of your digital presence that most need improvement.
- Proactive recommendations: Receive AI-powered suggestions for optimizing your digital platforms, from speeding up sluggish pages to reworking confusing navigation paths.
Benefits Of Digital Experience Monitoring Tools
Implementing digital experience monitoring tools provides several benefits for your team and your business. Here are a few you can look forward to:
- Improved user experience: By collecting real-time data on user interactions, these tools help identify and resolve issues that users face, enhancing their overall experience.
- Data-driven decision making: These tools provide insights and analytics that support strategic decisions, allowing you to prioritize improvements based on actual user behavior and needs.
- Enhanced collaboration: With features that promote teamwork, digital experience monitoring tools enable multiple users to contribute to problem-solving and planning, ensuring diverse input is considered.
- Scalability and flexibility: As your organization grows, these tools can adapt to manage an increasing number of users and more complex environments, maintaining their effectiveness.
- Integration with existing systems: By connecting with other platforms like CRMs or project management tools, they ensure smooth data flow and accessibility, helping maintain consistency across systems.
- User-centric design: Focused on understanding user needs, these tools help in collecting feedback and making informed decisions that align with customer expectations.
- Proactive issue resolution: They enable teams to detect and address potential problems before they impact users, reducing downtime and improving reliability.
Costs and Pricing of Digital Experience Monitoring Tools
Selecting digital experience monitoring tools requires an understanding of the various pricing models and plans available. Costs vary based on features, team size, add-ons, and more. The table below summarizes common plans, their average prices, and typical features included in digital experience monitoring tools solutions:
Plan Comparison Table for Digital Experience Monitoring Tools
| Plan Type | Average Price | Common Features |
|---|---|---|
| Free Plan | $0 | Basic monitoring, limited data retention, and community support. |
| Personal Plan | $5-$15/user/month | Enhanced monitoring, customizable alerts, and email support. |
| Business Plan | $20-$50/user/month | Advanced analytics, team collaboration tools, and phone support. |
| Enterprise Plan | $100-$300/user/month | Full customization, dedicated account manager, and 24/7 support. |
Digital Experience Monitoring: Frequently Asked Questions
Digital experience monitoring can be a big task, encompassing massive amounts of data, charts, and insights. If you still need help with some of the basics—that’s okay! I have included some frequently asked questions about digital experience monitoring and digital experience monitoring tools to help you get started.
What should I look for when choosing a digital experience monitoring tool for my organization?
When evaluating digital experience monitoring tools, first consider whether the platform covers all your critical digital channels—such as websites, mobile apps, and cloud services. You’ll want real-time monitoring, user journey analytics, and clear visualization features for quick insights. Strong integration with your existing CX, IT, and analytics systems is vital to avoid data silos. Assess ease of use as well; a complex interface can slow your team down. Finally, prioritize tools with reliable support, strong customization options, and scalability to grow alongside your organization’s needs.
How can digital experience monitoring tools help reduce customer churn?
Digital experience monitoring tools let you detect issues customers encounter, such as slow load times or broken features, before they impact large segments of your audience. By alerting you to these problems early, you can rapidly resolve complaints and improve overall customer satisfaction. Many tools provide reports that reveal patterns behind recurring issues, helping you proactively eliminate friction points. By consistently delivering a smooth digital experience, you increase loyalty and make it less likely customers will leave for a competitor.
Are there any free digital experience monitoring tools?
Yes, several vendors offer free plans or trials. For instance, New Relic provides a free tier with limited features, while tools like Dynatrace offer a time-limited free trial. These can be great options to test out the tool and see if it fits your requirements before committing to a paid plan.
Can digital experience monitoring tools integrate with existing CX and analytics platforms?
Yes, most reputable digital experience monitoring solutions are built to integrate seamlessly with existing CX, analytics, and IT service management platforms. Many offer pre-built connectors for popular tools like Salesforce, Google Analytics, and Slack, or provide open APIs for custom integrations. This helps you combine user behavior data with broader business metrics, creating a unified view for all your stakeholders. Before committing, confirm that the tool supports the integrations you rely on, and ask about any extra costs or technical requirements.
How quickly can my team identify and resolve issues with digital monitoring tools?
A good digital monitoring tool will drastically reduce your team’s time to detect and resolve issues. Real-time dashboards, user session recordings, and automated alerts notify your team the moment performance drops or errors occur. This means you can often address problems before most customers even notice them. Advanced platforms also help you pinpoint root causes, speeding up troubleshooting and reducing downtime. Over time, the data collected lets you optimize digital touchpoints and prevent similar problems from reoccurring.
What are common implementation challenges with digital experience monitoring software?
You might encounter hurdles during rollout like connecting the tool to legacy apps, mapping complex user journeys, or ensuring full data privacy compliance. Training team members on new workflows can also be resource intensive. It’s common to find that pulling data from all relevant sources (websites, mobile, APIs) may need specialized configuration.
To smoothen the process, partner closely with your vendor for onboarding support and use their guided tutorials or customer success resources. Setting clear goals and involving IT, CX, and business leads from the start will help ensure a successful deployment.
More Digital Experience Software Reviews
Managing digital customer experience involve many moving parts. If you’re in need of more or different tools to help you manage your customers’ digital experiences—or if you just want to see what’s out there—feel free to check out some of our other articles on the subject:
- Digital Experience Platforms
- Customer Experience Management Software
- Usability Testing Tools for UX
- UX Testing Software
- Session Recording Software
Final Thoughts
After reading this article, I hope you understand that the market for digital experience monitoring tools offers a highly diverse range of options, each with unique strengths, be they in-depth analytics, AI-powered insights, or detailed log analysis. Therefore, the first step in your search for a digital experience monitoring tool should be to determine what exactly you need.
Looking for more customer experience tools reviews, tips and tricks, or expert advice? Sign up for our newsletter for access to the latest industry insights.