10 Meilleurs Concurrents de Dynatrace Passés en Revue en 2026

Meilleures alternatives à Dynatrace : sélection rapide


En tant que responsable de l'expérience client, vous devez relever de nombreux défis. Vous avez besoin d’outils d’observabilité des données permettant à votre équipe de suivre les problèmes de performance, de gérer les ressources et de garantir la satisfaction de vos clients. Dynatrace est populaire, mais il se peut qu’il ne réponde pas exactement à vos besoins spécifiques.
D’après mon expérience, trouver la bonne alternative peut vraiment faire la différence. Vous recherchez peut-être de meilleurs tarifs, des fonctionnalités spécifiques ou une intégration avancée avec vos systèmes existants.
J’ai testé et évalué de façon indépendante différentes solutions pour vous proposer les meilleures alternatives à Dynatrace. Je vais vous présenter mes principaux choix afin de vous aider à prendre une décision éclairée adaptée à votre activité. Explorons ensemble les solutions qui peuvent réellement profiter à votre équipe.
Qu’est-ce que Dynatrace ?
Dynatrace est une plateforme d’observabilité des données qui aide les entreprises à surveiller et optimiser les performances applicatives. Elle est généralement utilisée par des professionnels de l’IT, des développeurs et des responsables de l’expérience client qui souhaitent garantir le bon fonctionnement des opérations et une expérience utilisateur de qualité.
La supervision automatisée de l’infrastructure, les analyses pilotées par l’IA et des workflows d’observabilité sur toute la pile logicielle permettent à vos équipes d’identifier les problèmes, comprendre les métriques de performance et améliorer la gestion des ressources. Au final, Dynatrace fournit de précieux éclairages pour augmenter la disponibilité des systèmes.
Résumé des meilleures alternatives à Dynatrace
Ce tableau comparatif résume les détails tarifaires de mes principales alternatives à Dynatrace pour vous aider à choisir la solution la mieux adaptée à votre budget et aux besoins de votre entreprise.rn
| Tool | Best For | Trial Info | Price | ||
|---|---|---|---|---|---|
| 1 | Idéal pour une supervision complète de bout en bout | Essai gratuit + démo gratuite disponibles | Tarification sur demande | Website | |
| 2 | Idéal pour une sécurité et une observabilité unifiées | Essai gratuit de 14 jours + démo gratuite disponible | Tarification sur demande | Website | |
| 3 | Idéal pour la détection d'incidents basée sur l'IA | Démo gratuite disponible | À partir de $21.20/MVS/mois | Website | |
| 4 | Idéal pour une intégration à l'écosystème AWS | Plan gratuit disponible | Modèle à la consommation (pay-as-you-go) | Website | |
| 5 | Idéal pour l'intégration avec les services Azure | Essai gratuit de 30 jours + plan gratuit disponible | À partir de $0.05/GB ingéré | Website | |
| 6 | Idéal pour la supervision réseau tout-en-un | Essai gratuit de 30 jours disponible | À partir de $179/mois (facturé annuellement) | Website | |
| 7 | Idéal pour le suivi des erreurs en temps réel | Plan gratuit + démonstration gratuite disponible | À partir de 26 $/mois (facturé annuellement) | Website | |
| 8 | Idéal pour la surveillance informatique hybride | Offre gratuite + essai gratuit de 30 jours disponible | À partir de $225/mois (facturé annuellement) | Website | |
| 9 | Idéal pour l'observabilité cloud-native | Essai gratuit de 14 jours + plan gratuit disponible | À partir de $15/hôte/mois (facturé annuellement) | Website | |
| 10 | Idéal pour la surveillance des bases de données sans agent | Essai gratuit de 30 jours + démo gratuite + offre gratuite disponible | À partir de $199/an | Website |
Pourquoi faire confiance à nos avis logiciels
Nous testons et évaluons des logiciels depuis 2020. En tant que leaders CX nous-mêmes, nous savons qu’il est crucial et difficile de faire le bon choix dans la sélection d’outils. Nous réalisons des recherches approfondies pour aider notre audience à prendre de meilleures décisions d’achat logiciel. Nous avons testé plus de 2 000 solutions pour différents usages CX et rédigé plus de 1 000 analyses détaillées. Découvrez notre transparence & notre méthodologie d’évaluation logicielle.
-

SupportYourApp
Visit WebsiteThis is an aggregated rating for this tool including ratings from Crozdesk users and ratings from other sites.4.7 -
Tidio
Visit WebsiteThis is an aggregated rating for this tool including ratings from Crozdesk users and ratings from other sites.4.7 -
Freshdesk
Visit WebsiteThis is an aggregated rating for this tool including ratings from Crozdesk users and ratings from other sites.4.4


Avis détaillés sur les meilleures alternatives à Dynatrace
Vous trouverez ci-dessous mes résumés détaillés sur les meilleures alternatives à Dynatrace retenues dans ma sélection. Mes revues vous offrent un aperçu complet des fonctionnalités clés, avantages et inconvénients, intégrations possibles et cas d’usages idéaux pour chaque outil afin de vous aider à faire le meilleur choix.rn
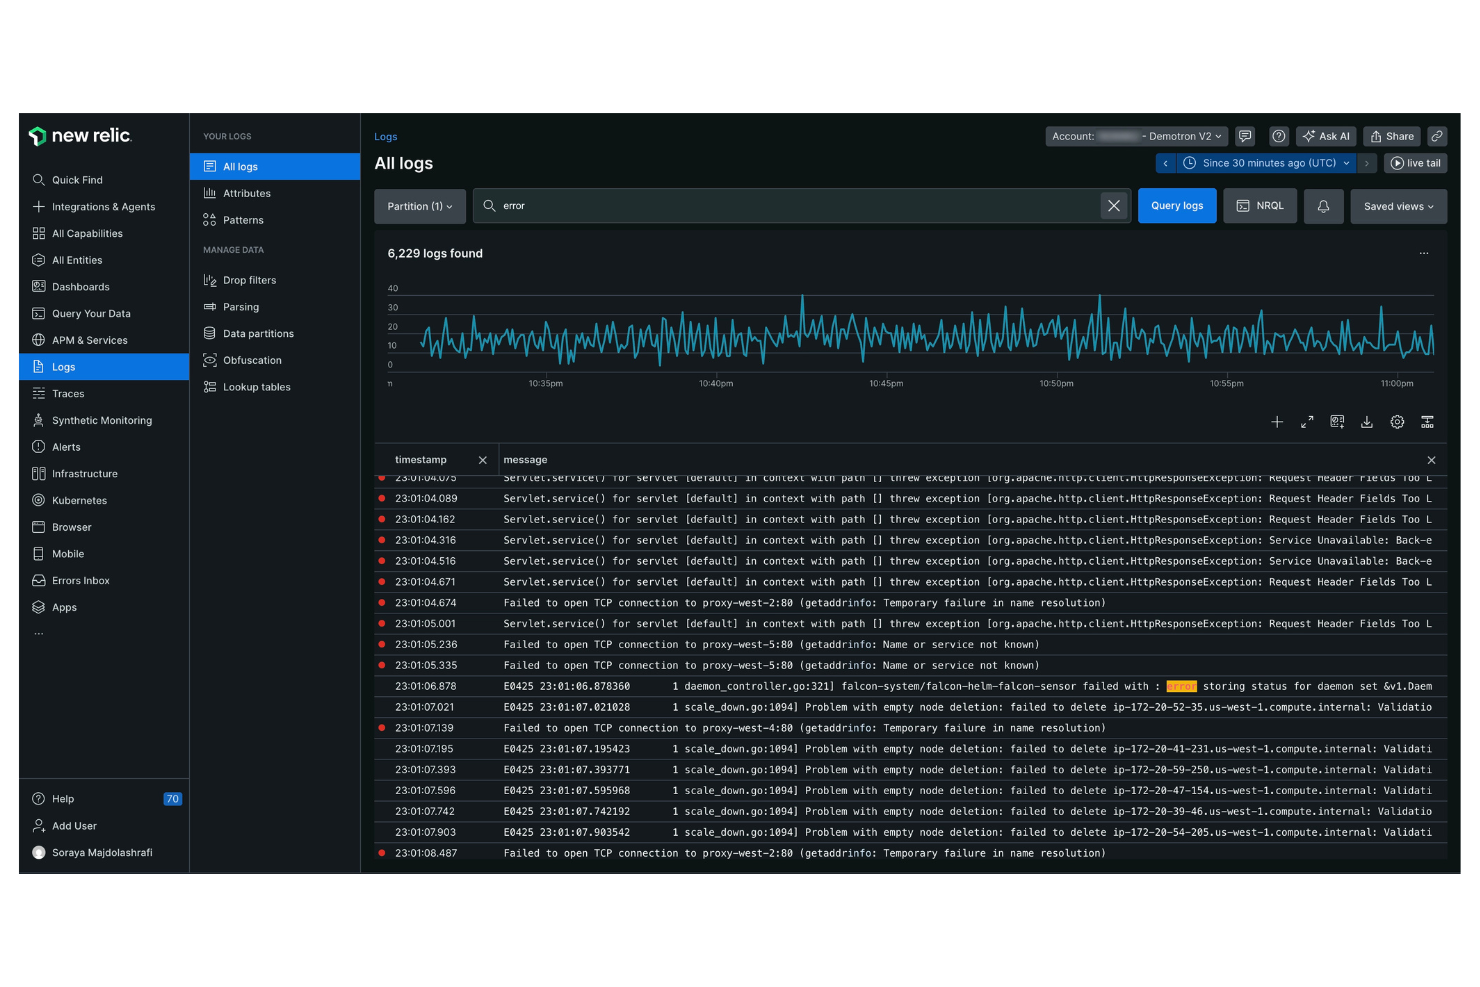
New Relic est une plateforme d'analytique logicielle et de surveillance des performances conçue pour les ingénieurs logiciels et les professionnels de l'informatique. Elle fournit des informations sur les performances des applications et la santé de l'infrastructure, vous aidant à optimiser vos opérations numériques.
Pourquoi c'est une bonne alternative à Dynatrace : New Relic propose une surveillance complète de bout en bout, offrant une visibilité sur l'ensemble de votre pile applicative. Les analyses en temps réel de la plateforme fournissent des informations exploitables, permettant à votre équipe de réagir rapidement aux problèmes. Les tableaux de bord personnalisés vous permettent de visualiser les données de manière à répondre à vos besoins spécifiques.
Fonctionnalités et intégrations à retenir :
Fonctionnalités comprenant l'analytique des erreurs, qui vous aide à identifier et résoudre les erreurs applicatives. Sa fonctionnalité de traçage distribué vous aide à suivre les requêtes à travers les services, pour garantir que vous puissiez identifier les goulots d'étranglement. La plateforme propose également une surveillance synthétique afin de simuler les interactions utilisateur et de tester les performances de l'application. Avec la gestion des journaux, vous pouvez collecter et analyser les données de logs pour des informations approfondies sur vos systèmes.
Intégrations notamment AWS, Microsoft Azure, Google Cloud Platform, Kubernetes, Docker, Slack, PagerDuty et plus encore.
Pros and Cons
Pros:
- Traçage distribué efficace
- Analyses en temps réel
- Tableaux de bord personnalisables
Cons:
- L'interface peut sembler encombrée et complexe
- Le tarif par utilisateur est élevé
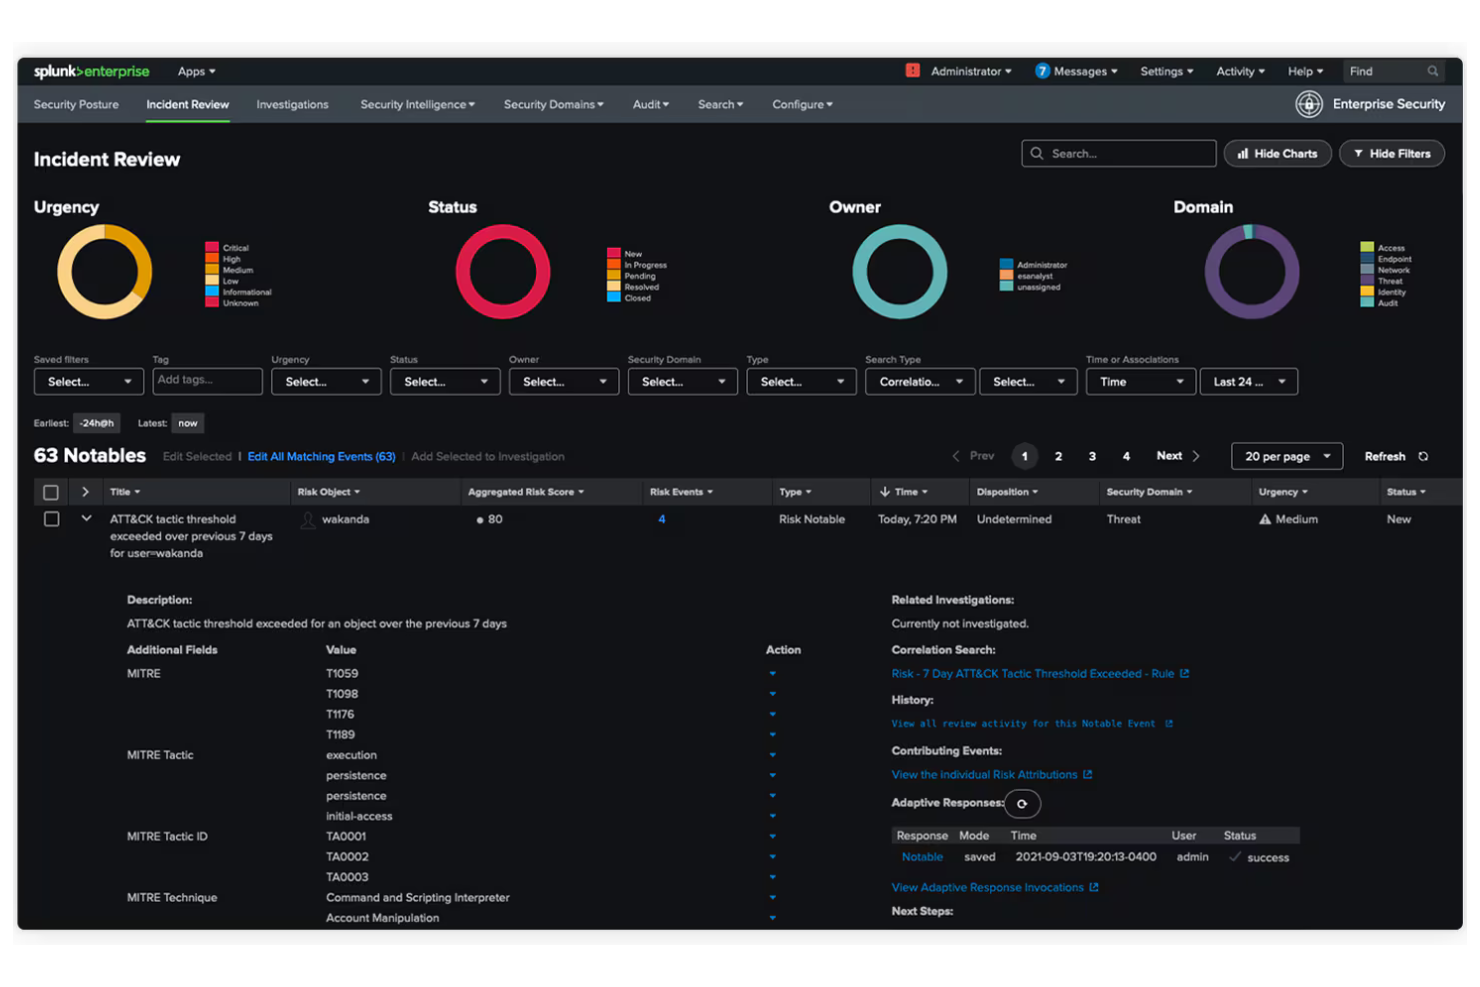
Splunk est une plateforme de données conçue pour les opérations informatiques, la sécurité des applications et l'analyse commerciale. Elle aide les organisations à transformer les données en informations exploitables, améliorant ainsi la prise de décision et l'efficacité opérationnelle.
Pourquoi c'est une bonne alternative à Dynatrace : Splunk propose une sécurité et une observabilité unifiées, offrant une vue complète de vos données à travers plusieurs environnements. Son traitement des données en temps réel permet à votre équipe d'identifier et de réagir rapidement aux problèmes. Les capacités d'apprentissage automatique de la plateforme fournissent des analyses prédictives, vous aidant à anticiper les éventuels soucis. Des tableaux de bord personnalisables vous permettent de visualiser les données dans un format adapté à vos besoins opérationnels.
Fonctionnalités clés et intégrations :
Fonctionnalités incluent la détection avancée des menaces pour vous aider à identifier les risques de sécurité en temps réel. La plateforme propose également la gestion des journaux pour collecter et analyser les données sur l’ensemble des microservices, ainsi que de puissants outils analytiques pour révéler des tendances et des schémas cachés.
Intégrations incluent AWS, Microsoft Azure, Google Cloud Platform, ServiceNow, Cisco, Palo Alto Networks, et plus encore.
Pros and Cons
Pros:
- Vue unifiée des données
- Traitement en temps réel
- Détection avancée des menaces
Cons:
- Configuration et mise en place complexes
- Forte exigence matérielle/de ressources
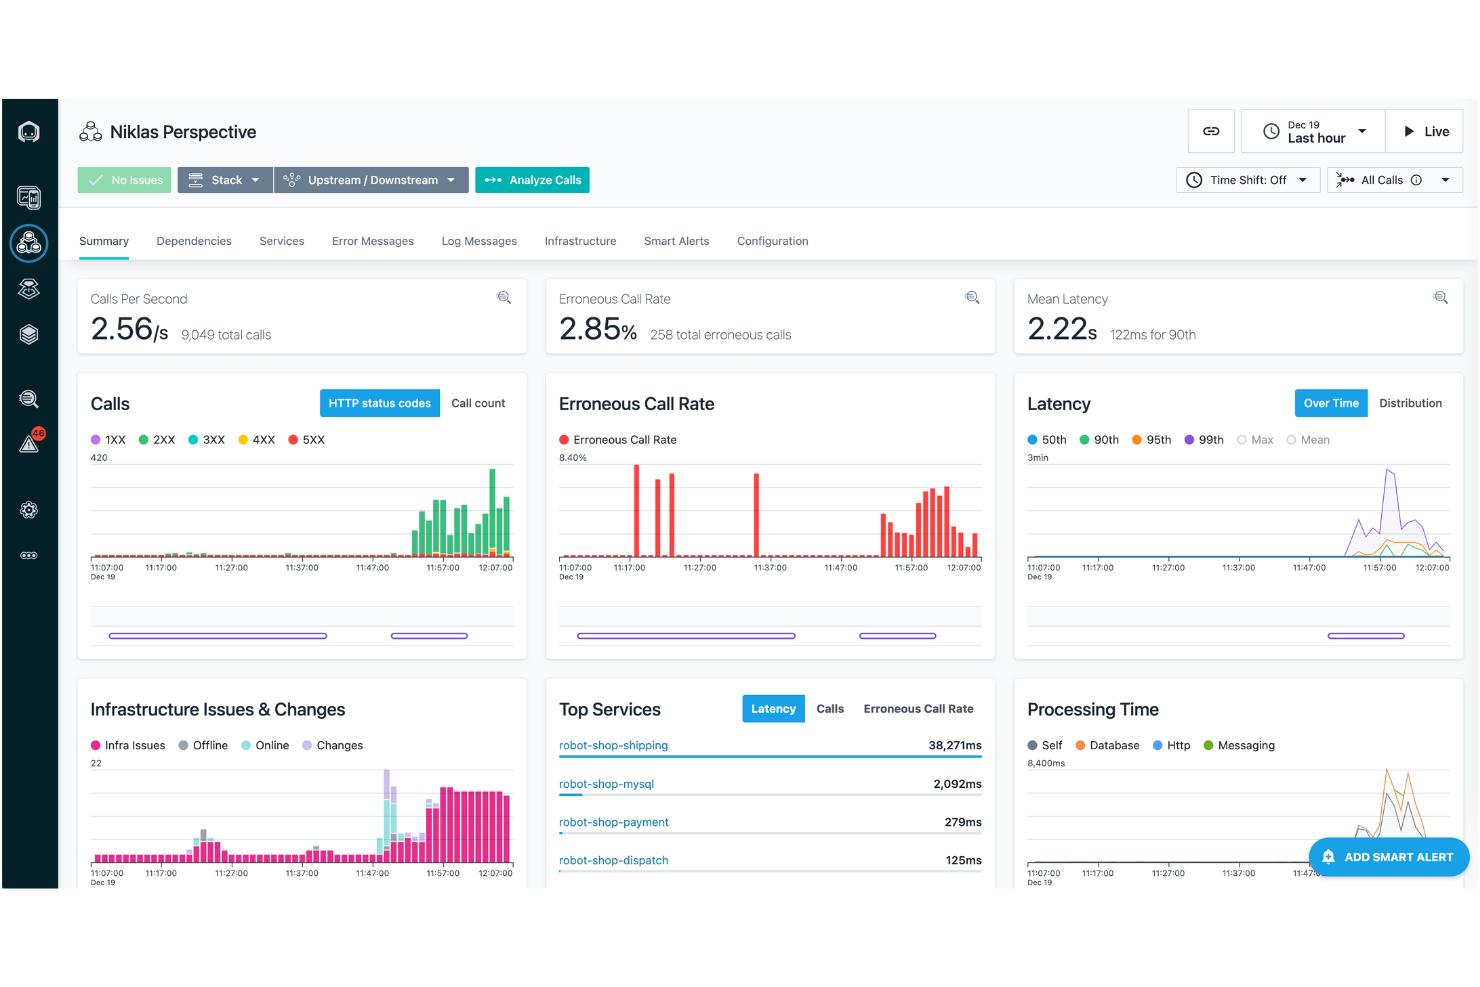
IBM Instana est une plateforme d'APM et d'observabilité destinée aux équipes DevOps et aux opérations informatiques. Elle permet de surveiller les applications et l'infrastructure, offrant des informations pour optimiser les performances et l'expérience utilisateur.
Pourquoi c'est une bonne alternative à Dynatrace : IBM Instana propose une détection d'incidents alimentée par l'IA, permettant à votre équipe d'identifier et de résoudre rapidement les problèmes. Sa découverte automatique et sa cartographie des applications garantissent une visibilité complète sur vos systèmes. La surveillance en temps réel fournit des informations immédiates sur les indicateurs de performance, vous aidant à maintenir un fonctionnement optimal. Grâce à son tableau de bord intuitif, vous pouvez naviguer et analyser facilement les données pertinentes.
Fonctionnalités remarquables et intégrations :
Fonctionnalités incluent l'analyse automatisée des causes profondes, ce qui permet d'identifier la source des problèmes. Le support de l'intégration continue de la plateforme autorise des mises à jour et des déploiements automatiques. Vous pouvez également profiter des alertes personnalisées, qui tiennent votre équipe informée des changements critiques.
Intégrations incluent Kubernetes, Docker, AWS, Microsoft Azure, Google Cloud Platform, VMware Tanzu, Red Hat OpenShift, et plus encore.
Pros and Cons
Pros:
- Détection d'incidents basée sur l'IA
- Surveillance en temps réel
- Analyse automatisée des causes profondes
Cons:
- Nécessite une expertise technique
- Peut être gourmand en ressources
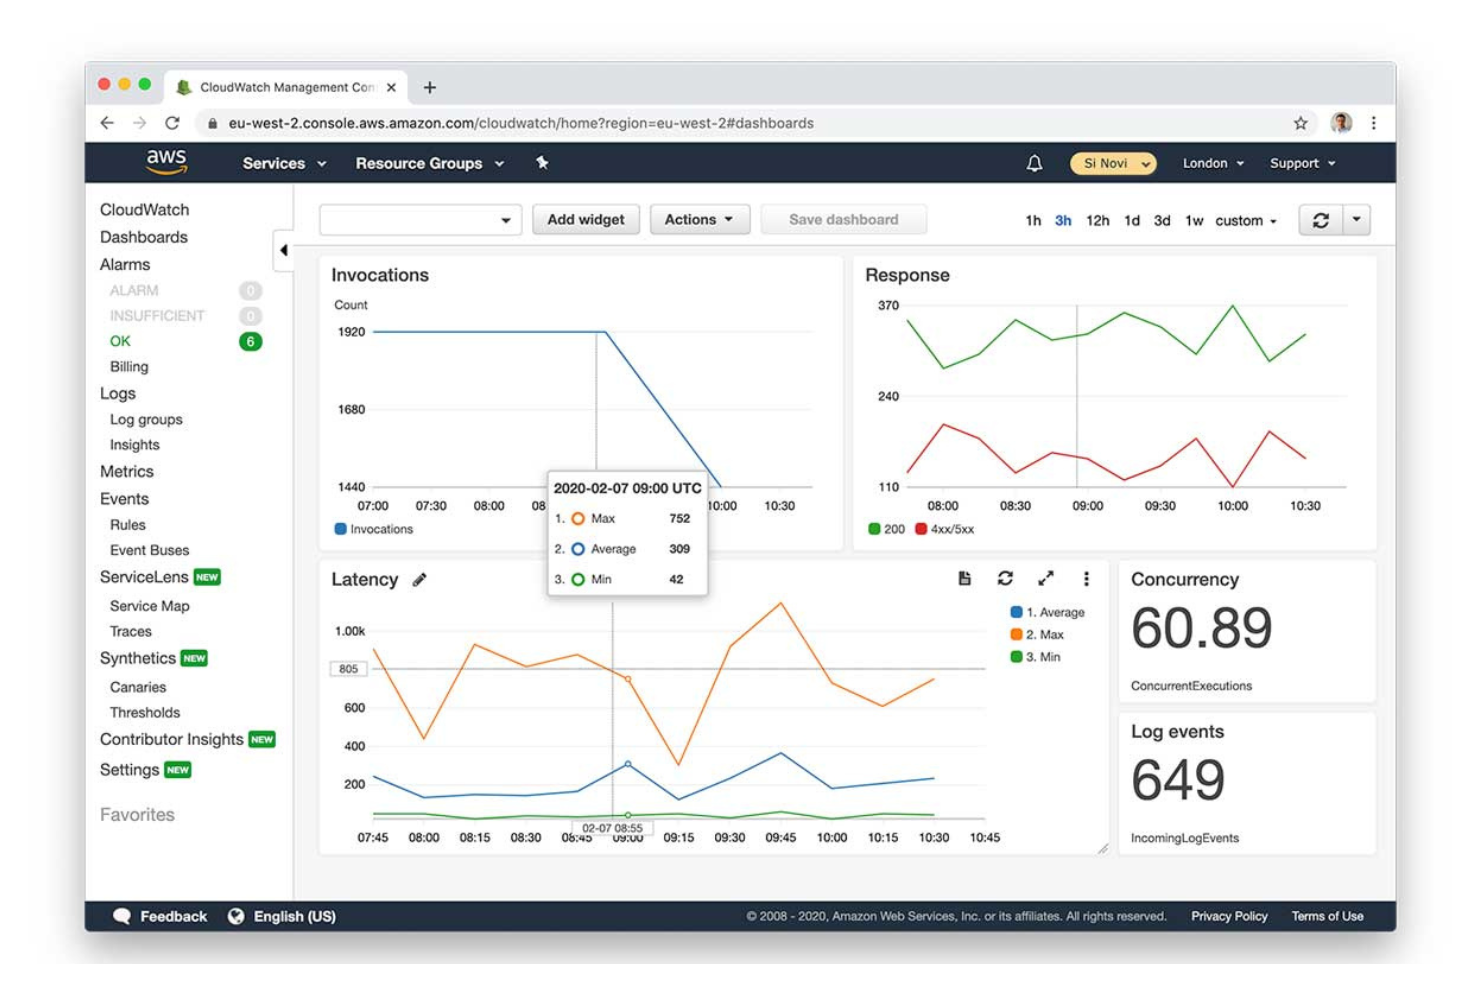
Amazon CloudWatch est un service de surveillance et de gestion conçu pour les développeurs et les équipes informatiques. Il permet de surveiller les ressources AWS et les applications, offrant des informations sur les performances du système et la santé opérationnelle.
Pourquoi c’est une bonne alternative à Dynatrace : Amazon CloudWatch propose une intégration native et poussée avec l’écosystème AWS, ce qui en fait un choix idéal pour les équipes utilisant les services AWS. Ses fonctionnalités de surveillance en temps réel permettent à votre équipe de suivre efficacement les métriques et les journaux. La possibilité de définir des alarmes basées sur des seuils garantit d’être alerté à temps afin de pouvoir agir. Sa fonction de centralisation des journaux consolide les données provenant de différentes sources, offrant une vue unifiée de votre environnement.
Fonctionnalités et intégrations phares :
Fonctionnalités : détection d’anomalies, idéale pour identifier des schémas inhabituels dans vos métriques. Le service propose des tableaux de bord personnalisés, pour visualiser les données selon les besoins de votre équipe. Grâce à son automatisation événementielle, vous pouvez automatiser les réponses à des conditions ou changements spécifiques dans votre environnement.
Intégrations : la majorité des services AWS, Dynatrace, xMatters, Slack, Microsoft Teams, SRE, et bien d’autres.
Pros and Cons
Pros:
- Intégration poussée avec AWS
- Surveillance en temps réel
- Détection des anomalies
Cons:
- Tarification très complexe et difficile à comprendre
- Les coûts augmentent vite avec un volume de journaux élevé
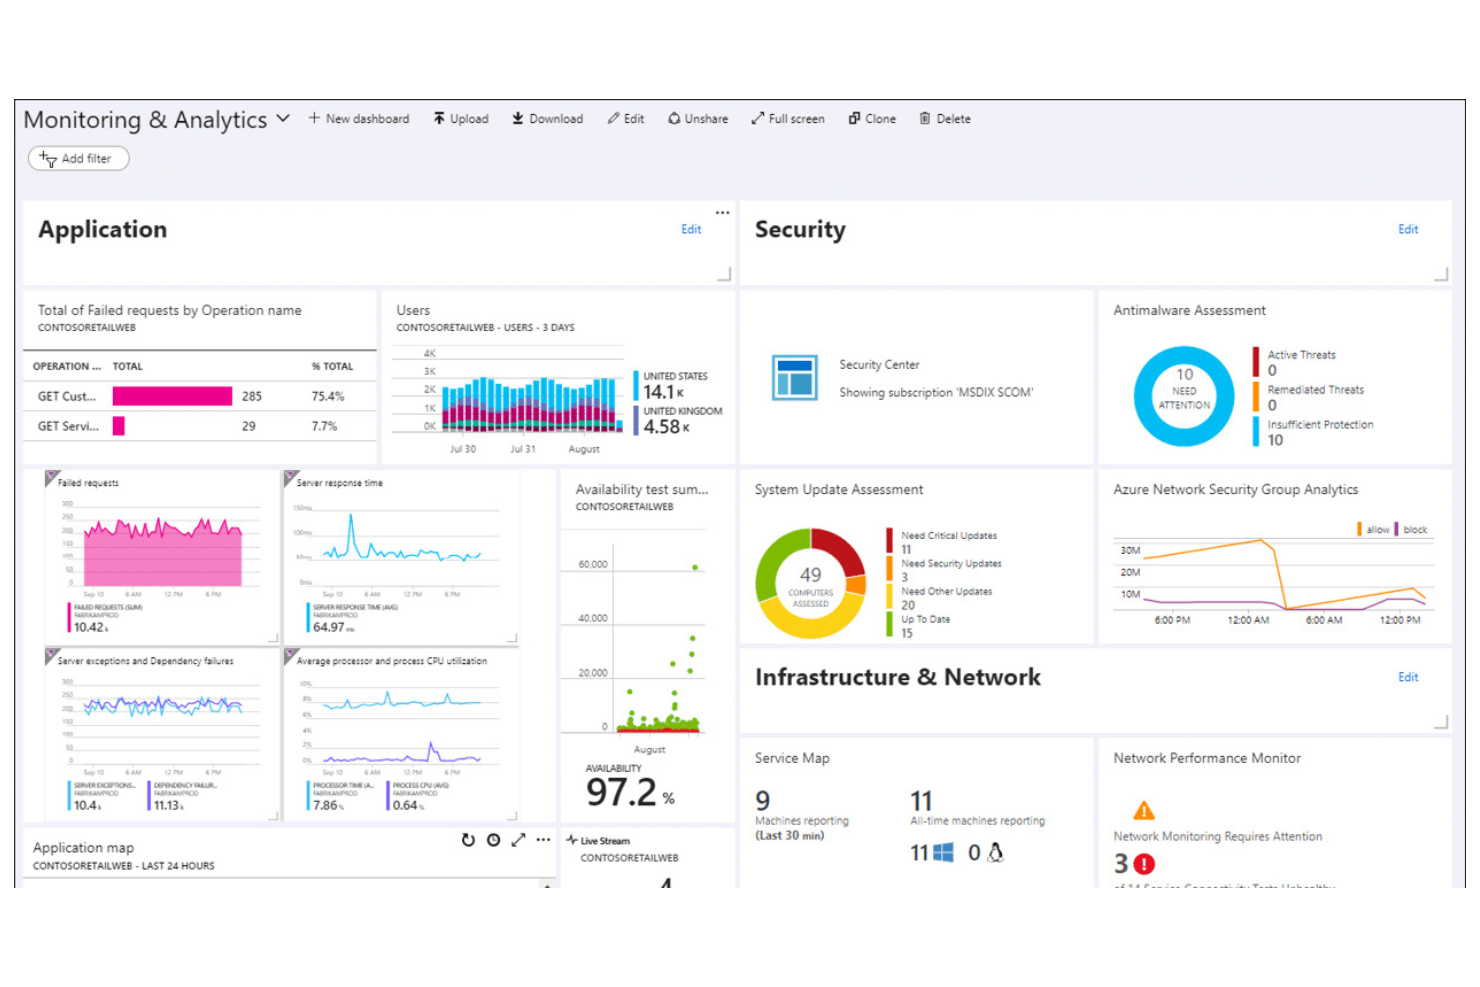
Microsoft Azure Monitor est une plateforme basée sur le cloud qui collecte, analyse et agit sur les données de télémétrie. Elle fournit des informations sur les performances et la santé des applications et des infrastructures dans l'environnement Azure.
Pourquoi c'est une bonne alternative à Dynatrace : Microsoft Azure Monitor offre une intégration étroite avec les services Azure, ce qui en fait un choix idéal pour les équipes fortement investies dans l'écosystème Azure. Sa fonctionnalité Application Insights fournit des analyses détaillées, vous aidant à comprendre le comportement des utilisateurs et les performances des applications. L'analyse des journaux vous permet d'interroger et d'évaluer les données provenant de diverses sources, améliorant ainsi votre capacité à résoudre les problèmes. Les alertes personnalisées aident votre équipe à rester informée des événements critiques dans votre environnement.
Fonctionnalités et intégrations remarquables :
Fonctionnalités : comprennent des capacités d'autoscaling, vous permettant d'ajuster automatiquement les ressources en fonction de la demande. Le suivi des dépendances vous aide à visualiser les relations entre les différents composants de votre application. Le service propose également la surveillance du réseau afin de garantir la performance et la disponibilité de votre réseau.
Intégrations : incluent Azure DevOps, Azure Security Center, Azure Automation, Azure Logic Apps, Azure Functions, Power BI, Microsoft Teams, et plus encore.
Pros and Cons
Pros:
- Informations détaillées sur les applications
- Intégration forte avec Azure
- Analyse de journaux efficace
Cons:
- Vue fragmentée à travers les clouds hybrides
- Support limité en dehors d'Azure
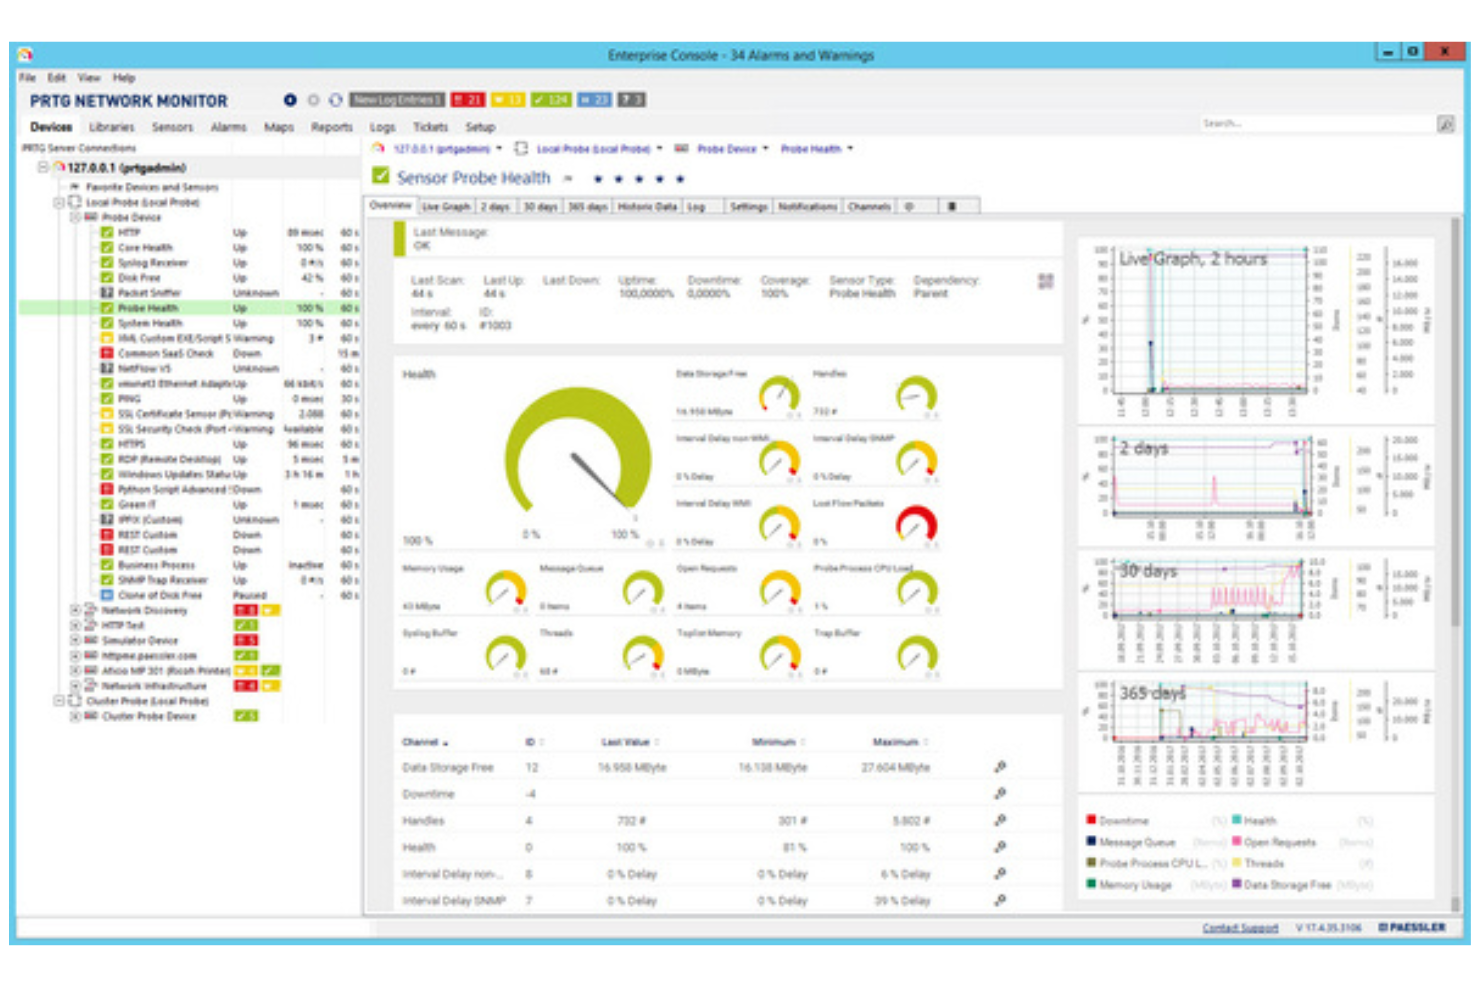
PRTG Network Monitor est un outil de surveillance utilisé par les administrateurs informatiques et les responsables réseau. Il aide à suivre les performances du réseau et à détecter les problèmes sur l'ensemble de votre infrastructure informatique.
Pourquoi c'est une bonne alternative à Dynatrace : PRTG Network Monitor propose une surveillance réseau tout-en-un, offrant une vue complète de l'ensemble de votre réseau. Sa surveillance basée sur des capteurs permet de suivre divers indicateurs, vous offrant une grande flexibilité sur ce que vous souhaitez surveiller. L'outil fournit des alertes en temps réel pour avertir immédiatement votre équipe en cas de problème. Les tableaux de bord personnalisables vous permettent de visualiser les données selon vos besoins spécifiques.
Fonctionnalités et intégrations marquantes :
Fonctionnalités incluent un concepteur de cartes qui vous permet de créer des cartes réseau personnalisées pour une meilleure visualisation. La fonction de génération de rapports produit des rapports détaillés sur les performances réseau, facilitant l'analyse. Vous pouvez également mettre en place une surveillance distribuée pour gérer plusieurs réseaux depuis une interface unique.
Intégrations comprennent Microsoft Azure, AWS, VMware, Cisco Meraki, NetApp, Dell EMC, HPE, Synology, et plus encore.
Pros and Cons
Pros:
- Solution de surveillance tout-en-un
- Système d'alerte en temps réel
- Vues de tableau de bord personnalisables
Cons:
- Installation du serveur principal uniquement sous Windows
- Les capteurs consomment rapidement les licences
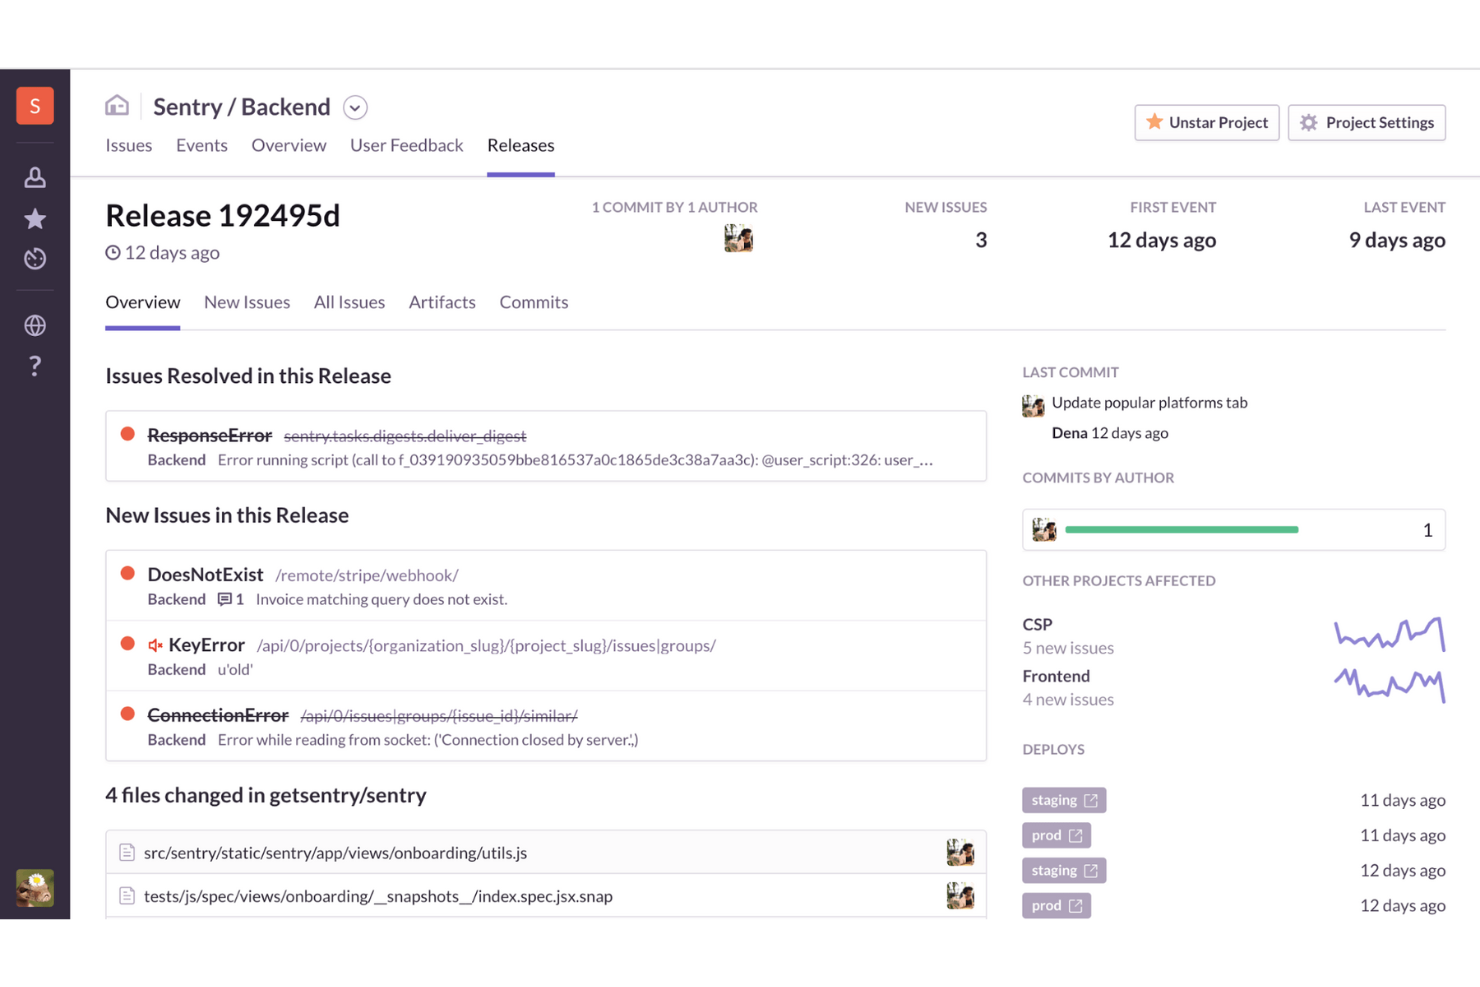
Sentry est un outil de surveillance des performances applicatives (APM) et de suivi des erreurs utilisé par les développeurs et les équipes informatiques. Il aide à identifier et à résoudre les problèmes d'application, garantissant des performances fluides et une expérience utilisateur de haute qualité.
Pourquoi c'est une bonne alternative à Dynatrace : Sentry se concentre sur le suivi des erreurs en temps réel, fournissant des notifications instantanées lorsque des problèmes surviennent. Le débogage assisté par l'IA offre des analyses sur les causes profondes des erreurs. Cela fait de Sentry l'outil idéal pour les équipes ayant besoin d'informations immédiates sur les erreurs et de résolutions rapides.
Fonctionnalités et intégrations remarquables :
Fonctionnalités comprend la relecture de session, qui vous permet de voir les interactions des utilisateurs précédant une erreur. Le traçage distribué vous aide à surveiller le parcours des requêtes dans votre système, en identifiant les problèmes. La relecture de code par IA propose des suggestions automatisées pour améliorer le code.
Intégrations comprennent GitHub, Slack, Jira, Bitbucket, GitLab, Trello, Asana, PagerDuty, Microsoft Teams, Linear, et plus encore.
Pros and Cons
Pros:
- Suivi des erreurs en temps réel
- Interface conviviale
- Débogage intuitif
Cons:
- Analyses avancées limitées
- Système d'alertes peu efficace
New Product Updates from Sentry

Sentry Adds Log Export in CSV and JSONL
Sentry now supports exporting up to 10,000 log lines from Explore → Logs in CSV or JSON Lines, with downloads available in-browser or as background downloads and email. For more information, visit Sentry's official site.
 .
.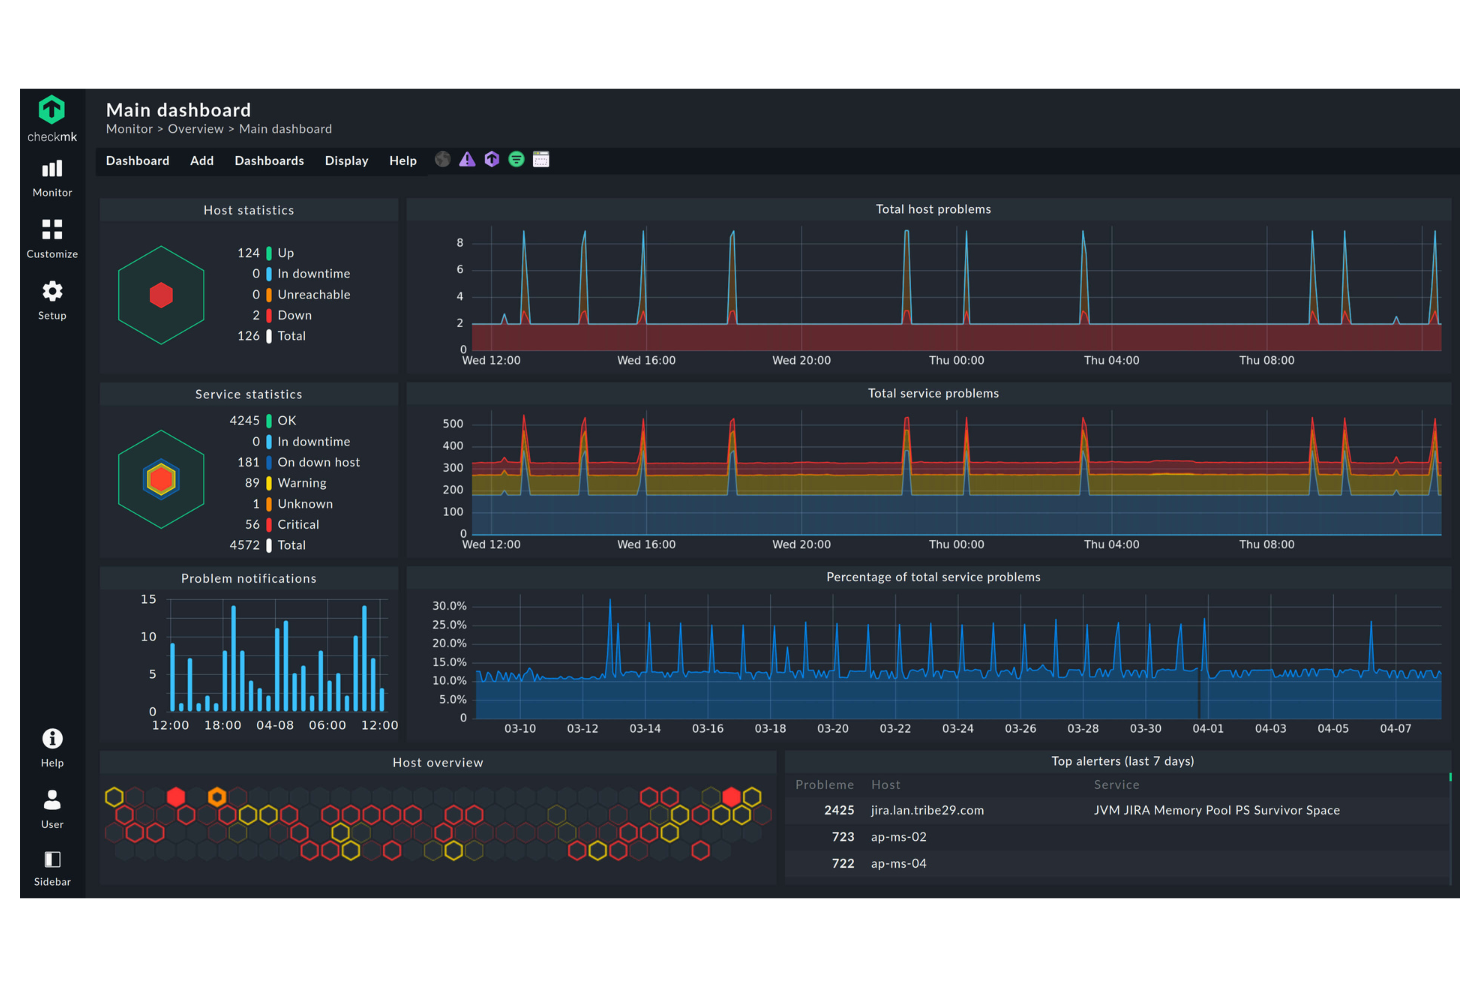
Checkmk est un outil de surveillance informatique conçu pour les administrateurs système et les équipes d'exploitation informatique. Il fournit des analyses approfondies de l'infrastructure informatique, vous aidant à gérer serveurs, réseaux et applications.
Pourquoi c'est une bonne alternative à Dynatrace : Checkmk excelle dans la surveillance hybride de l'informatique, vous permettant de surveiller à la fois les environnements sur site et cloud. Avec des tableaux de bord personnalisables, vous pouvez adapter les informations selon vos besoins spécifiques. L'outil propose également des rapports détaillés, vous aidant à suivre les métriques de performance et les tendances.
Fonctionnalités et intégrations remarquables :
Fonctionnalités incluant des seuils personnalisables permettant de définir des limites de performance spécifiques pour les alertes. L'outil propose un système de notifications flexible, garantissant que vous receviez des mises à jour sur les incidents les plus importants. Sa fonctionnalité d'auto-découverte facilite l'identification des appareils et services réseau, simplifiant la configuration pour votre équipe. Il prend aussi en charge la surveillance distribuée, vous permettant de gérer plusieurs sites à partir d'un emplacement centralisé.
Intégrations incluant Nagios, Prometheus, Grafana, InfluxDB, VMware, AWS, Microsoft Azure, Docker, et bien plus encore.
Pros and Cons
Pros:
- Capacités de surveillance hybride
- Auto-découverte des appareils
- Tableaux de bord personnalisables
Cons:
- L'application mobile nécessite une amélioration significative
- Complexité dans la configuration basée sur les règles
Datadog est une plateforme leader de l'observabilité et de la sécurité basée sur le SaaS pour les applications cloud-native, principalement utilisée par les équipes DevOps et les professionnels de l'informatique. Elle offre une visibilité sur les performances des applications, l'état de l'infrastructure et l'expérience utilisateur, y compris la surveillance des systèmes distribués et des performances des API.
Pourquoi c'est une bonne alternative à Dynatrace : Datadog excelle dans l'observabilité cloud-native, proposant des outils spécialement conçus pour surveiller les environnements cloud. Ses tableaux de bord en temps réel offrent des informations sur les métriques de l'infrastructure, vous aidant à suivre vos systèmes. La fonctionnalité de détection d'anomalies de la plateforme avertit votre équipe en cas de comportements inhabituels, garantissant une résolution proactive des problèmes. Avec ses alertes personnalisables, vous pouvez adapter les notifications en fonction des besoins de votre équipe.
Fonctionnalités et intégrations remarquables :
Fonctionnalités incluant la gestion des logs, qui permet de collecter et d'analyser des logs provenant de diverses sources pour des analyses approfondies. La plateforme propose des outils APM pour suivre les indicateurs clés et améliorer la santé des applications. Vous pouvez également utiliser la surveillance des performances réseau pour garantir la fiabilité et les performances de votre réseau.
Intégrations incluent AWS, Microsoft Azure, Google Cloud Platform, Kubernetes, Docker, Slack, GitHub, et bien d'autres.
Pros and Cons
Pros:
- Forte orientation cloud-native
- Tableaux de bord en temps réel
- Détection d'anomalies efficace
Cons:
- Peut être difficile à prendre en main pour les débutants
- Un volume de données élevé peut augmenter les coûts
Idéal pour la surveillance des bases de données sans agent

ManageEngine Applications Manager est un outil conçu pour les équipes IT et DevOps afin de surveiller les performances des applications, suivre l'utilisation des ressources, et garantir le bon fonctionnement des environnements informatiques.
Pourquoi c'est une bonne alternative à Dynatrace : ManageEngine Applications Manager propose une surveillance des bases de données sans agent, ce qui en fait un choix plus pratique et rentable que Dynatrace. Cette fonctionnalité vous permet de surveiller les bases de données sans installer d’agents, réduisant ainsi la charge et simplifiant la configuration. L’outil fournit des analyses en temps réel sur les performances applicatives pour vous aider à identifier rapidement les problèmes. Il prend également en charge un large éventail d’applications et de composants d’infrastructure, ce qui le rend polyvalent pour divers besoins informatiques.
Fonctionnalités remarquables et intégrations :
Fonctionnalités incluent des tableaux de bord personnalisables permettant de visualiser les données de performance selon les besoins de votre équipe. Les alertes automatisées garantissent que vous êtes averti dès qu’un problème survient. L’analyse des données historiques vous aide à comprendre les tendances et à planifier l’allocation des ressources.
Intégrations comprennent Microsoft Azure, AWS, VMware, Oracle, Microsoft SQL, PostgreSQL, et d’autres.
Pros and Cons
Pros:
- Solution de surveillance sans agent
- Facilité d'utilisation
- Tableaux de bord personnalisables
Cons:
- Utilisation intensive des ressources sur les serveurs hébergés
- Interface utilisateur dépassée et surchargée
New Product Updates from ManageEngine Applications Manager
Oracle Cloud Application Monitoring Now Available in ManageEngine Applications Manager
ManageEngine Applications Manager introduces Oracle Cloud Application Monitoring, Oracle Cloud Function Monitoring, and Oracle Cloud NAT Gateway Monitoring. These new capabilities help teams monitor Oracle Cloud applications, serverless workloads, and network resources from a single platform. For more information, visit ManageEngine Applications Manager's official site.
 .
.Autres alternatives à Dynatrace
Voici quelques autres alternatives à Dynatrace qui n’ont pas été retenues dans cette sélection, mais qui méritent tout de même d’être regardées de plus près :rn


Critères de sélection des alternatives à Dynatrace
Pour sélectionner les meilleures alternatives à Dynatrace de cette liste, j’ai pris en compte les besoins récurrents des acheteurs et les principaux points de douleur relatifs aux plateformes d’observabilité des données, tels que la capacité de montée en charge et les possibilités d’intégration. J’ai également utilisé le cadre suivant pour garantir une évaluation structurée et impartiale :
Fonctionnalités essentielles (25 % de la note totale)
Pour figurer dans cette liste, chaque solution devait répondre à ces cas d’usage courants :
- Surveillance des performances applicatives
- Suivi de la santé de l’infrastructure
- Alertes en temps réel
- Gestion des journaux
- Support du traçage distribué
Fonctionnalités différenciantes (25 % de la note totale)
Pour affiner davantage la sélection, j’ai aussi cherché des options avec des fonctionnalités uniques telles que :
- Analyses pilotées par l’IA
- Tableaux de bord personnalisables
- Détection des anomalies
- Analyses avancées
- Analyse automatique des causes profondes
Utilisabilité (10 % du score total)
Pour avoir une idée de l’utilisabilité de chaque système, j’ai pris en compte les éléments suivants :
- Facilité de navigation
- Interface utilisateur intuitive
- Courbe d’apprentissage
- Options de personnalisation
- Accessibilité sur tous les appareils
Intégration des nouveaux utilisateurs (10 % du score total)
Pour évaluer l’expérience d’intégration à chaque plateforme, j’ai pris en compte les éléments suivants :
- Disponibilité de vidéos de formation
- Tours produits interactifs
- Accès à des modèles
- Webinaires et sessions en direct
- Chatbots d’accompagnement
Service client (10 % du score total)
Pour évaluer les services d’assistance client de chaque éditeur logiciel, j’ai pris en compte les éléments suivants :
- Disponibilité du chat en direct
- Délai de réponse aux demandes
- Accès à une base de connaissances
- Qualité de la documentation d’assistance
- Assistance disponible 24h/24 et 7j/7
Rapport qualité/prix (10 % du score total)
Pour juger le rapport qualité/prix de chaque plateforme, j’ai pris en compte les éléments suivants :
- Transparence des tarifs
- Rapport fonctionnalités/prix
- Disponibilité de périodes d’essai gratuites
- Plans tarifaires flexibles
- Évolutivité des tarifs
Avis clients (10 % du score total)
Pour avoir une idée de la satisfaction générale des clients, j’ai pris en compte les éléments suivants à la lecture de leurs avis :
- Retours sur la fiabilité
- Commentaires sur le service client
- Notes de satisfaction utilisateur
- Problèmes fréquemment remontés
- Recommandations générales des utilisateurs
Pourquoi chercher une alternative à Dynatrace ?
Si Dynatrace est un bon choix parmi les plateformes d’observabilité des données, plusieurs raisons poussent certains utilisateurs à rechercher des solutions alternatives. Vous pourriez être à la recherche d’une alternative à Dynatrace parce que…
- Vous êtes préoccupé par des coûts élevés
- Votre équipe a besoin d’une intégration plus simple
- Vous souhaitez de meilleures options d’intégration
- Vous recherchez un modèle tarifaire plus flexible
- Vous avez besoin d’un support pour les environnements hors cloud
- Vous rencontrez des problèmes de disponibilité géographique
Si l’une de ces raisons vous concerne, vous êtes au bon endroit. Ma liste rassemble plusieurs plateformes d’observabilité des données mieux adaptées pour les équipes confrontées à ces défis avec Dynatrace et à la recherche de solutions alternatives.
Fonctionnalités
Voici quelques-unes des principales fonctionnalités de Dynatrace, afin de vous aider à comparer ce que proposent les solutions alternatives :
- OneAgent : Se déploie une seule fois pour collecter des métriques sur l'ensemble de la chaîne de livraison applicative, simplifiant la collecte des données.
- PurePath : Offre une analyse détaillée des temps d’exécution et du contexte au niveau du code pour les traces distribuées, ce qui vous aide à capturer les données de performance, du clic de l’utilisateur jusqu’aux services back-end.
- Collecte de données évolutive : Prend en charge différents types de données – traces, métriques, journaux, vulnérabilités – pour garantir une couverture étendue.
- Analyses basées sur l’IA : Utilise l’intelligence artificielle pour prédire, prévenir et assister dans l’identification des problèmes, ce qui améliore l’efficacité de votre équipe.
- Processus automatisés : Simplifie la découverte, l’analyse et les opérations quotidiennes de l’entreprise, réduisant la charge de travail manuelle.
- Analyse contextuelle : Permet à votre équipe de comprendre les liens entre les données, facilitant ainsi une meilleure prise de décision.
- Outils de collaboration : Favorise le travail d’équipe grâce à l’intégration avec divers outils et sources de données.
- Fonctionnalités de sécurité : Garantie la confidentialité des données et la conformité de niveau entreprise, protégeant les informations de votre organisation.
- Tableaux de bord personnalisables : Permet de visualiser les données sous une forme adaptée aux besoins de votre équipe.
- Évolutivité : Gère de grandes quantités de données provenant de diverses sources, et répond aux exigences croissantes de votre entreprise.
Et maintenant :
Si vous êtes en train de rechercher des plateformes d'observabilité des données, contactez gratuitement un conseiller SoftwareSelect pour obtenir des recommandations personnalisées.
Vous remplissez un formulaire et avez une brève conversation pour préciser vos besoins. Ensuite, vous recevrez une liste restreinte de logiciels à étudier. Ils vous accompagneront même tout au long du processus d’achat, y compris lors des négociations tarifaires.