13 Best New Relic Alternatives in 2026

New Relic Alternatives Shortlist
Here's my pick of the 10 best software from the 13 tools reviewed.


The strongest all-in-one New Relic alternatives combine deep application performance monitoring, flexible observability, and integrations that fit your team’s workflows. If you’re searching for New Relic alternatives, you likely need reliable tools for tracking application health, diagnosing issues, and supporting complex environments without gaps in visibility or vendor lock-in.
This list will help you compare leading monitoring tools, understand their unique strengths, and choose a platform that matches your technical requirements and business goals.
What Is New Relic?
New Relic is an application performance monitoring and observability platform used to track, analyze, and optimize software performance across cloud and on-premises environments. It provides real-time insights into application health, infrastructure, and user experience. Teams use New Relic to detect issues, monitor distributed systems, and improve reliability by collecting and visualizing metrics, traces, and logs from their technology stack.
Best New Relic Alternatives Summary
This comparison chart summarizes pricing details for my top New Relic alternative selections to help you find the best one for your budget and business needs.
| Tool | Best For | Trial Info | Price | ||
|---|---|---|---|---|---|
| 1 | Best with AI-powered root cause analysis | 15-day free trial | From $7/month | Website | |
| 2 | Best for cloud-native infrastructure visibility | 14-day free trial + free plan available | From $15/host/month (billed annually) | Website | |
| 3 | Best for high-cardinality event debugging | Free plan available | From $130/month | Website | |
| 4 | Best for unified log and metric analysis | 7-day free trial + free plan available | From $99/month | Website | |
| 5 | Best with AWS ecosystem integration | Free plan available | Pay-as-you-go model | Website | |
| 6 | Best for automated application discovery | Free demo available | From $21.20/MVS/month | Website | |
| 7 | Best for Microsoft Azure workloads | Free demo available | Pricing upon request | Website | |
| 8 | Best for business transaction monitoring | 15-day free trial available | From $6/CPU core/month (billed annually) | Website | |
| 9 | Best for real-time error tracking | Free plan + free demo available | From $26/month (billed annually) | Website | |
| 10 | Best for monitoring hybrid IT environments | 30-day free trial + free demo + free plan availabl | From $199/year | Website |
Why Trust Our Software Reviews
We’ve been testing and reviewing software since 2020. As CX leaders ourselves, we know how critical and difficult it is to make the right decision when selecting software.
We invest in deep research to help our audience make better software purchasing decisions. We’ve tested more than 2,000 tools for different CX use cases and written over 1,000 comprehensive software reviews. Learn how we stay transparent & our software review methodology.
-

SupportYourApp
Visit WebsiteThis is an aggregated rating for this tool including ratings from Crozdesk users and ratings from other sites.4.7 -
Hiver
Visit WebsiteThis is an aggregated rating for this tool including ratings from Crozdesk users and ratings from other sites.4.7 -
Freshdesk
Visit WebsiteThis is an aggregated rating for this tool including ratings from Crozdesk users and ratings from other sites.4.4


New Relic Alternatives Reviews
Below are my detailed summaries of the best New Relic alternatives that made it onto my shortlist. My reviews offer a detailed look at the features, integrations, and best use cases of each platform to help you find the best one for you.
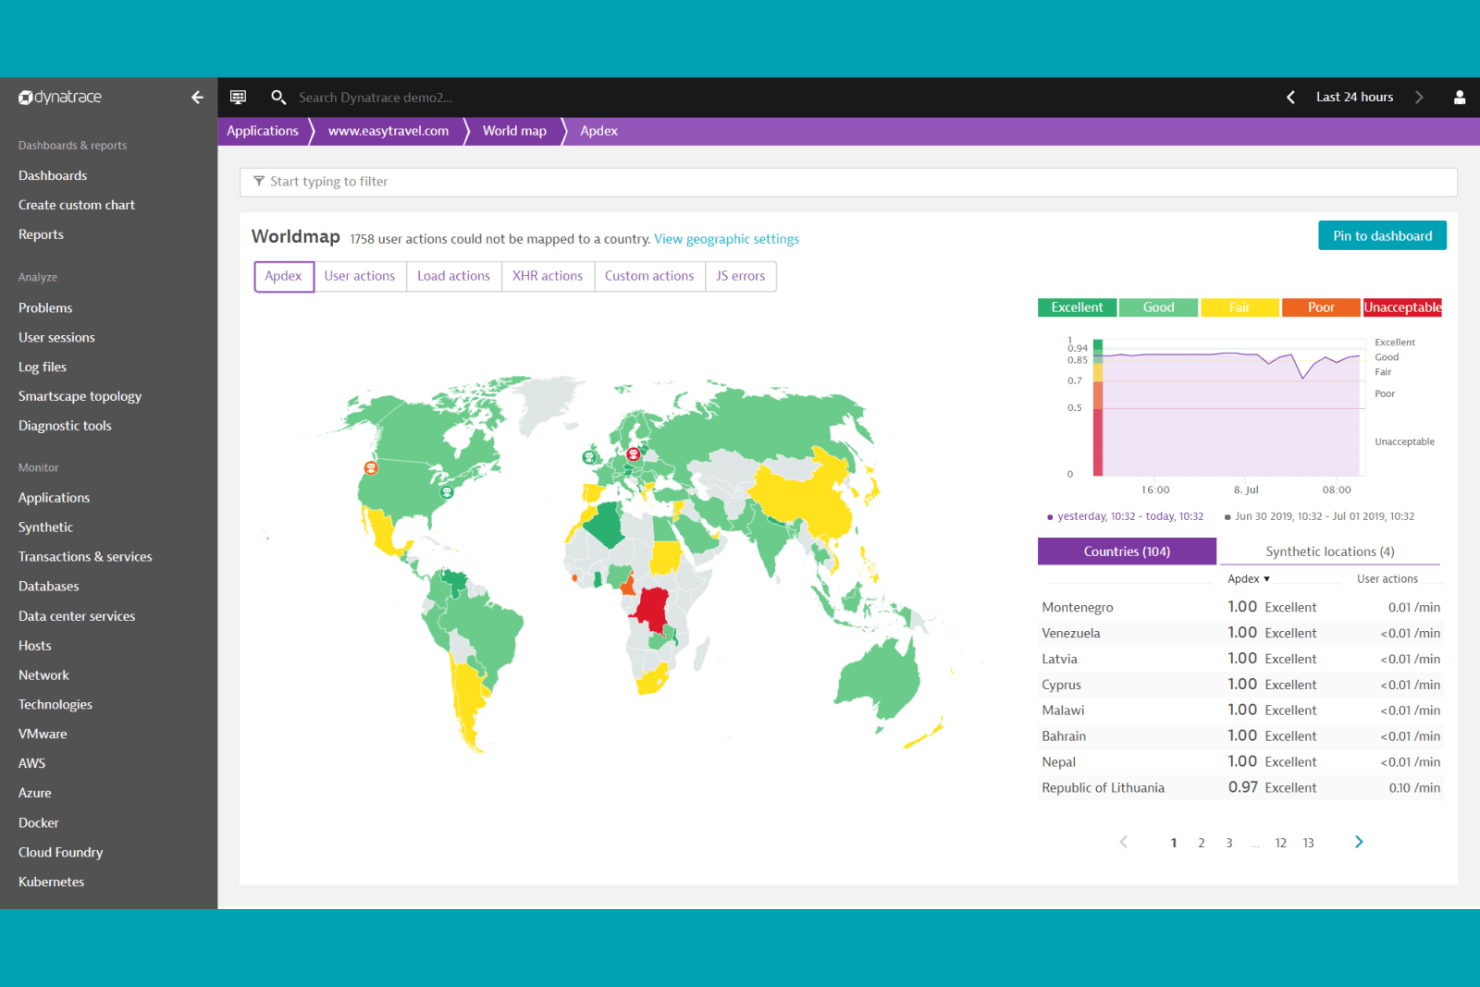
Dynatrace offers an observability solution with AI-powered root cause analysis for teams in complex environments. It’s a strong fit for enterprises and IT operations teams managing large-scale cloud-native or hybrid infrastructures. If you want to reduce manual troubleshooting and get actionable insights from observability data, Dynatrace offers a distinct approach compared to other New Relic alternatives.
Why Dynatrace Is a Good New Relic Alternative
What sets Dynatrace apart is its AI-powered root cause analysis, which helps teams quickly pinpoint and resolve issues in complex environments. I appreciate how Davis AI engine automatically analyzes dependencies and anomalies across applications, infrastructure, and user experience data. Dynatrace also provides automated problem detection and prioritization, reducing the need for manual investigation. For organizations seeking to minimize downtime and accelerate troubleshooting, these features make Dynatrace a compelling alternative to New Relic.
Dynatrace Key Features
Some other features worth highlighting include:
- Full-stack observability: Monitor applications, infrastructure, and user experience data from a single platform.
- Automatic dependency mapping: Visualize relationships between services, processes, and hosts without manual configuration.
- Real user monitoring (RUM): Track actual user interactions and performance across web and mobile applications.
- Custom metric ingestion: Bring in external metrics for unified analysis alongside native monitoring data.
Dynatrace Integrations
Integrations include AWS, Microsoft Azure, Google Cloud APIs, Alibaba Cloud, Kubernetes, Docker, Red Hat Enterprise Linux, Oracle HTTP Server, Prometheus, and more.
Pros and Cons
Pros:
- Supports multi-cloud and hybrid environments
- Real user monitoring covers web and mobile
- AI engine automates root cause analysis
Cons:
- Alert noise can require manual tuning
- Limited custom dashboarding options
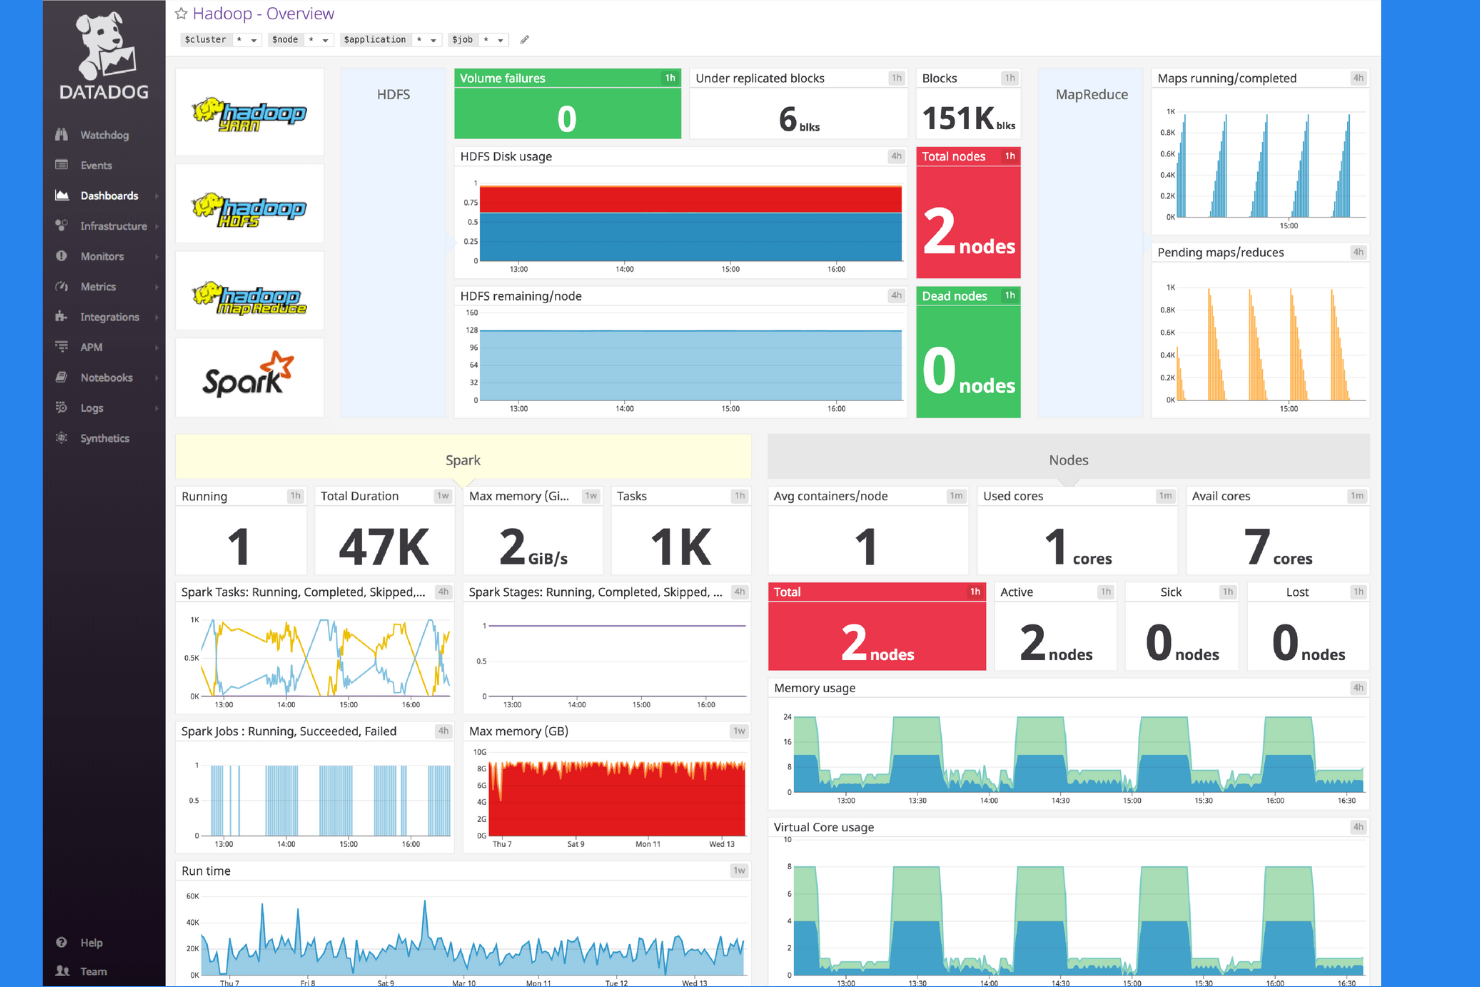
Datadog is built for teams managing dynamic, cloud-native environments that need unified visibility across infrastructure, applications, and logs. It’s especially relevant for DevOps, SRE, and platform teams who want to correlate metrics, traces, and events in real time. If you’re seeking a New Relic alternative with deep integrations for cloud platforms and containerized workloads, Datadog offers a monitoring approach tailored to modern architectures.
Why Datadog Is a Good New Relic Alternative
For teams focused on cloud-native infrastructure visibility, Datadog offers a monitoring experience that’s purpose-built for modern, distributed systems. I appreciate how Datadog provides unified dashboards that correlate time-series infrastructure metrics and application traces. Its auto-discovery of cloud resources and support for container orchestration platforms like Kubernetes make it especially useful for organizations running microservices at scale. If you need granular, real-time insights into cloud workloads, Datadog is a strong alternative to New Relic.
Datadog Key Features
Some other features that stood out to me include:
- Synthetic monitoring: Simulates user interactions to test application and API performance from multiple locations.
- Network performance monitoring: Tracks network traffic, latency, and dependencies across cloud and on-premises environments.
- Security monitoring: Detects threats and suspicious activity by analyzing logs and infrastructure events.
- Custom alerting: Lets you set up tailored alerts based on thresholds, anomalies, or composite conditions.
Datadog Integrations
Integrations include AWS, Microsoft Azure, Google Cloud Platform, Kubernetes, Docker, Slack, PagerDuty, GitHub, Jira, and more.
Pros and Cons
Pros:
- Security monitoring integrated with observability data
- Real-time log analytics with custom dashboards
- Native support for Kubernetes and containers
Cons:
- Limited retention periods for logs
- High data ingestion costs for large environments
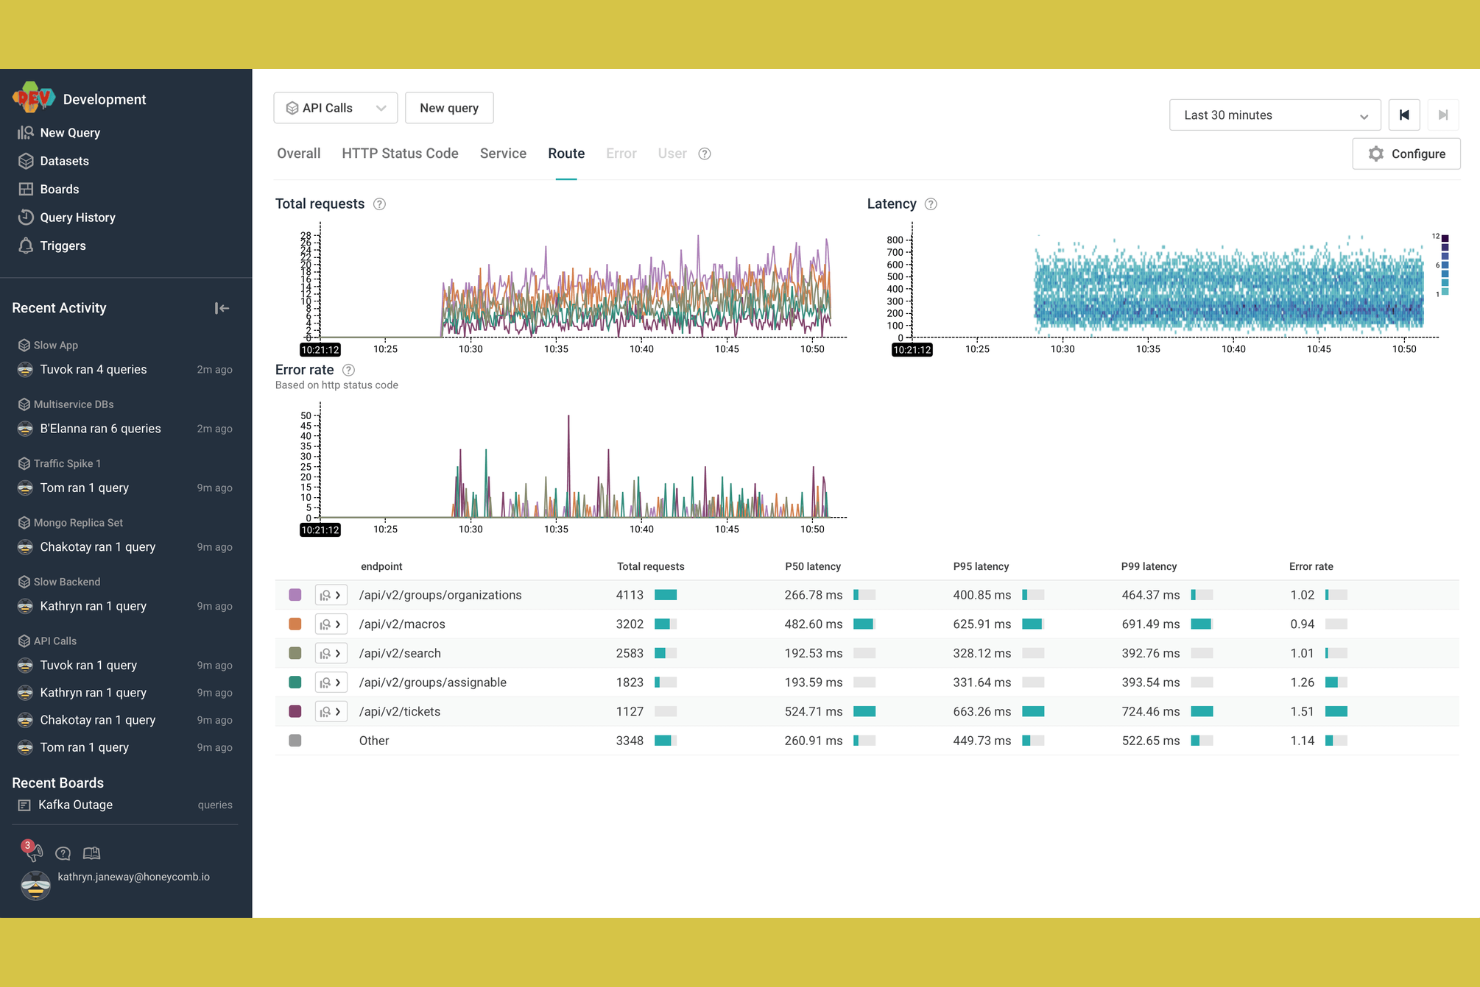
For teams that need to debug complex, high-cardinality events, Honeycomb offers a unique approach to observability. This platform is especially useful for engineers and SREs working in distributed systems where pinpointing outliers and hidden patterns is critical. Unlike many New Relic alternatives, Honeycomb excels at interactive querying and visual exploration of event data at scale.
Why Honeycomb Is a Good New Relic Alternative
Honeycomb stands out for its ability to handle high-cardinality event debugging, which is essential for teams managing complex, distributed systems. I like that you can run interactive queries on billions of events and instantly visualize patterns that would be hard to spot with traditional APM tools. Its BubbleUp feature lets you isolate outliers and anomalies within massive datasets in seconds. For organizations that need to investigate granular event data and uncover hidden issues, Honeycomb offers a level of observability that many New Relic alternatives can’t match.
Honeycomb Key Features
In addition to its event debugging strengths, Honeycomb offers several other features worth noting:
- Service Map: Visualizes relationships and dependencies between services in your environment.
- SLO tracking: Monitors and manages service level objectives directly within the platform.
- Distributed tracing: Captures and displays traces across microservices for end-to-end visibility.
- Team collaboration tools: Enables shared queries, boards, and comments for collaborative troubleshooting.
Honeycomb Integrations
Integrations include AWS Lambda, Slack, Terraform, MySQL, Prometheus, ServiceNow, AWS CloudWatch, and more.
Pros and Cons
Pros:
- Real-time querying on large event datasets
- BubbleUp feature pinpoints anomalies visually
- Handles high-cardinality data without performance loss
Cons:
- Requires instrumentation for full observability
- Limited support for legacy application environments
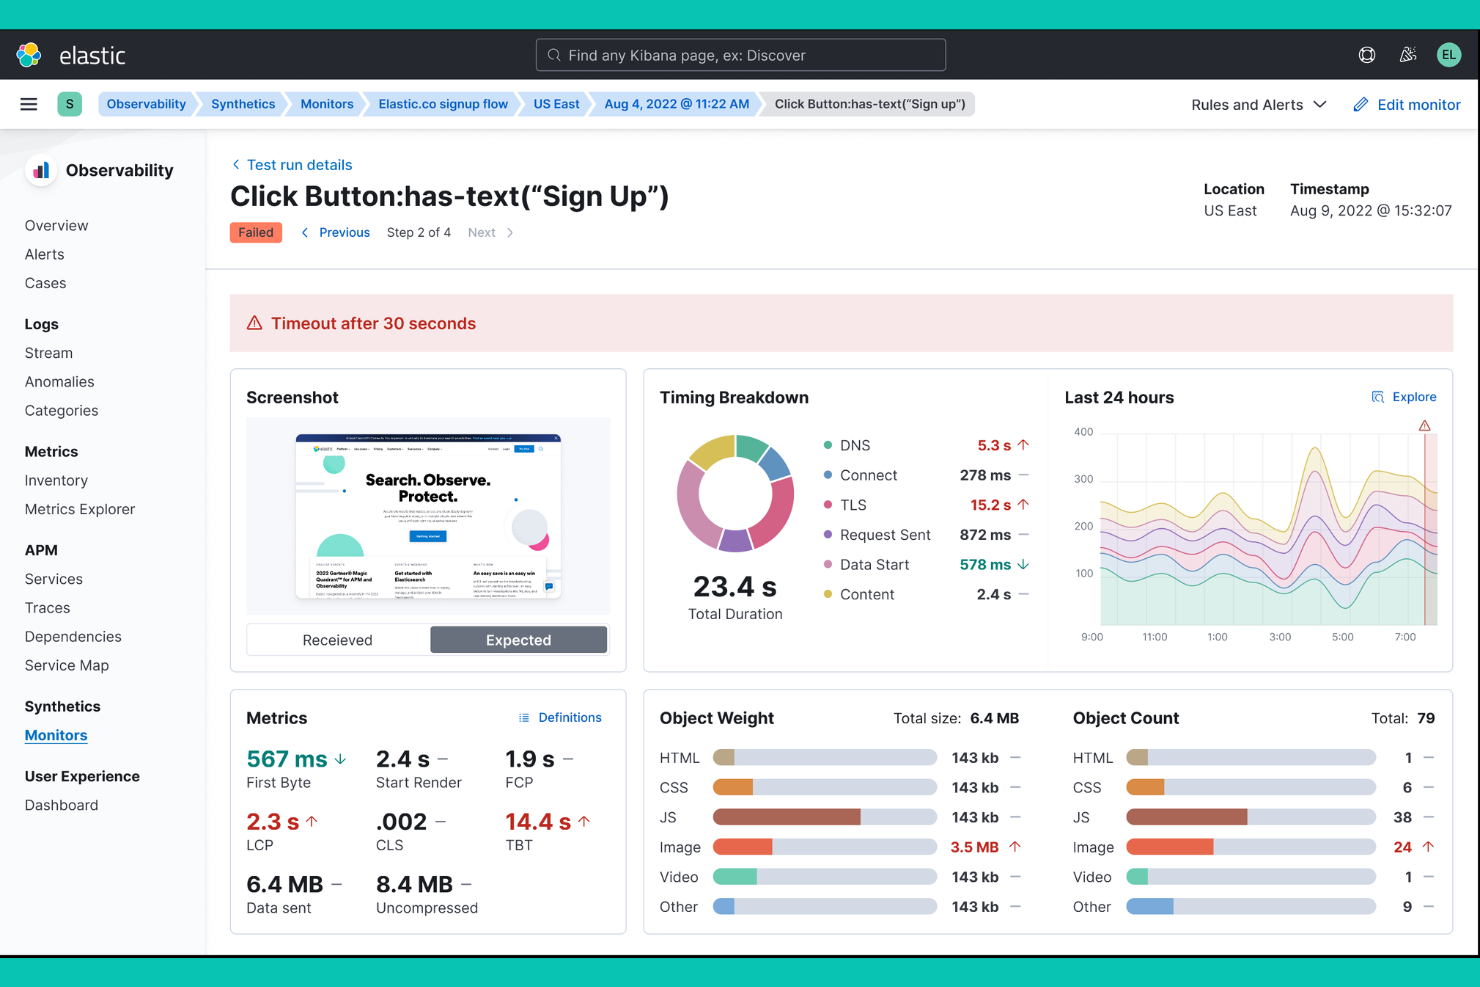
Elastic Observability, built on Elasticsearch, brings together logs, metrics, and traces in a single platform for unified analysis. This solution is a strong fit for engineering teams and IT operations that need to correlate data across complex, distributed environments. Unlike many New Relic alternatives, Elastic Observability emphasizes flexible search, AI-driven anomaly detection, and customizable dashboards for deep troubleshooting.
Why Elastic Observability Is a Good New Relic Alternative
What sets Elastic Observability apart is its unified approach to log and metric analysis across your entire stack. I appreciate how you can ingest, search, and correlate logs, metrics, and traces from multiple sources in one place. The platform’s AI-driven anomaly detection and customizable visualizations help teams quickly pinpoint and investigate issues. For organizations that need deep, flexible observability across distributed systems, Elastic Observability offers a compelling alternative to New Relic.
Elastic Observability Key Features
Some other features that make Elastic Observability stand out include:
- Uptime monitoring: Tracks service availability and response times across endpoints.
- Service map visualization: Displays relationships and dependencies between services in your environment.
- Prebuilt integrations: Connects natively with AWS, Azure, Google Cloud, Kubernetes, and more.
- Role-based access control: Manages user permissions and data access within the platform.
Elastic Observability Integrations
Integrations include AWS, Azure, Google Cloud, Kubernetes, Docker, Kafka, MongoDB, PostgreSQL, Microsoft SQL Server, and Slack.
Pros and Cons
Pros:
- Customizable dashboards and visualizations
- AI-driven anomaly detection for observability data
- Unified search across logs, metrics, and traces
Cons:
- Limited out-of-the-box business metric templates
- No built-in application profiling tools
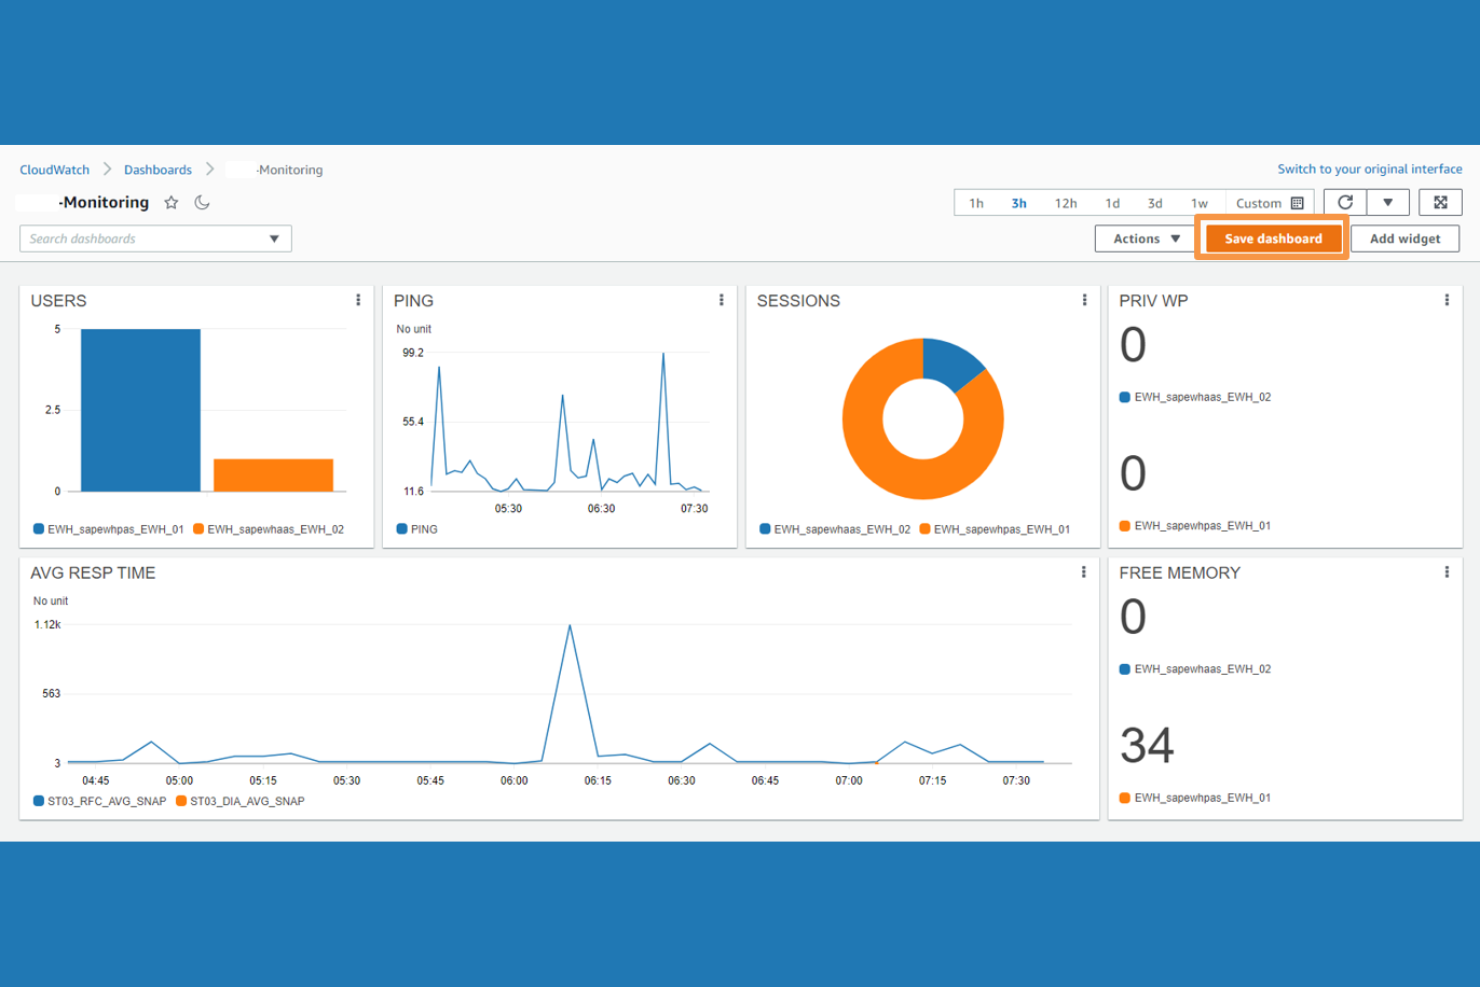
If your team relies heavily on AWS services, Amazon CloudWatch offers monitoring and observability built directly into the AWS ecosystem. It’s a strong fit for cloud architects, DevOps teams, and enterprises running workloads on AWS who want native integration with their infrastructure and services. CloudWatch stands out from other New Relic alternatives by providing easy access to AWS resource metrics, logs, and alarms without extra configuration.
Why Amazon CloudWatch Is a Good New Relic Alternative
For teams operating within the AWS ecosystem, Amazon CloudWatch delivers monitoring that’s tightly integrated with AWS services. I picked CloudWatch because it automatically collects and visualizes metrics from nearly every AWS resource, including EC2, Lambda, and RDS, without extra setup. Its native log aggregation and alarm features let you detect and respond to issues across your AWS environment in real time. If you want observability that’s purpose-built for AWS workloads, CloudWatch is a practical alternative to New Relic.
Amazon CloudWatch Key Features
Some other features that caught my attention include:
- Custom dashboards: Build visualizations that combine metrics, logs, and alarms in a single view.
- Anomaly detection: Automatically identifies unusual patterns in metric data using machine learning.
- CloudWatch Synthetics: Simulates user interactions to monitor application endpoints and APIs.
- Cross-account observability: Aggregate and analyze telemetry data from multiple AWS accounts in one place.
Amazon CloudWatch Integrations
Integrations include Amazon EC2, Amazon RDS, Amazon S3, Amazon ECS, Amazon EKS, AWS Lambda, and more.
Pros and Cons
Pros:
- Built-in synthetic monitoring for API endpoints
- Granular metric collection for AWS resources
- Direct integration with all AWS native services
Cons:
- Time-consuming alerting configuration
- Limited visibility into non-AWS environments
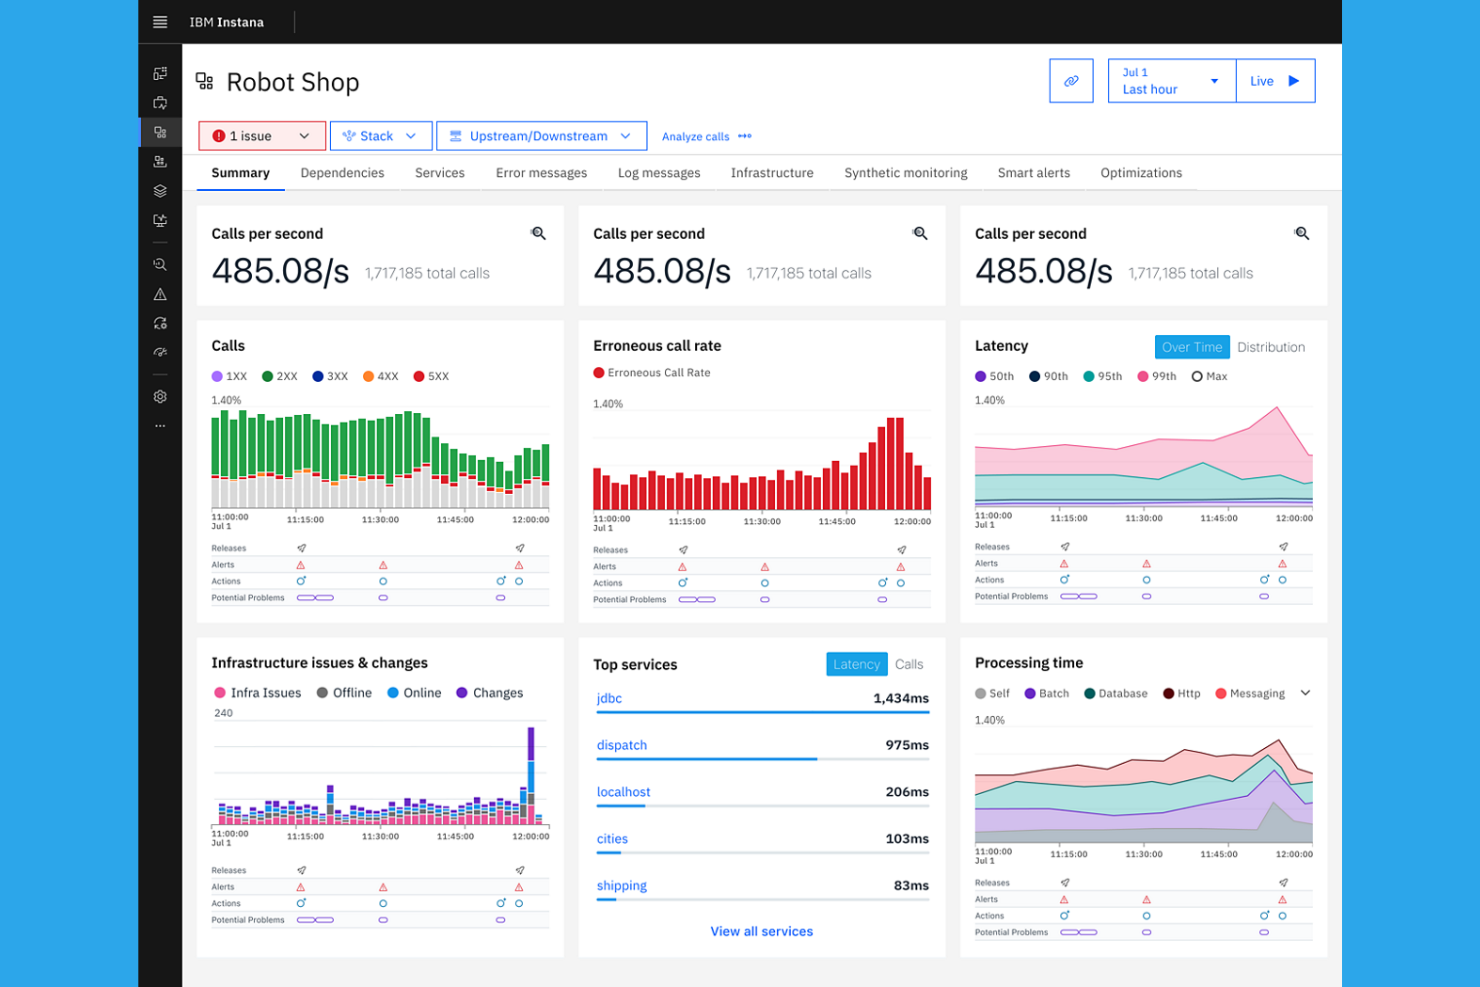
IBM Instana stands out for its automated application discovery and real-time observability. It’s a strong fit for enterprises and DevOps teams managing complex, dynamic environments where manual instrumentation is a challenge. Instana’s continuous, automated mapping of services and dependencies helps teams quickly pinpoint issues that other New Relic alternatives might miss.
Why IBM Instana Is a Good New Relic Alternative
Unlike many observability platforms, IBM Instana automatically discovers and maps every component in your application environment. I picked Instana because its automated application discovery means you don’t have to manually configure or update monitoring as your architecture evolves. Instana continuously detects new services, dependencies, and changes in real time, which is especially valuable for dynamic microservices and containerized workloads. This level of automation helps teams maintain visibility and quickly identify root causes, making it a strong alternative to New Relic for complex environments.
IBM Instana Key Features
In addition to automated discovery and mapping, I also found these features valuable:
- Unbounded analytics: Enables users to query and analyze all collected metrics, traces, and logs without sampling.
- Contextualized alerting: Delivers alerts based on real-time context and dependencies within your environment.
- End-user monitoring: Tracks user experience and performance from the browser or mobile device through backend services.
- One-second granularity: Captures and displays performance data at one-second intervals for detailed troubleshooting.
IBM Instana Integrations
Integrations include AWS EC2, IBM Cloud, Google Cloud Platform, Microsoft Azure, Red Hat OpenShift, VMware Tanzu, MongoDB, Apache Kafka, PagerDuty, and more.
Pros and Cons
Pros:
- Supports containerized and cloud-native apps
- One-second data granularity for real-time insights
- Automated discovery of microservices and dependencies
Cons:
- High resource usage for on-premises agents
- Limited customization for visualizations
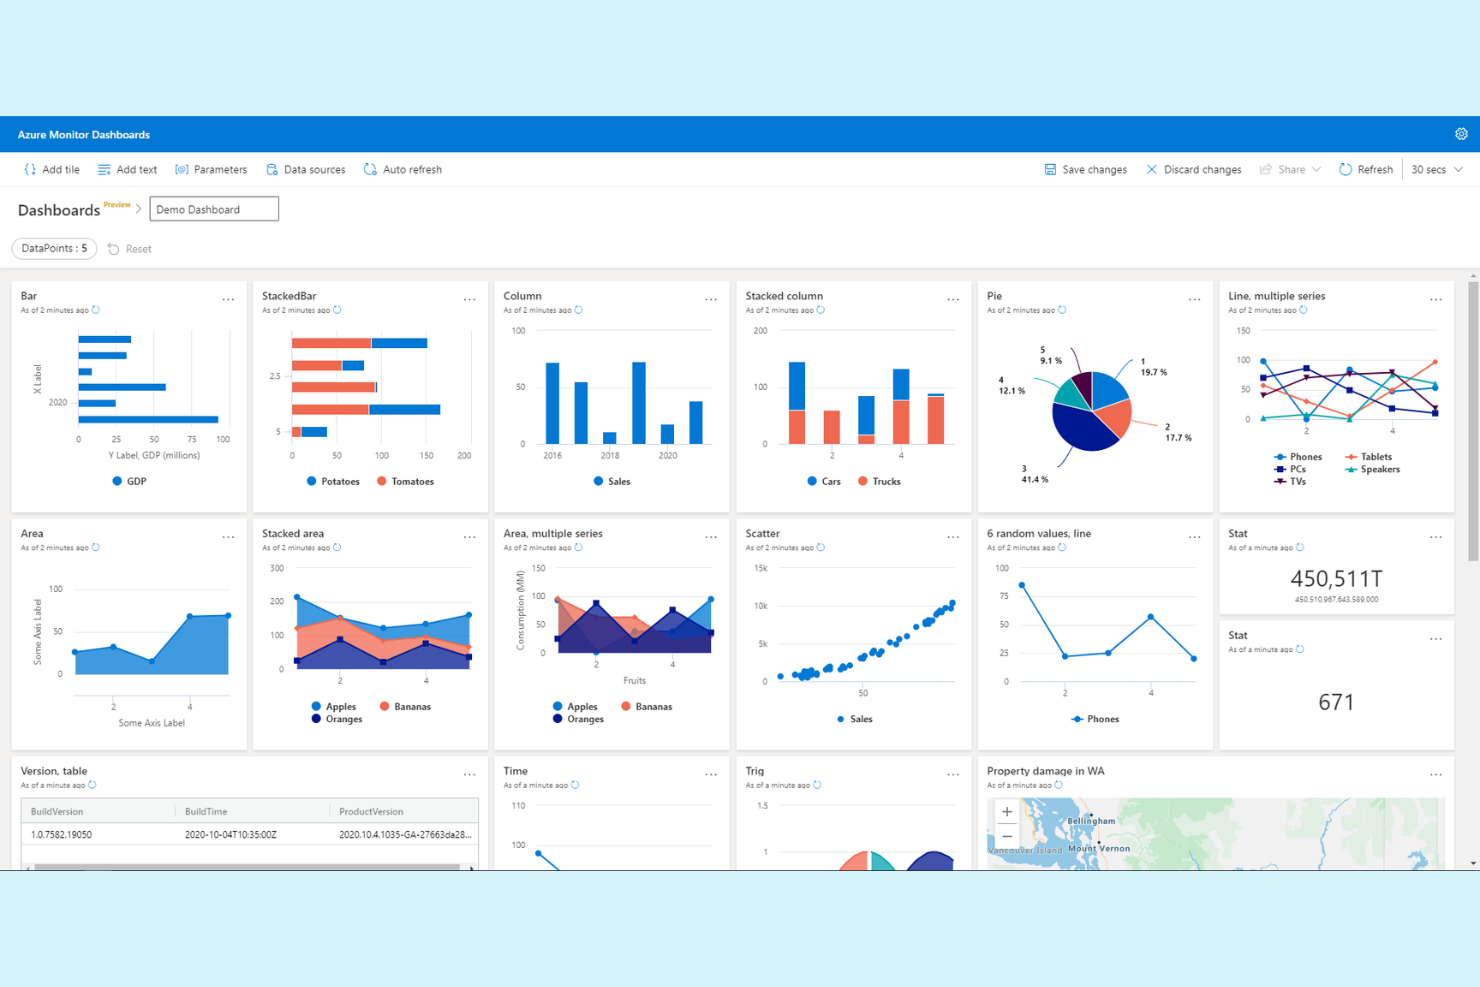
Azure Monitor is purpose-built for organizations running critical workloads on Microsoft Azure. It’s a strong choice for IT teams, cloud engineers, and enterprises that want deep, native observability across Azure resources and services. Unlike other New Relic alternatives, Azure Monitor offers unified telemetry, diagnostics, and alerting that are tightly integrated with the Azure platform.
Why Azure Monitor Is a Good New Relic Alternative
When your infrastructure is built on Microsoft Azure, Azure Monitor offers observability that’s deeply embedded in the platform. I picked Azure Monitor because it collects telemetry from every Azure service, providing unified metrics, logs, and traces without extra configuration. Its Application Insights feature delivers end-to-end monitoring for distributed applications, making it easier to diagnose issues across cloud-native workloads. For teams invested in Azure, this level of integration and visibility sets Azure Monitor apart from other New Relic alternatives.
Azure Monitor Key Features
Some other features worth highlighting include:
- Log Analytics workspace: Centralizes and queries log data from multiple Azure resources.
- Smart alerts: Uses dynamic thresholds and machine learning to reduce false positives.
- Network monitoring: Tracks connectivity, latency, and packet loss across Azure networks.
- Workbooks: Lets you build interactive reports and dashboards for custom visualizations.
Azure Monitor Integrations
Integrations include Azure Kubernetes Service, Azure Arc, Azure Cosmos DB, Azure SQL, Azure Data Factory, Azure Functions, and more.
Pros and Cons
Pros:
- Centralized log analytics across Azure resources
- Built-in support for Azure Kubernetes Service
- Deep integration with Microsoft Azure services
Cons:
- High alert noise without tuning
- Query language differs from industry standards
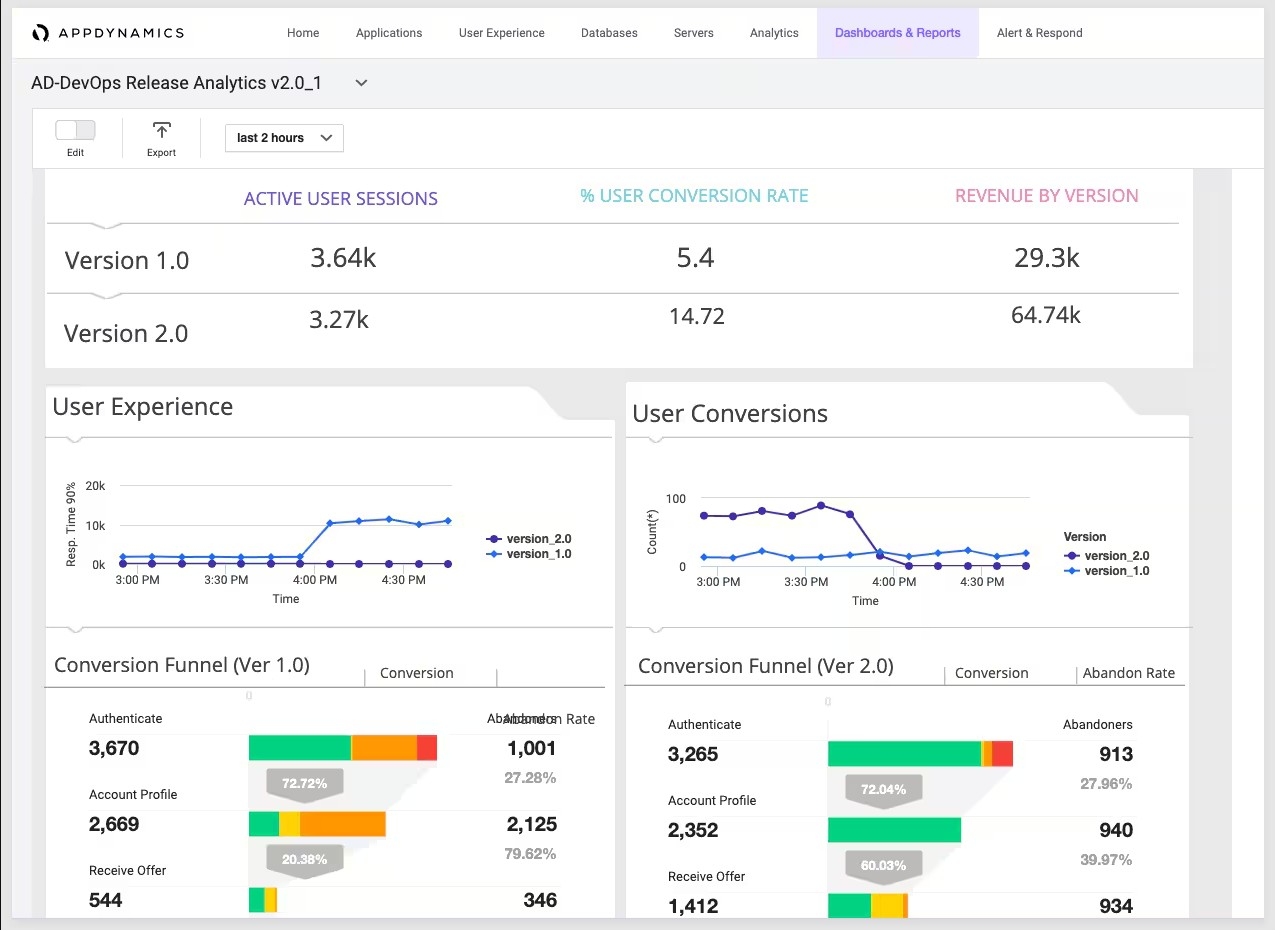
Splunk AppDynamics is designed for teams that need deep visibility into business transaction flows across complex applications. It’s especially useful for enterprises and IT leaders who want to connect application performance directly to business outcomes. If you’re looking for a New Relic alternative that excels at mapping and monitoring end-to-end business transactions, Splunk AppDynamics offers a focused approach.
Why Splunk AppDynamics Is a Good New Relic Alternative
Splunk AppDynamics stands out for its ability to monitor business transactions end-to-end, making it a strong choice for organizations that need to tie application performance directly to business metrics. I like how it automatically discovers, maps, and visualizes transaction flows across distributed environments, so you can see exactly where bottlenecks impact user experience or revenue. Its transaction snapshots and code-level diagnostics help teams quickly identify and resolve issues that affect critical business processes. For teams prioritizing business transaction monitoring over generic application metrics, Splunk AppDynamics offers a focused and actionable alternative to New Relic.
Splunk AppDynamics Key Features
In addition to its business transaction monitoring focus, I also found these features valuable:
- Dynamic baselining: Automatically establishes performance baselines and detects anomalies based on historical trends.
- End-user monitoring: Captures real user interactions and performance data from browsers and mobile devices.
- Infrastructure visibility: Monitors servers, databases, and cloud resources alongside application data.
- Custom dashboards: Lets you build tailored visualizations for different teams and stakeholders.
Splunk AppDynamics Integrations
Integrations include Splunk, SAP, Cisco ThousandEyes, OpenTelemetry, ServiceNow, AWS, Microsoft Azure, Google Cloud Platform, and more.
Pros and Cons
Pros:
- Integration with Cisco networking tools
- Code-level diagnostics for Java and .NET
- Granular business transaction mapping
Cons:
- Pricing increases with additional modules
- Limited support for open-source frameworks
Sentry offers real-time error tracking designed for teams that need instant visibility into application issues. It’s especially useful for developers and engineering leads who want to quickly identify, triage, and resolve errors before they impact users. Unlike many New Relic alternatives, Sentry focuses on actionable error diagnostics and deep context for every incident.
Why Sentry Is a Good New Relic Alternative
For teams that need to catch and resolve errors as they happen, Sentry’s real-time error tracking stands out. I picked Sentry because it instantly notifies you of new issues and provides detailed stack traces, user context, and release tracking for every error. Sentry’s event grouping and issue resolution workflow help developers prioritize and fix the most impactful problems quickly. This focus on actionable, real-time diagnostics makes Sentry a strong alternative to New Relic for organizations that want to minimize downtime and user disruption.
Sentry Key Features
Some other features that make Sentry appealing include:
- Performance monitoring: Tracks transaction times and bottlenecks across your application stack.
- Release health tracking: Monitors the stability and adoption of each software release.
- Session replay: Captures user sessions to help visualize the steps leading up to an error.
- Custom alert rules: Lets you define specific conditions for triggering notifications.
Sentry Integrations
Integrations include GitHub, Slack, Jira, GitLab, Azure DevOps, PagerDuty, Datadog, Microsoft Teams, Vercel, and more.
Pros and Cons
Pros:
- Flexible custom alert rules for notifications
- Deep integration with developer toolchains
- Real-time error alerts with detailed context
Cons:
- No synthetic transaction monitoring features
- Limited infrastructure monitoring capabilities
New Product Updates from Sentry

Sentry Adds AI Dashboard Generation in Beta
Sentry introduces AI Dashboard Generation in beta, enabling users to create dashboards using prompts through an agent. This makes dashboard setup faster and easier without manual configuration. For more information, visit Sentry’s official site.
 .
.Best for monitoring hybrid IT environments
ManageEngine Applications Manager is designed for teams managing self-hosted, cloud, and on-premises systems in hybrid IT environments. It appeals to IT operations and infrastructure teams that need unified monitoring across diverse technologies. If you’re looking for deep visibility into applications, servers, and databases without being tied to a single cloud provider, this platform stands out.
Why ManageEngine Applications Manager Is a Good New Relic Alternative
For organizations juggling PHP apps and on-premises assets, ManageEngine Applications Manager offers unified monitoring. I picked it for its ability to track performance across hybrid IT environments, including legacy systems and modern cloud apps. The platform provides real-time application, server, and database monitoring from a single dashboard. Its support for over 150 technologies makes it a strong fit for teams with diverse infrastructure.
ManageEngine Applications Manager Key Features
Some other features worth noting include:
- Synthetic transaction monitoring: Simulate user interactions to proactively detect application issues before they impact real users.
- Customizable dashboards: Build tailored views to track the metrics and KPIs that matter most to your team.
- Automated alerting: Set up threshold-based alerts to notify you of performance anomalies or outages as soon as they occur.
- Root cause analysis tools: Drill down into incidents with detailed reports and dependency mapping to quickly identify the source of problems.
ManageEngine Applications Manager Integrations
Integrations include AWS, Azure, Google Cloud Platform, Oracle Cloud, Microsoft 365, ServiceNow, Docker, Kubernetes, VMware, and Apache Tomcat.
Pros and Cons
Pros:
- Monitors 150+ different application types
- Offers deep database and server visibility
- Supports both cloud and on-premises monitoring
Cons:
- Fewer AI-driven insights than competitors
- User interface can feel outdated
New Product Updates from ManageEngine Applications Manager
ManageEngine Applications Manager Adds Veeam Monitoring
ManageEngine Applications Manager adds Veeam Enterprise Manager monitoring. This update enables tracking of backup infrastructure, job performance, and storage usage. For more information, visit ManageEngine’s official site.
 .
.

New Relic Alternatives Selection Criteria
When selecting the best New Relic alternatives to include in this list, I considered common buyer needs and pain points related to application performance monitoring and observability platform products, like troubleshooting distributed systems and identifying performance bottlenecks. I also used the following framework to keep my evaluation structured and fair:
Core Functionality (25% of total score)
To be considered for inclusion in this list, each solution had to fulfill these common use cases:
- Monitor application performance in real time
- Track and alert on errors and exceptions
- Visualize distributed traces and service maps
- Analyze logs and metrics together
- Support integrations with cloud environments
Additional Standout Features (25% of total score)
To help further narrow down the competition, I also looked for unique features, such as:
- High-cardinality event analysis
- AI-driven anomaly detection
- Customizable dashboards and visualizations
- Built-in service level objective tracking
- Advanced root cause analysis tools
Usability (10% of total score)
To get a sense of the usability of each system, I considered the following:
- Intuitive navigation and dashboard layout
- Clear data visualization options
- Minimal setup for core monitoring features
- Responsive and accessible user interface
- Logical organization of monitoring and alerting tools
Onboarding (10% of total score)
To evaluate the onboarding experience for each platform, I considered the following:
- Availability of step-by-step setup guides
- Access to training videos and documentation
- Interactive product tours or onboarding checklists
- Prebuilt templates for common monitoring scenarios
- Support for data migration from other platforms
Customer Support (10% of total score)
To assess each software provider’s customer support services, I considered the following:
- Availability of live chat or phone support
- Responsiveness to technical issues
- Access to a knowledge base or help center
- Community forums or user groups
- Availability of onboarding and troubleshooting webinars
Value For Money (10% of total score)
To evaluate the value for money of each platform, I considered the following:
- Cost-effective and transparent pricing models
- Range of features included in base plans
- Flexibility to scale with business needs
- No hidden fees or surprise charges
- Free trial or free plan availability
Customer Reviews (10% of total score)
To get a sense of overall customer satisfaction, I considered the following when reading customer reviews:
- Consistency of positive feedback across platforms
- Reports of reliable performance and uptime
- Feedback on support and onboarding experiences
- User comments on feature depth and flexibility
- Trends in recent updates or improvements
Why Look For a New Relic Alternative?
While New Relic is a strong choice, many users seek alternatives due to New Relic's pricing and data volume costs. You might be looking for a New Relic alternative because…
- You need more flexible pricing for high data volumes
- You want deeper support for open source integrations
- You require advanced high-cardinality event analysis
- You need more granular control over data retention
- You want a simpler interface for distributed tracing
- You operate in regions with limited New Relic support
If any of these sound like you, you’ve come to the right place. My list contains several application performance monitoring and observability platform options that are better suited for teams facing these challenges with New Relic and looking for alternatives.
New Relic Key Features
Here are some of the key features of New Relic, to help you contrast and compare what alternative solutions offer:
- APM monitoring: Tracks application performance metrics, error rates, and transaction times to help teams identify and resolve bottlenecks in real time.
- Distributed tracing: Follows requests as they travel through microservices and infrastructure, making it easier to pinpoint where latency or failures occur.
- Infrastructure monitoring: Provides visibility into servers, containers, and cloud resources, allowing users to correlate infrastructure health with application performance.
- Log management: Collects and analyzes log data from multiple data sources, enabling faster troubleshooting and root cause analysis.
- Synthetic monitoring: Simulates user interactions and API calls to proactively detect outages or performance issues before they impact real users.
- Real user monitoring (RUM): Captures data from actual user sessions, offering insights into frontend performance and user experience across devices and locations.
- Alerting and incident management: Sends customizable alerts based on thresholds or anomalies, and integrates with incident response tools to manage resolution workflows.
- Dashboards and visualization: Offers customizable dashboards that aggregate metrics, traces, and logs for a unified view of system health and performance.
- Service maps: Visualize relationships and dependencies between services, helping teams understand the impact of issues across distributed environments.
- Integrations: Connects natively with popular cloud providers, DevOps tools, and third-party platforms to centralize observability data and automate workflows.
What’s Next:
If you're in the process of researching New Relic alternatives, connect with a SoftwareSelect advisor for free recommendations.
You fill out a form and have a quick chat where they get into the specifics of your needs. Then you'll get a shortlist of software to review. They'll even support you through the entire buying process, including price negotiations.