13 Best Dynatrace Competitors Reviewed in 2026

Best Dynatrace Competitors Shortlist
Here’s my shortlist of the best Dynatrace competitors:


As a customer experience manager, you're juggling countless challenges. You need data observability tools that help your team track performance issues, manage resources, and keep your customers satisfied. Dynatrace is popular, but it might not fit your specific needs.
In my experience, finding the right alternative can make a difference. You may be looking for better pricing, specific features, or advanced integration with existing systems.
I've independently tested and reviewed various options to give you the best competitors to Dynatrace. I'll guide you through my top picks, helping you make an informed decision that suits your business needs. Let's explore the solutions that can truly benefit your team.
What is Dynatrace?
Dynatrace is a data observability platform that helps businesses monitor and optimize application performance. It's generally used by IT professionals, developers, and customer experience managers who need to ensure smooth operations and high-quality user experiences.
Automated infrastructure monitoring, AI-driven insights, and full-stack observability workflows help teams identify issues, understand performance metrics, and improve resource management. Overall, Dynatrace provides valuable insights to increase system uptime.
Best Dynatrace Competitors Summary
This comparison chart summarizes pricing details for my top Dynatrace alternative selections to help you find the best one for your budget and business needs.
| Tool | Best For | Trial Info | Price | ||
|---|---|---|---|---|---|
| 1 | Best for cloud-native observability | Free demo + 14-day free trial available | From $15/host/month (billed annually) | Website | |
| 2 | Best for end-to-end full-stack monitoring | Free trial + free demo available | Pricing upon request | Website | |
| 3 | Best for unified security and observability | 14-day free trial + free demo available | Pricing upon request | Website | |
| 4 | Best for AI-driven incident detection | Free demo available | From $21.20/MVS/month | Website | |
| 5 | Best for AWS ecosystem integration | Free plan available | Pricing upon request | Website | |
| 6 | Best for Azure service integration | 30-day free trial + free plan available | From $0.05/GB ingested | Website | |
| 7 | Best for all-in-one network monitoring | 30-day free trial available | From $179/month (billed annually) | Website | |
| 8 | Best for real-time error tracking | Free plan + free trial + free demo available | From $26/month (billed annually) | Website | |
| 9 | Best for hybrid IT monitoring | Free plan + 30-day free trial available | From $225/month (billed annually) | Website | |
| 10 | Best for agentless database monitoring | 30-day free trial + free demo + free plan availabl | From $199/year | Website |
Why Trust Our Software Reviews
We’ve been testing and reviewing software since 2020. As CX leaders ourselves, we know how critical and difficult it is to make the right decision when selecting software.
We invest in deep research to help our audience make better software purchasing decisions. We’ve tested more than 2,000 tools for different CX use cases and written over 1,000 comprehensive software reviews. Learn how we stay transparent & our software review methodology.
-

SupportYourApp
Visit WebsiteThis is an aggregated rating for this tool including ratings from Crozdesk users and ratings from other sites.4.7 -
Freshdesk
Visit WebsiteThis is an aggregated rating for this tool including ratings from Crozdesk users and ratings from other sites.4.4 -
Zendesk
Visit WebsiteThis is an aggregated rating for this tool including ratings from Crozdesk users and ratings from other sites.4.3


Best Dynatrace Competitors Reviews
Below are my detailed summaries of the best Dynatrace competitors that made it onto my shortlist. My reviews offer a detailed look at the key features, pros and cons, integrations, and ideal use cases of each tool to help you find the best one for you.
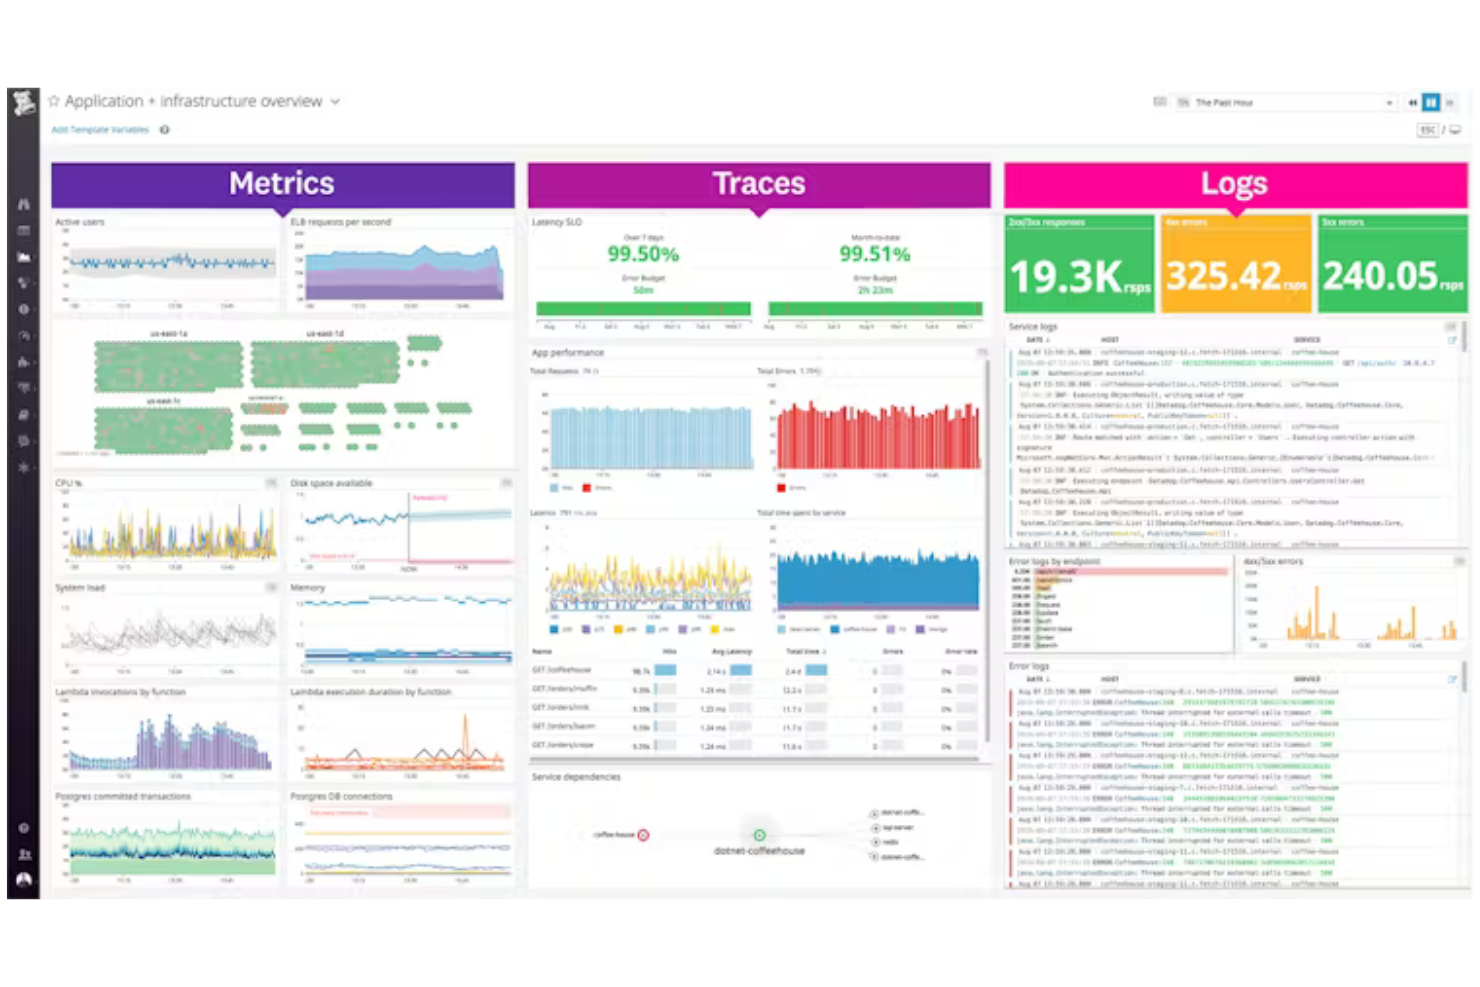
Datadog is a leading SaaS-based observability and security platform for cloud-native applications, primarily used by DevOps teams and IT professionals. It provides visibility into application performance, infrastructure health, and user experience, including monitoring for distributed systems and API performance.
Why it's a good Dynatrace alternative: Datadog excels in cloud-native observability, offering tools specifically designed for monitoring cloud environments. Its real-time dashboards provide insights into infrastructure metrics, helping you keep track of your systems. The platform's anomaly detection feature alerts your team to unusual patterns, ensuring proactive issue resolution. With its customizable alerts, you can tailor notifications to your team's needs.
Standout Features and Integrations:
Features include log management, which allows you to collect and analyze logs from various sources for deeper insights. The platform offers APM tools to track key metrics and improve application health. You can also use network performance monitoring to ensure your network's reliability and performance.
Integrations include AWS, Microsoft Azure, Google Cloud Platform, Kubernetes, Docker, Slack, GitHub, and more.
Pros and Cons
Pros:
- Effective anomaly detection
- Real-time dashboards
- Strong cloud-native focus
Cons:
- High data volume can increase costs
- Can be overwhelming for beginners
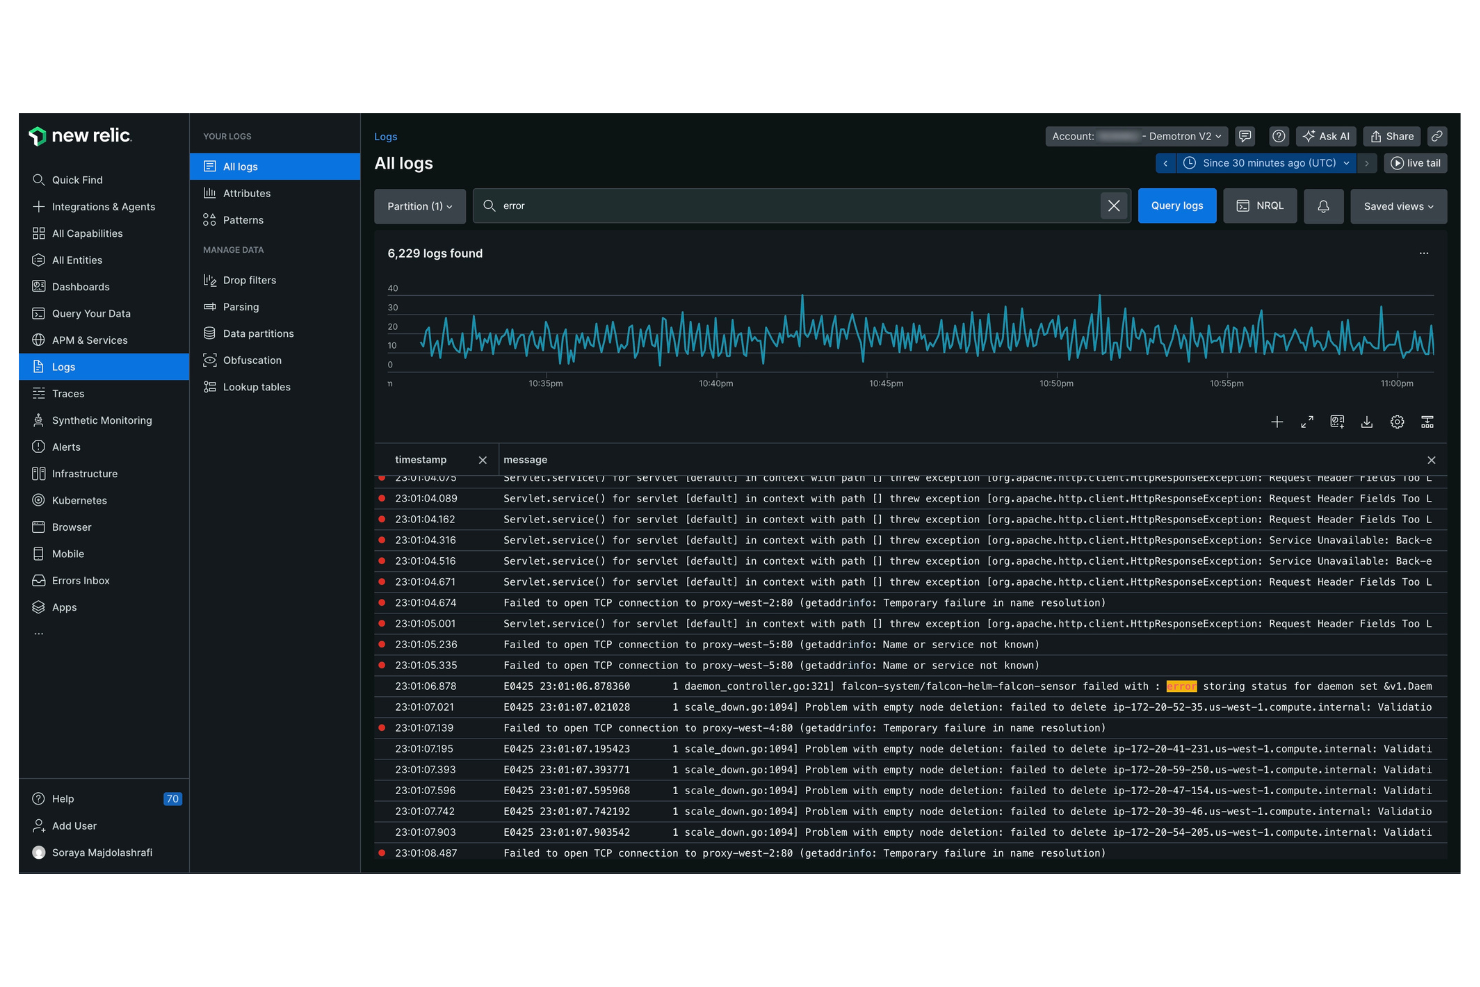
New Relic is a software analytics and performance monitoring platform designed for software engineers and IT professionals. It provides insights into application performance and infrastructure health, helping you optimize your digital operations.
Why it's a good Dynatrace alternative: New Relic offers end-to-end full-stack monitoring, providing visibility across your entire application stack. The platform's real-time analytics offer actionable insights, allowing your team to respond quickly to issues. Its custom dashboards let you visualize data in a way that suits your specific needs.
Standout Features and Integrations:
Features include error analytics, which helps you identify and resolve application errors. Its distributed tracing feature helps you track requests across services, ensuring you can identify bottlenecks. The platform also provides synthetic monitoring to simulate user interactions and test application performance. With log management, you can collect and analyze log data for deeper insights into your systems.
Integrations include AWS, Microsoft Azure, Google Cloud Platform, Kubernetes, Docker, Slack, PagerDuty, and more.
Pros and Cons
Pros:
- Customizable dashboards
- Real-time analytics
- Effective distributed tracing
Cons:
- Pricing for user seats is expensive
- UI can feel cluttered and complex
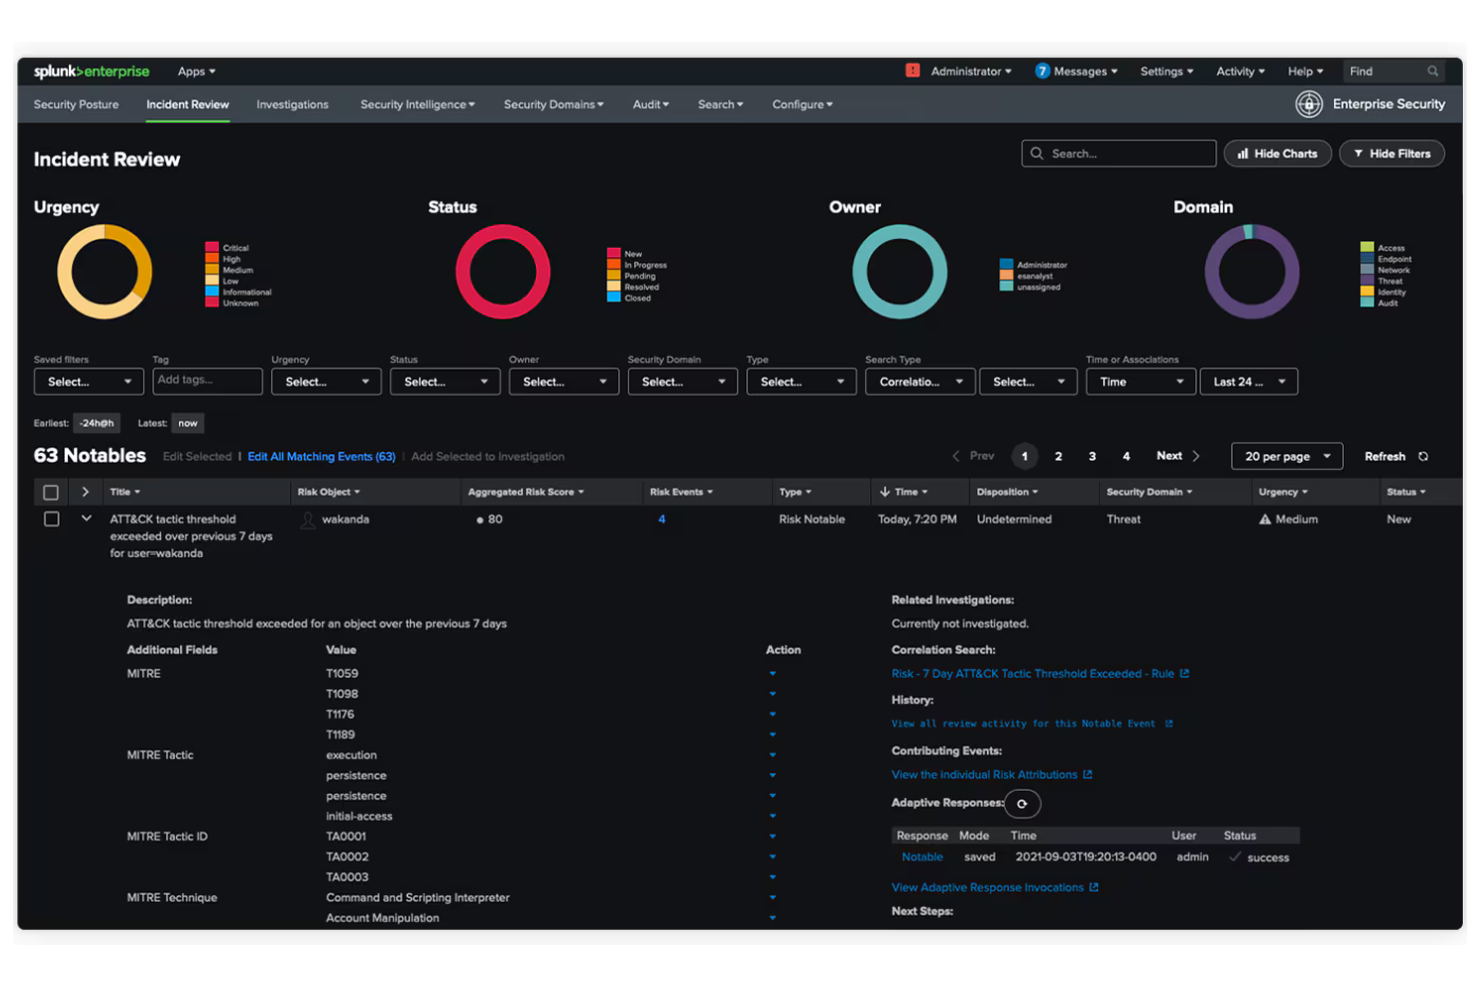
Splunk is a data platform designed for IT operations, application security, and business analytics. It helps organizations turn data into actionable insights, improving decision-making and operational efficiency.
Why it's a good Dynatrace alternative: Splunk offers unified security and observability, providing a complete view of your data across multiple environments. Its real-time data processing helps your team identify and react to issues quickly. The platform's machine learning capabilities allow for predictive insights, helping you anticipate potential problems. Customizable dashboards let you visualize data in a format that suits your operational needs.
Standout Features and Integrations:
Features include advanced threat detection to help you identify security threats in real-time. The platform also offers log management to collect and analyze data across microservices, and powerful analytics to uncover hidden patterns and trends.
Integrations include AWS, Microsoft Azure, Google Cloud Platform, ServiceNow, Cisco, Palo Alto Networks, and more.
Pros and Cons
Pros:
- Advanced threat detection
- Real-time processing
- Unified data view
Cons:
- Heavy hardware/resource requirements
- Complex configuration and setup
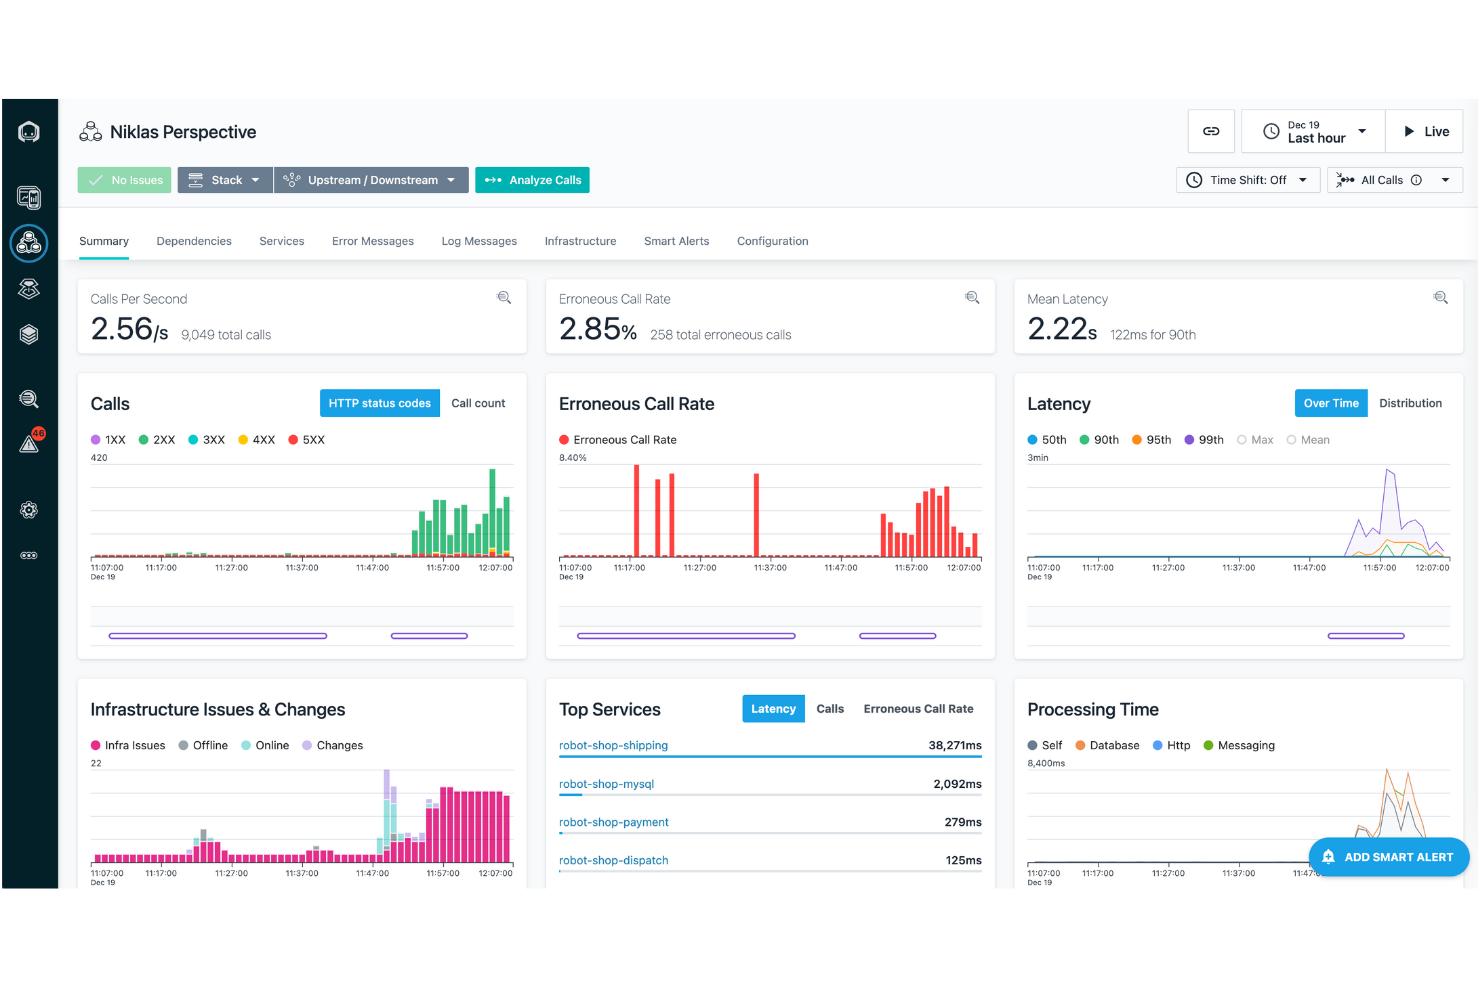
IBM Instana is an APM and observability platform aimed at DevOps teams and IT operations. It helps monitor applications and infrastructure, providing insights to optimize performance and user experience.
Why it's a good Dynatrace alternative: IBM Instana offers AI-driven incident detection, enabling your team to identify and resolve issues swiftly. Its automatic discovery and application mapping ensure complete visibility across your systems. Real-time monitoring provides immediate insights into performance metrics, helping you maintain optimal operations. With its intuitive dashboard, you can navigate and analyze data relevant to your needs with ease.
Standout Features and Integrations:
Features include automated root cause analysis, which helps pinpoint the source of issues. The platform's continuous integration support allows for automatic updates and deployments. You can also benefit from its custom alerts, which keep your team informed about critical changes.
Integrations include Kubernetes, Docker, AWS, Microsoft Azure, Google Cloud Platform, VMware Tanzu, Red Hat OpenShift, and more.
Pros and Cons
Pros:
- Automated root cause analysis
- Real-time monitoring
- AI-driven incident detection
Cons:
- Can be resource-intensive
- Requires technical expertise
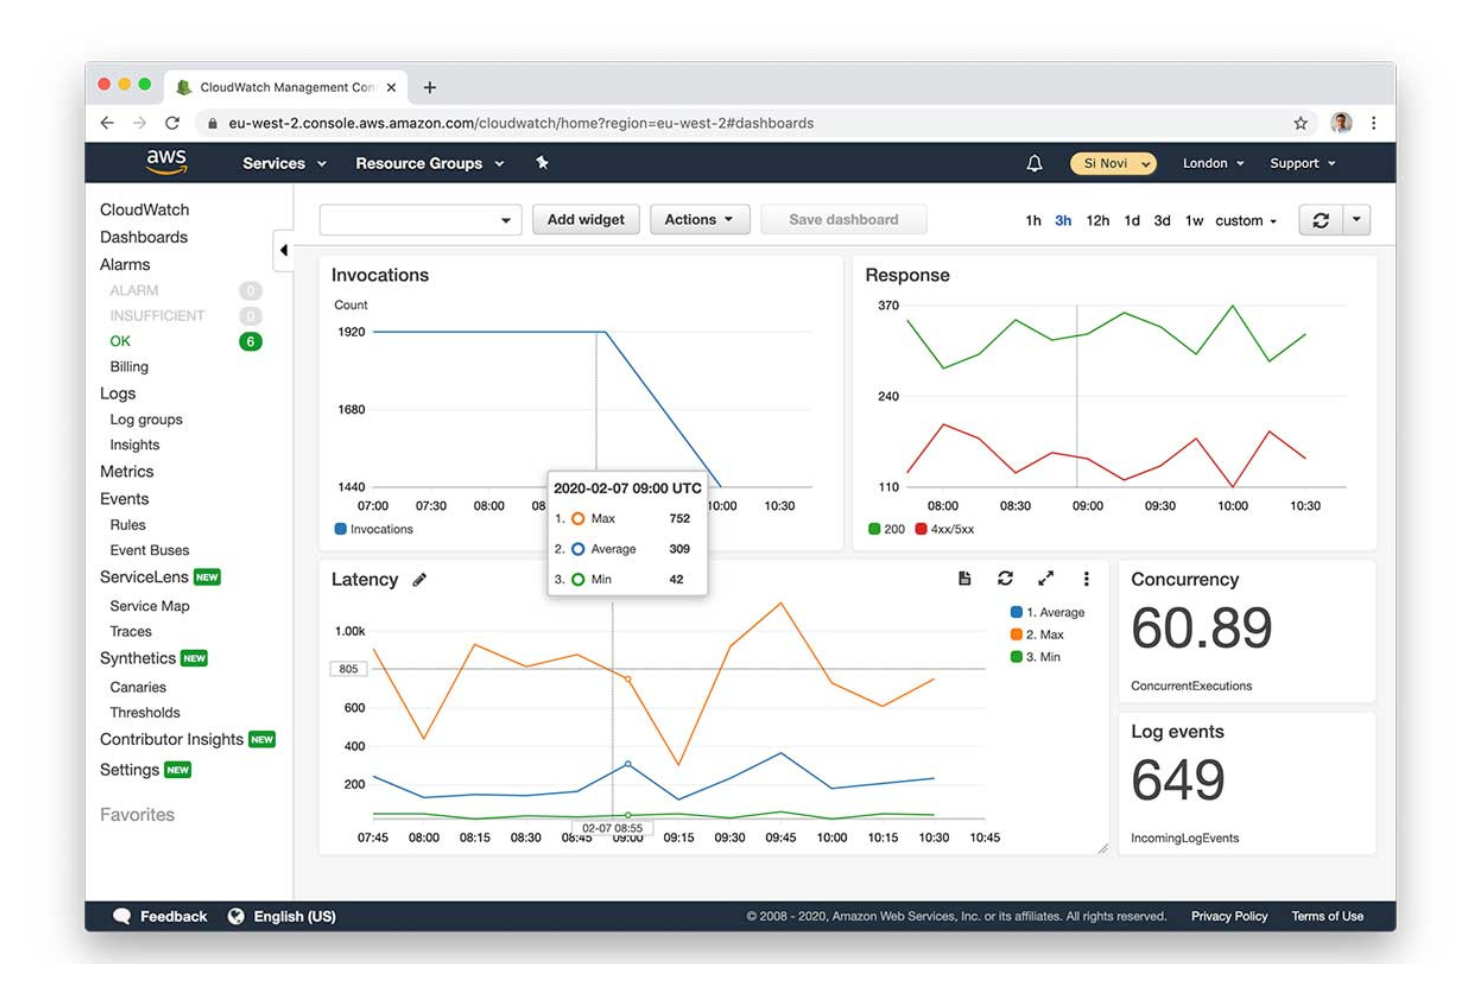
Amazon CloudWatch is a monitoring and management service designed for developers and IT operations teams. It helps monitor AWS resources and applications, providing insights into system performance and operational health.
Why it's a good Dynatrace alternative: Amazon CloudWatch offers deep, native integration with the AWS ecosystem, making it an ideal choice for teams using AWS services. Its real-time monitoring capabilities allow your team to track metrics and logs efficiently. The service's ability to set alarms based on thresholds helps ensure you're alerted to issues in time to act. Its centralized logging feature consolidates data from various sources, providing a unified view of your environment.
Standout Features and Integrations:
Features include anomaly detection, which helps identify unusual patterns in your metrics. The service offers custom dashboards, allowing you to visualize data in ways that suit your team's needs. With its event-driven automation, you can automate responses to specific conditions or changes in your environment.
Integrations include most AWS services, Dynatrace, xMatters, Slack, Microsoft Teams, SRE, and more.
Pros and Cons
Pros:
- Anomaly detection
- Real-time monitoring
- Deep AWS integration
Cons:
- Costs scale poorly with high log volume
- Very complex and confusing pricing
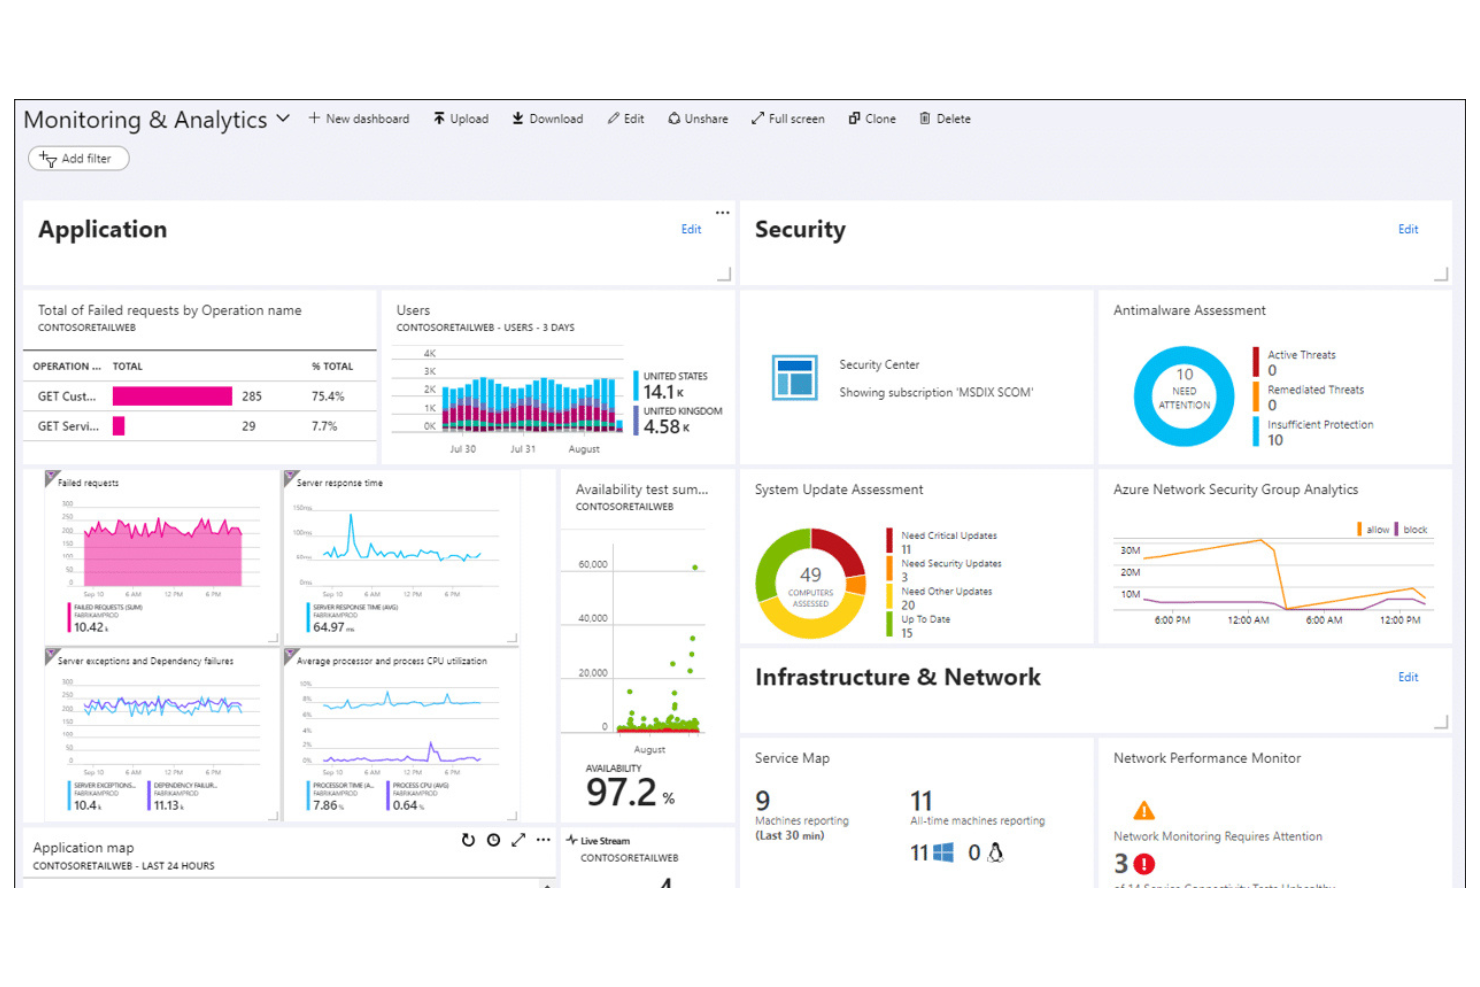
Microsoft Azure Monitor is a cloud-based platform that collects, analyzes, and acts on telemetry data. It provides insights into the performance and health of applications and infrastructure within the Azure environment.
Why it's a good Dynatrace alternative: Microsoft Azure Monitor offers tight integration with Azure services, making it an ideal choice for teams heavily invested in the Azure ecosystem. Its application insights feature provides detailed analytics, helping you understand user behavior and application performance. Log analytics allow you to query and evaluate data from various sources, improving your ability to troubleshoot issues. Custom alerts help your team stay informed about critical events in your environment.
Standout Features and Integrations:
Features include autoscale capabilities, allowing you to automatically adjust resources based on demand. Dependency tracking helps you visualize the relationships between different components in your application. The service also offers network monitoring to ensure your network's performance and availability.
Integrations include Azure DevOps, Azure Security Center, Azure Automation, Azure Logic Apps, Azure Functions, Power BI, Microsoft Teams, and more.
Pros and Cons
Pros:
- Effective log analytics
- Strong Azure integration
- Detailed application insights
Cons:
- Limited non-Azure support
- Fragmented view across hybrid clouds
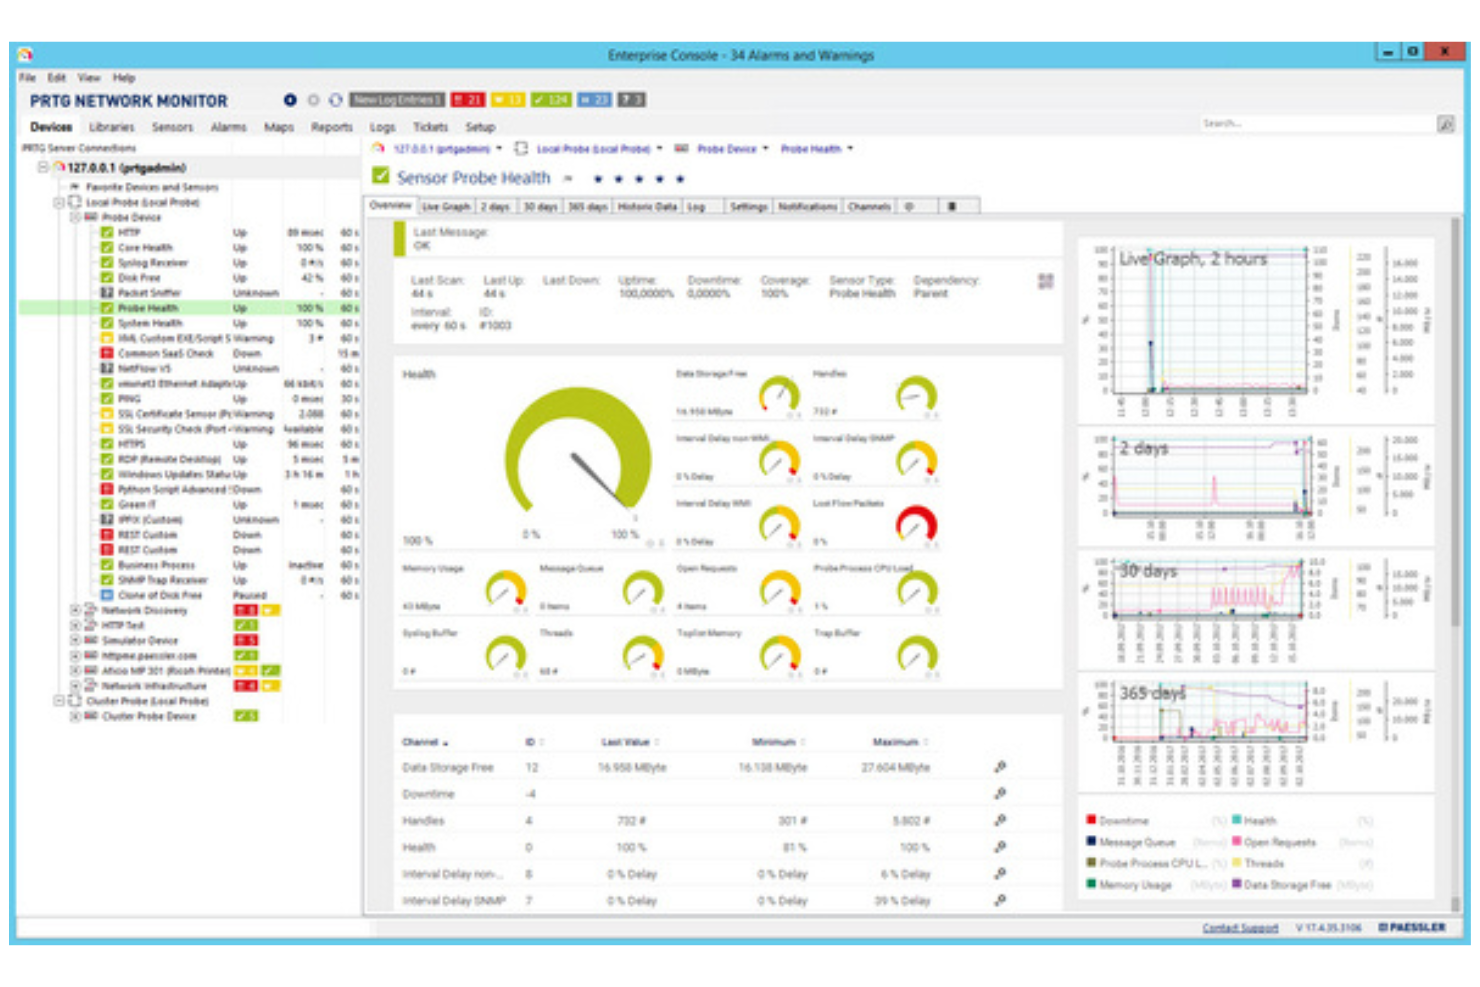
PRTG Network Monitor is a monitoring tool used by IT administrators and network managers. It helps track network performance and detect issues across your IT infrastructure.
Why it's a good Dynatrace alternative: PRTG Network Monitor offers all-in-one network monitoring, providing an extensive view of your entire network. Its sensor-based monitoring allows you to track various metrics, giving you flexibility in what you monitor. The tool provides real-time alerts to immediately notify your team of any issues. Customizable dashboards let you visualize data in a way that suits your specific needs.
Standout Features and Integrations:
Features include a map designer that lets you create custom network maps for better visualization. The reporting feature generates detailed reports on network performance, helping with analysis. You can also set up distributed monitoring to manage multiple networks from a single interface.
Integrations include Microsoft Azure, AWS, VMware, Cisco Meraki, NetApp, Dell EMC, HPE, Synology, and more.
Pros and Cons
Pros:
- Customizable dashboard views
- Real-time alert system
- All-in-one monitoring solution
Cons:
- Sensors consume license count quickly
- Windows-only core server installation
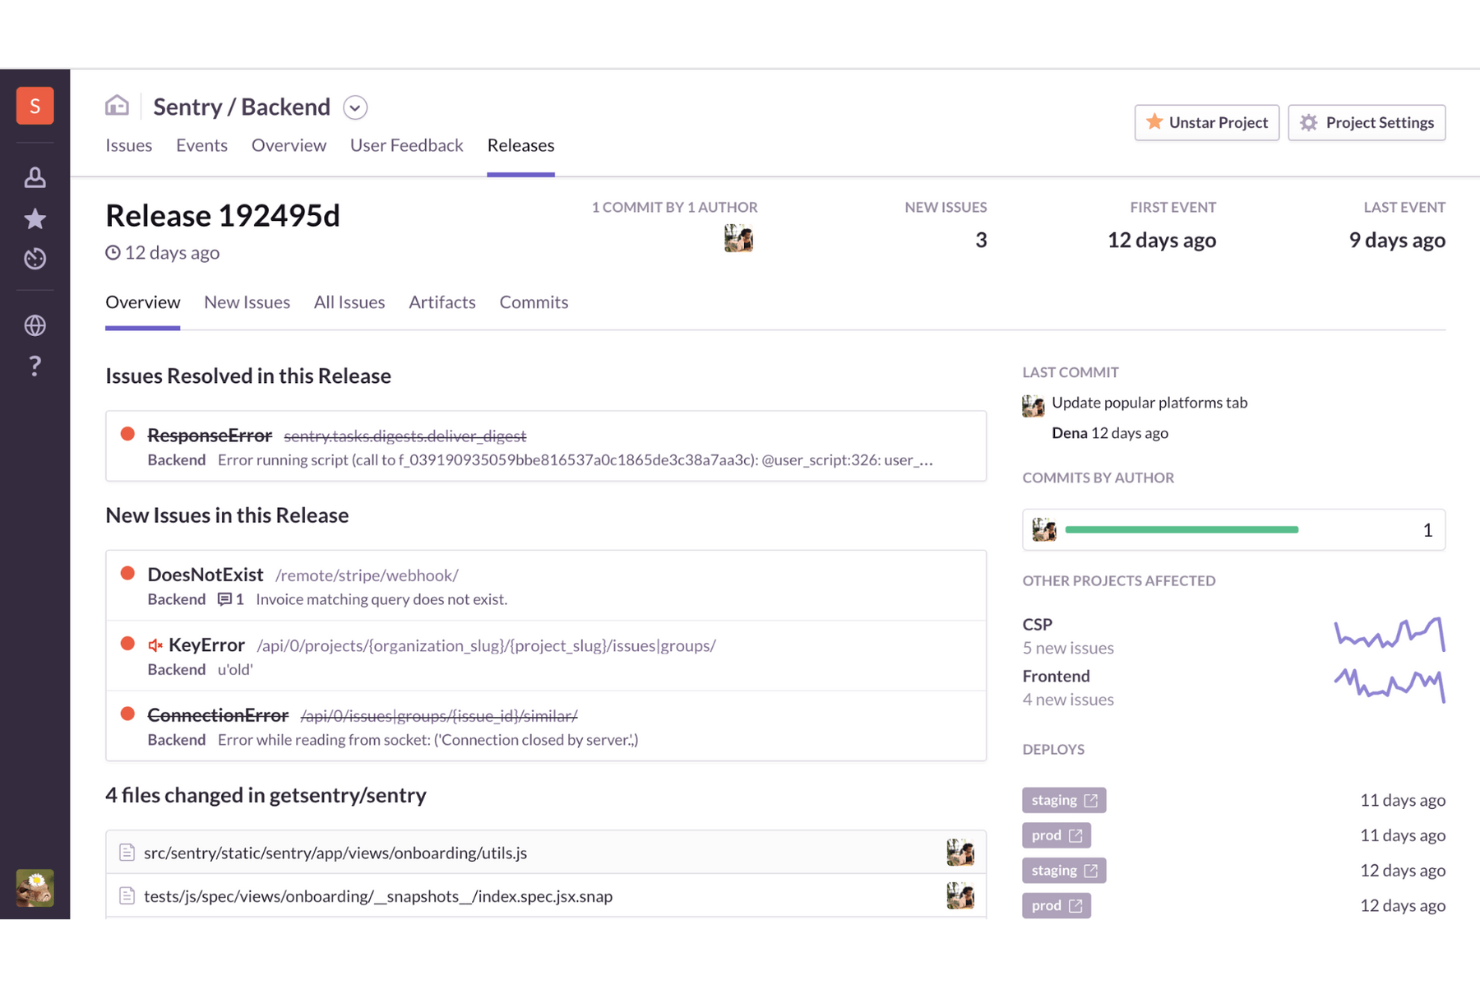
Sentry is an application performance monitoring (APM) and error tracking tool used by developers and IT teams. It helps identify and resolve application issues, ensuring smooth performance and a high-quality user experience.
Why it's a good Dynatrace alternative: Sentry focuses on real-time error tracking, providing instant notifications when issues arise. AI-driven debugging offers insights into the root causes of errors. This makes Sentry ideal for teams needing immediate error insights and resolutions.
Standout Features and Integrations:
Features include session replay, which lets you see user interactions leading up to an error. Distributed tracing helps you monitor the flow of requests across your system, identifying issues. AI code review offers automated suggestions for code improvements.
Integrations include GitHub, Slack, Jira, Bitbucket, GitLab, Trello, Asana, PagerDuty, Microsoft Teams, Linear, and more.
Pros and Cons
Pros:
- Intuitive debugging
- User-friendly interface
- Real-time error tracking
Cons:
- Ineffective alerting system
- Limited advanced analytics
New Product Updates from Sentry

Sentry Adds AI Dashboard Generation in Beta
Sentry introduces AI Dashboard Generation in beta, enabling users to create dashboards using prompts through an agent. This makes dashboard setup faster and easier without manual configuration. For more information, visit Sentry’s official site.
 .
.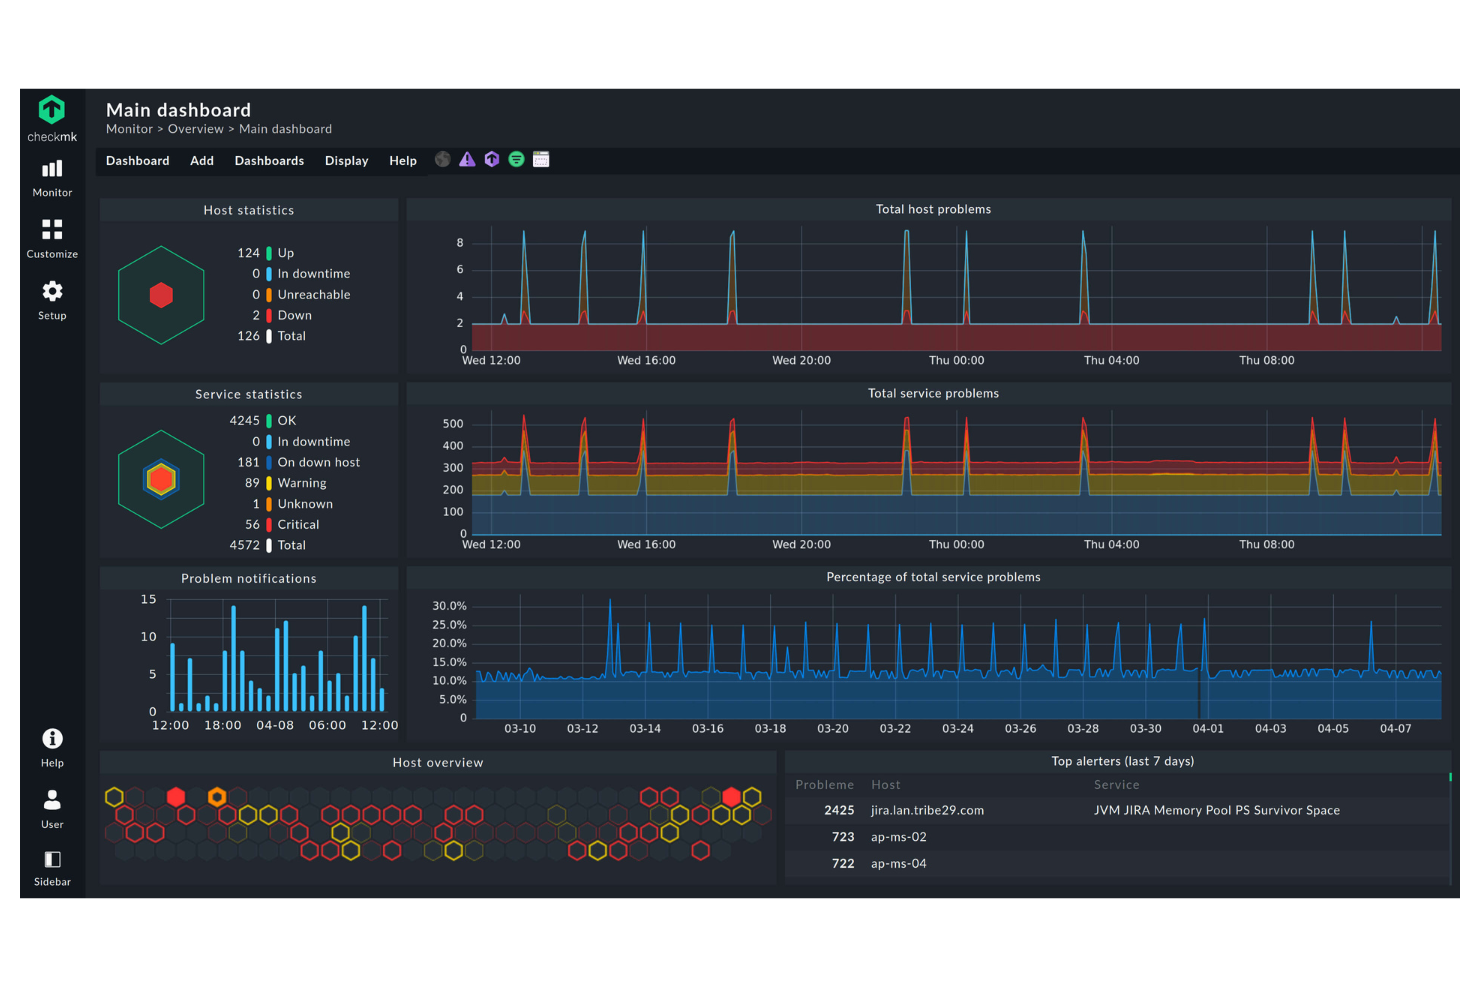
Checkmk is an IT monitoring tool designed for system administrators and IT operations teams. It provides in-depth insights into IT infrastructure, helping you manage servers, networks, and applications.
Why it's a good Dynatrace alternative: Checkmk excels in hybrid IT monitoring, allowing you to monitor both on-premises and cloud environments. With customizable dashboards, you can tailor the information to fit your specific needs. The tool also offers detailed reporting, helping you keep track of performance metrics and trends.
Standout Features and Integrations:
Features include customizable thresholds that let you set specific performance limits for alerts. The tool provides a flexible notification system, ensuring you get updates on issues that matter most. Its auto-discovery feature helps identify network devices and services, making setup easier for your team. It also supports distributed monitoring, allowing you to manage multiple sites from a central location.
Integrations include Nagios, Prometheus, Grafana, InfluxDB, VMware, AWS, Microsoft Azure, Docker, and more.
Pros and Cons
Pros:
- Customizable dashboards
- Auto-discovery of devices
- Hybrid monitoring capabilities
Cons:
- Complexity in rule-based config
- Mobile app needs significant polish
Best for agentless database monitoring
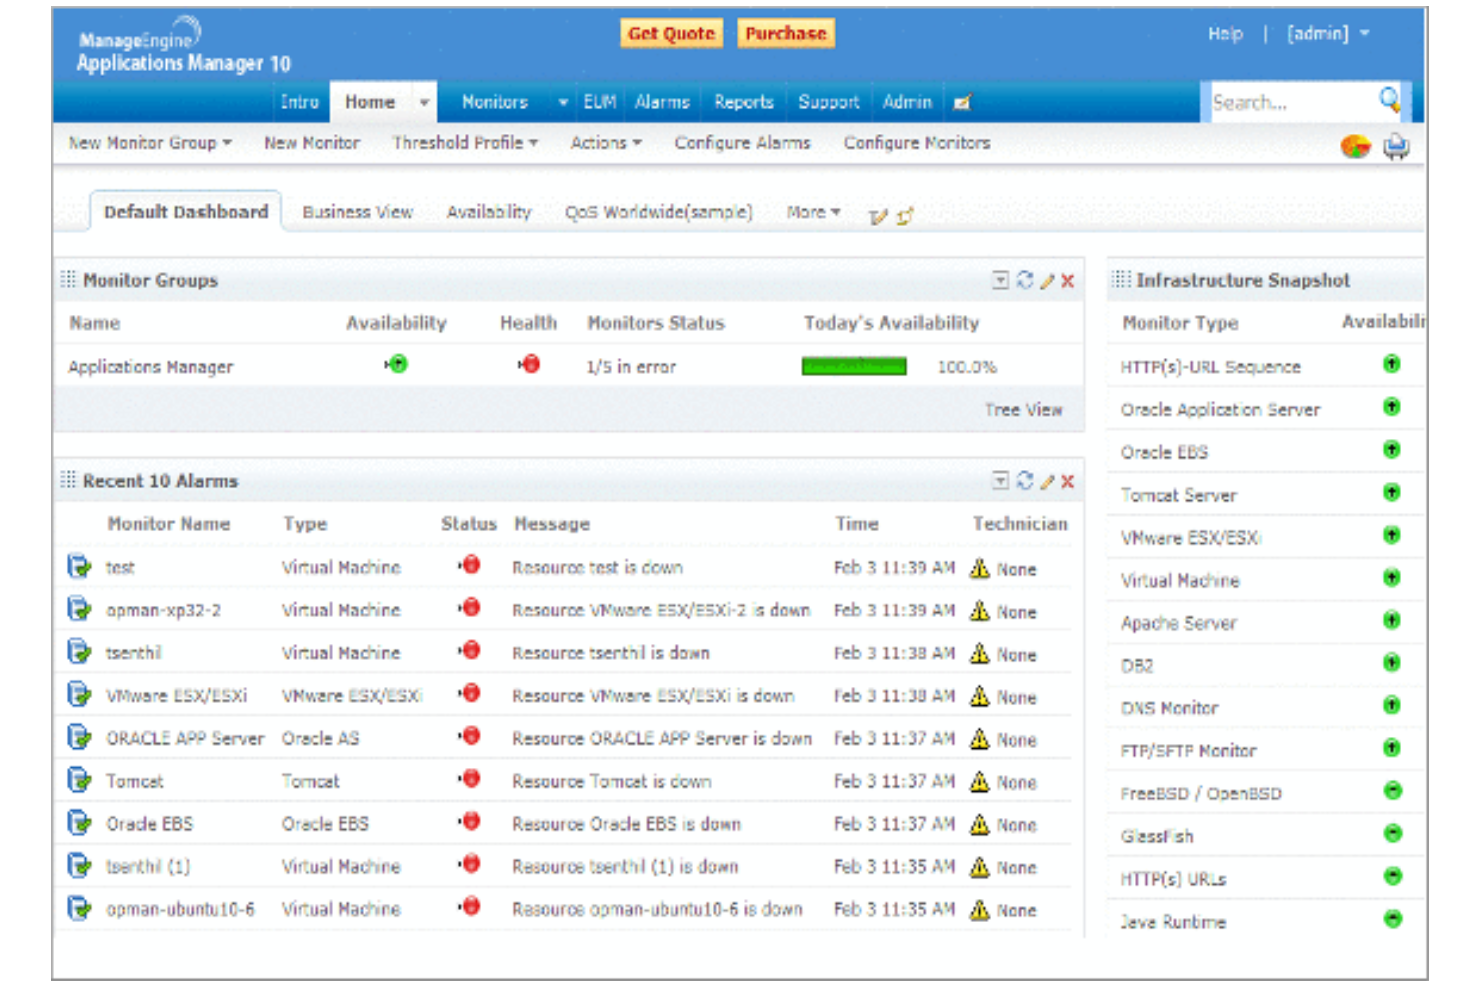
ManageEngine Applications Manager is a tool designed for IT operations and DevOps teams to monitor application performance, track resource utilization, and ensure optimal functioning of IT environments.
Why it's a good Dynatrace alternative: ManageEngine Applications Manager offers agentless database monitoring, which makes it a more practical and cost-effective choice than Dynatrace. This feature allows you to monitor databases without installing agents, reducing overhead and simplifying setup. The tool provides real-time insights into application performance, helping you identify issues quickly. It also supports a wide range of applications and infrastructure components, making it versatile for different IT needs.
Standout Features and Integrations:
Features include customizable dashboards that let you visualize performance data in a way that suits your team. Automated alerts ensure you’re notified of issues as soon as they arise. Historical data analysis helps you understand trends and plan resource allocation.
Integrations include Microsoft Azure, AWS, VMware, Oracle, Microsoft SQL, PostgreSQL, and more.
Pros and Cons
Pros:
- Customizable dashboards
- Ease of use
- Agentless monitoring solution
Cons:
- Outdated and cluttered user interface
- Heavy resource usage on hosted servers
New Product Updates from ManageEngine Applications Manager
ManageEngine Applications Manager Adds Veeam Monitoring
ManageEngine Applications Manager adds Veeam Enterprise Manager monitoring. This update enables tracking of backup infrastructure, job performance, and storage usage. For more information, visit ManageEngine’s official site.
 .
.

Dynatrace Competitors Selection Criteria
When selecting the best Dynatrace competitors to include in this list, I considered common buyer needs and pain points related to data observability platform products, such as scalability and integration capabilities. I also used the following framework to keep my evaluation structured and fair:
Core Functionality (25% of total score)
To be considered for inclusion in this list, each solution had to fulfill these common use cases:
- Monitor application performance
- Track infrastructure health
- Provide real-time alerts
- Offer log management
- Support distributed tracing
Additional Standout Features (25% of total score)
To help further narrow down the competition, I also looked for unique features, such as:
- AI-driven insights
- Customizable dashboards
- Anomaly detection
- Advanced analytics
- Automated root cause analysis
Usability (10% of total score)
To get a sense of the usability of each system, I considered the following:
- Ease of navigation
- Intuitive user interface
- Learning curve
- Customization options
- Accessibility across devices
Onboarding (10% of total score)
To evaluate the onboarding experience for each platform, I considered the following:
- Availability of training videos
- Interactive product tours
- Access to templates
- Webinars and live sessions
- Supportive chatbots
Customer Support (10% of total score)
To assess each software provider’s customer support services, I considered the following:
- Availability of live chat
- Response time for inquiries
- Access to a knowledge base
- Quality of support documentation
- Availability of 24/7 support
Value for Money (10% of total score)
To evaluate the value for money of each platform, I considered the following:
- Pricing transparency
- Feature-to-cost ratio
- Availability of free trials
- Flexible pricing plans
- Scalability of pricing
Customer Reviews (10% of total score)
To get a sense of overall customer satisfaction, I considered the following when reading customer reviews:
- Feedback on reliability
- Comments on customer service
- User satisfaction ratings
- Commonly reported issues
- Overall user recommendations
Why Look for A Dynatrace Alternative?
While Dynatrace is a good choice of data observability platforms, there are a number of reasons why some users seek out alternative solutions. You might be looking for a Dynatrace alternative because…
- You're concerned about high costs
- Your team needs simpler onboarding
- You require better integration options
- You're seeking a more flexible pricing model
- You need support for non-cloud environments
- You're facing geographic availability issues
If any of these sound like you, you’ve come to the right place. My list contains several data observability platforms that are better suited for teams facing these challenges with Dynatrace and looking for alternative solutions.
Features
Here are some of the key features of Dynatrace, to help you contrast and compare what alternative solutions offer:
- OneAgent: Deploys once to collect metrics across the entire application delivery chain, simplifying data gathering.
- PurePath: Provides detailed analysis of timing and code-level context for distributed traces, helping you capture performance data—from the user click to the backend services.
- Scalable Data Ingestion: Supports various data types, such as traces, metrics, logs, and vulnerabilities, ensuring extensive data coverage.
- AI-Powered Insights: Use AI to predict, prevent, and assist in identifying issues, improving your team's efficiency.
- Automated Processes: Simplify discovery, analysis, and daily business operations, reducing manual workload.
- Contextual Analysis: Helps your team understand data connections, driving better decision-making.
- Collaboration Tools: Facilitate teamwork by integrating with various tools and data sources.
- Security Features: Ensure enterprise-grade data privacy and compliance, protecting your organization's information.
- Customizable Dashboards: Allow you to visualize data in a format that suits your team's needs.
- Scalability: Handles vast amounts of data from diverse sources, accommodating growing business demands.
What’s Next:
If you're in the process of researching data observability platforms, connect with a SoftwareSelect advisor for free recommendations.
You fill out a form and have a quick chat where they get into the specifics of your needs. Then you'll get a shortlist of software to review. They'll even support you through the entire buying process, including price negotiations.