10 Best Qualitative Data Analysis Software I Tried In 2026

Best Qualitative Data Analysis Software Shortlist


There are a ton of qualitative data analysis software available, and finding the right one is no small feat. You want a powerful tool to help you dissect customer data and uncover meaningful insights - but need to figure out which one is best. Rest assured, I'm here to guide you. In this post, I make things simple, leveraging my experience evaluating dozens of data analysis platforms to bring you this shortlist of the best qualitative data analysis software.
Why Trust Our Software Reviews
We’ve been testing and reviewing software since 2020. As CX leaders ourselves, we know how critical and difficult it is to make the right decision when selecting software.
We invest in deep research to help our audience make better software purchasing decisions. We’ve tested more than 2,000 tools for different CX use cases and written over 1,000 comprehensive software reviews. Learn how we stay transparent & our software review methodology.
Best Qualitative Data Analysis Software Summary
This comparison chart summarizes basic details about each of my top qualitative data analysis software selections. You can view pricing details and the availability of free trials or demos side-by-side to help you find the best software for your budget and business needs.
| Tool | Best For | Trial Info | Price | ||
|---|---|---|---|---|---|
| 1 | Best for centralized feedback aggregation | Free demo available | Pricing upon request | Website | |
| 2 | Best for AI-driven customer insights | Free demo available | Pricing upon request | Website | |
| 3 | Best for turning unstructured data into actionable insights | Guided trial available upon request | From $2,000/user/month (billed annually) | Website | |
| 4 | Best for understanding customer behavior in real-time | Free demo available | Pricing upon request | Website | |
| 5 | Best end-to-end tool for your entire qualitative research workflow | Free plan available | From $208/user/month (billed annually) | Website | |
| 6 | Best for creating an insights hub to resurface findings | Free trial available | From $30/month | Website | |
| 7 | Best for OpenAI integration | Free demo available | Pricing upon request | Website | |
| 8 | Best for a cross-platform qualitative analysis app | 30-day free trial | From $14.95/user/month | Website | |
| 9 | Best for computer-assisted coding, analysis, and report writing capabilities | Free demo available | From $245/year | Website | |
| 10 | Best for finding rigorous, human insights quickly | 14-day free trial | From $50/user/month | Website |

-

SupportYourApp
Visit WebsiteThis is an aggregated rating for this tool including ratings from Crozdesk users and ratings from other sites.4.7 -
Tidio
Visit WebsiteThis is an aggregated rating for this tool including ratings from Crozdesk users and ratings from other sites.4.7 -
Freshdesk
Visit WebsiteThis is an aggregated rating for this tool including ratings from Crozdesk users and ratings from other sites.4.4


Best Qualitative Data Analysis Software Reviews
In this article, I’m evaluating all the top QDA options available today. For each, I’ll summarize the key features, justify its inclusion, and show you interface screenshots. You’ll also get trial and pricing details, so it’s easy for you to find the best fit for your data analysis requirements.
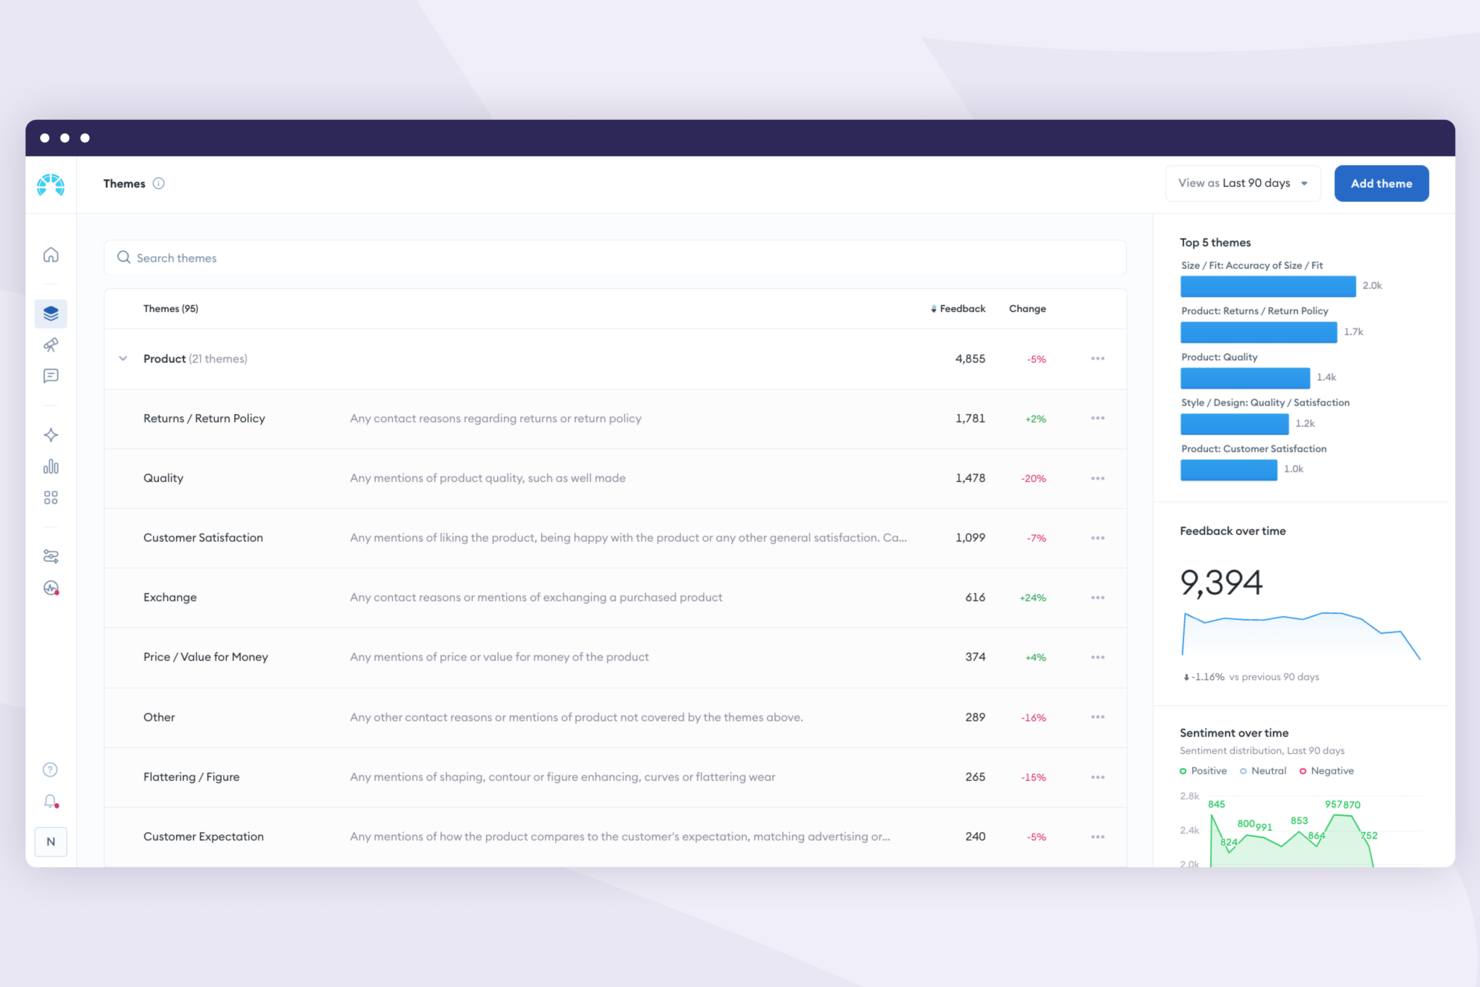
Chattermill is an AI-native customer feedback analytics platform that unifies unstructured feedback from surveys, support tickets, reviews, calls, and social media, then uses AI-driven sentiment analysis and theme detection to reveal qualitative insights.
Who is Chattermill Best For?
Chattermill is a strong fit for mid-market and enterprise CX and insights teams that need to analyze large volumes of customer feedback at scale.
Why I Picked Chattermill
I picked Chattermill as one of the best because its multi-source ingestion stands out. My team can pull in data from Zendesk tickets, Qualtrics surveys, Trustpilot reviews, and call transcripts, then have Chattermill's AI automatically tag and categorize all of it in one place. Every feedback record also gets enriched with context like customer ID, channel, and location, so I'm never looking at raw, decontextualized responses.
Chattermill Key Features
- Granular sentiment scoring: Assigns positive, neutral, or negative sentiment to individual themes within a single piece of feedback, not just the overall response.
- Ask Lyra: A natural language querying interface that lets you type plain-English questions about your feedback data and receive instant analysis.
- Trend alerts: Automated notifications triggered when sentiment scores or feedback volumes shift beyond set thresholds.
- Feedback segmentation: Filters feedback by attributes such as customer segment, product area, or date range to isolate specific qualitative patterns.
Chattermill Integrations
Chattermill offers over 90 integrations spanning surveys, customer support, online reviews, social media, data warehouses, and more. These include Zendesk, SurveyMonkey, Trustpilot, Salesforce, Intercom, Qualtrics, Freshdesk, Hotjar, Snowflake, and Slack. Chattermill also connects with Zapier, and provides an API for custom integrations.
Pros and Cons
Pros:
- Real-time alerts for emerging feedback trends
- AI sentiment analysis in over 100 languages
- Automated theme detection across multiple channels
Cons:
- Editing themes requires help from the Chattermill team
- Monthly feedback credit limits restrict volume

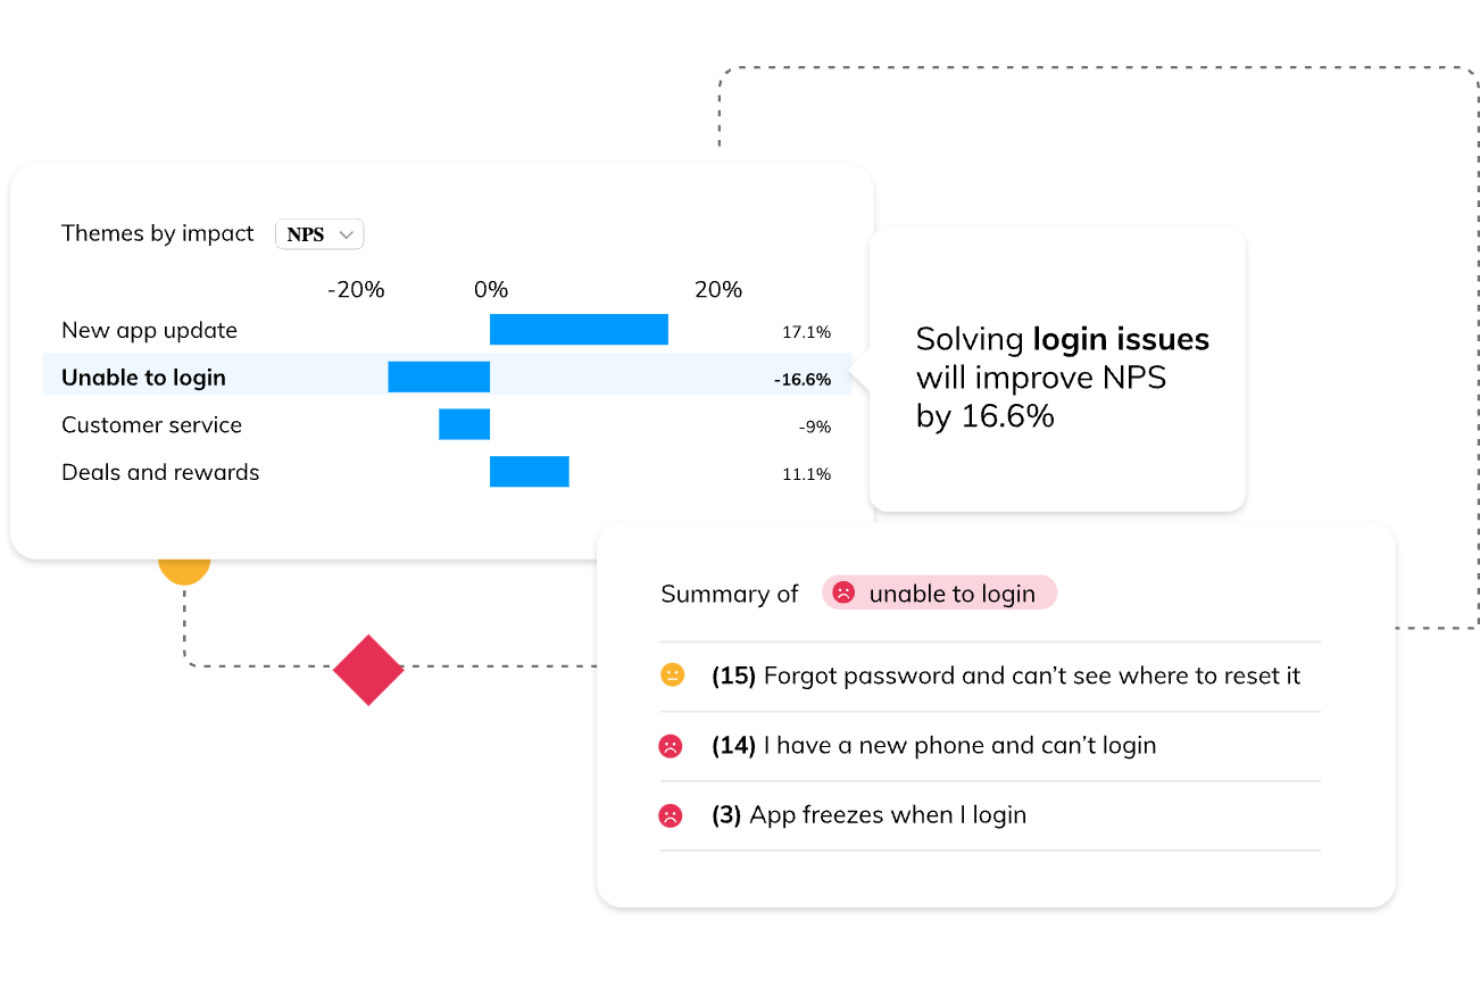
For teams focused on qualitative data analysis, Unwrap helps organize and interpret unstructured feedback at scale. It suits industries from retail to software and supports professionals who need a clearer view of customer needs and product issues. By automating feedback analysis, Unwrap AI reduces manual review and helps teams make more informed, customer-led decisions.
Why I Picked Unwrap AI
I picked Unwrap for its unique ability to automate feedback tagging and provide customizable dashboards, which are pivotal for qualitative data analysis. The platform's natural language query feature lets you extract insights effortlessly, while proactive alerts ensure your team can address issues swiftly. These features make Unwrap AI a compelling choice for organizations aiming to enhance their understanding of customer feedback without the manual labor typically involved.
Unwrap AI Key Features
In addition to automated feedback tagging, Unwrap offers:
- Proactive Alerts: Keeps your team informed of issues as they arise, facilitating timely responses.
- Role-Based Access: Supports different organizational roles, allowing tailored access to insights and ensuring relevant information reaches the right people.
- Security Compliance: Designed with SOC 2 Type II and GDPR standards in mind, providing peace of mind when handling sensitive customer data.
Unwrap AI Integrations
Integrations include BigQuery, CSV Upload, Discord, Facebook Groups, FreshDesk, Github Issues, Hubspot, Intercom, Jira, and Zendesk.
Pros and Cons
Pros:
- Sentiment analysis helps teams quantify how users feel over time
- Provides real-time alerts for quick issue resolution
- Integrates with various customer feedback sources
Cons:
- Effectiveness is reliant on the quality of feedback data
- Feedback taxonomy setup may require extra effort to customize
Thematic uses fast, accurate coding and analytics to transform your unstructured customer feedback into actionable insights that make a real difference in your business.
Why I picked Thematic: This AI-powered text analytics tool is specifically focused on deriving meaningful action plans from raw data. The software can analyze customer feedback from various sources, identify recurring themes, and give insights into sentiment.
The AI capabilities increase the accuracy of theme detection and sentiment analysis. This helps researchers and customer experience managers understand feedback at a granular level. As a result, they can identify where bottlenecks occur and how to eliminate them.
Thematic Standout Features and Integrations:
Standout features of Thematic include a machine-learning algorithm that reveals deep insights from text data, plus trend tracking that identifies patterns surfacing over periods of time. The software also offers feedback prioritization to help you focus on the issues that have the most impact.
Another feature worth highlighting is the interactive dashboard. This presents complex data in a way that’s easy for even non-experts to understand.
Integrations are available with customer feedback and CRM platforms such as Salesforce, SurveyMonkey, and Zendesk. Thematic also works well with visualization tools such as Tableau, for further analysis and visualization of data. This tool also offers API access, making it easier to connect with applications that are not directly supported.
Pros and Cons
Pros:
- Comprehensive trend tracking
- Effective feedback prioritization
- In-depth sentiment analysis
Cons:
- Relies on quality input data
- No real-time data analysis
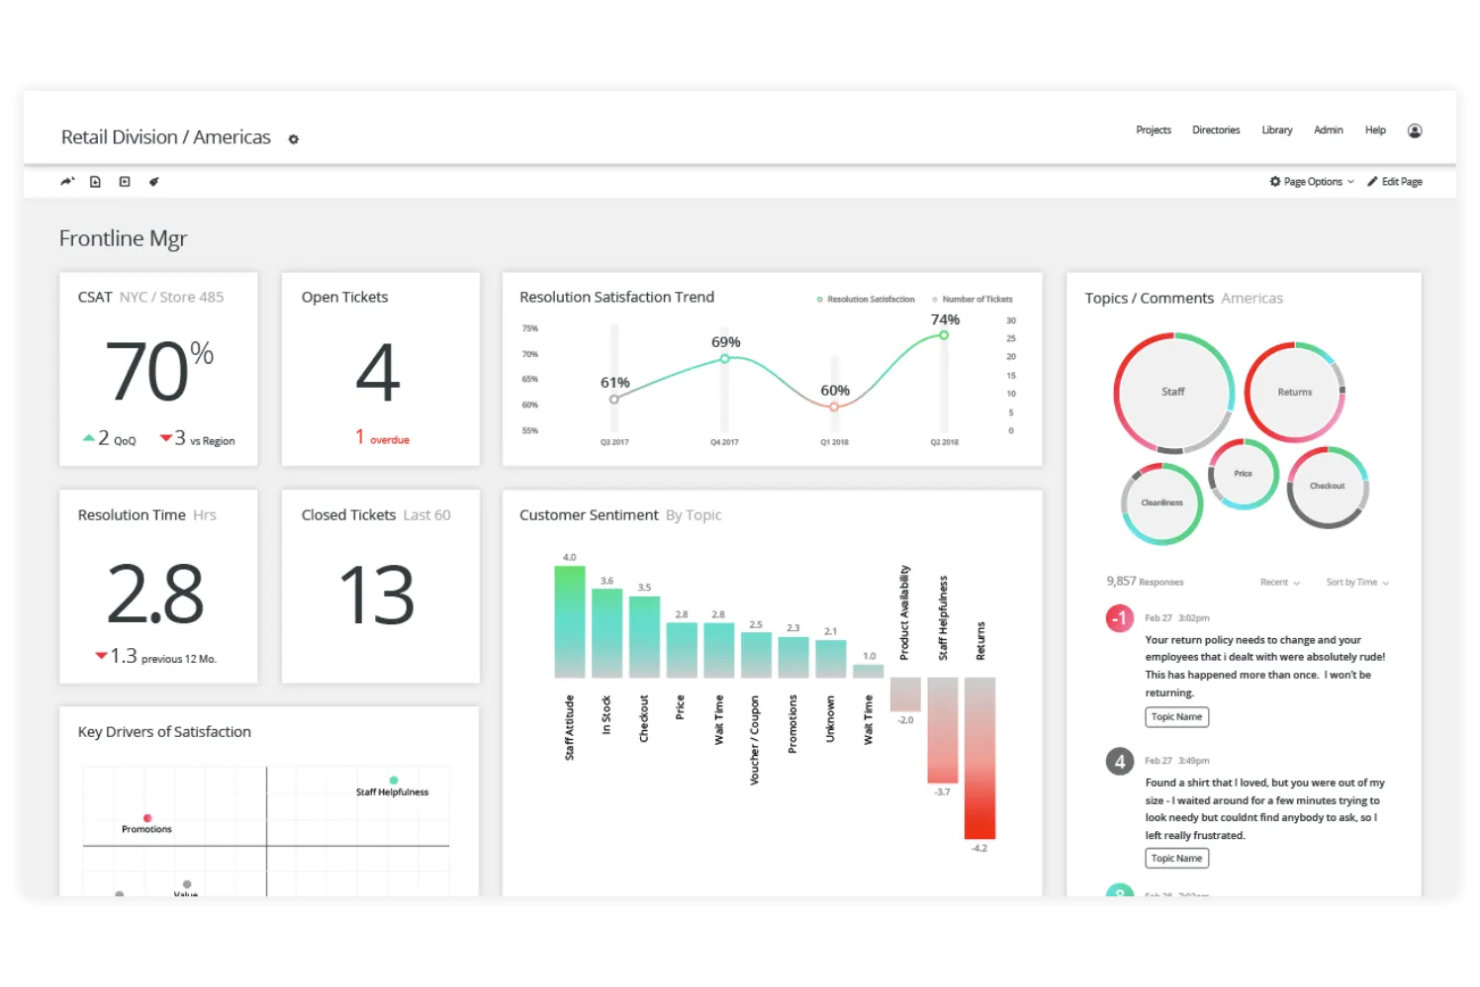
Qualtrics XM uses advanced digital analytics, behavioral heuristics, and session replay to help you understand the user experience. You can analyze broken digital journeys and drop-off points to inform decision-making and create a better user experience.
Why I picked Qualtrics XM: This experience management platform helps you collect, analyze, and act on feedback gathered from multiple touchpoints. You can use it to create and distribute surveys, consolidate data in real-time, and apply advanced analytics to draw meaningful insights.
The software’s predictive intelligence and statistical analysis features encourage a data-driven approach to decision making across the organization.
Qualtrics XM Standout Features and Integrations:
Qualtrics XM’s biggest standout feature is its holistic approach to experience management. This allows users to gather, analyze, and act on data concerning customers, products, employees, or brand experiences.
You can make every session an opportunity to enhance the customer experience, without asking visitors to provide any information. Analysts can watch replays of visitor sessions to uncover the context. This makes it easy to understand the root cause of frustrations, errors, and negative engagement metrics.
Integrations are available with many different platforms to improve workflows and enhance data analysis. These include CRM tools such as Salesforce, communications tools like Slack, and HR platforms like Workday. Qualtrics XM is also compatible with data visualization and business intelligence tools such as Tableau.
Pros and Cons
Pros:
- Predictive intelligence features
- Real-time data collection
- Comprehensive experience management platform
Cons:
- Complex setup for beginners
- Limited qualitative coding features
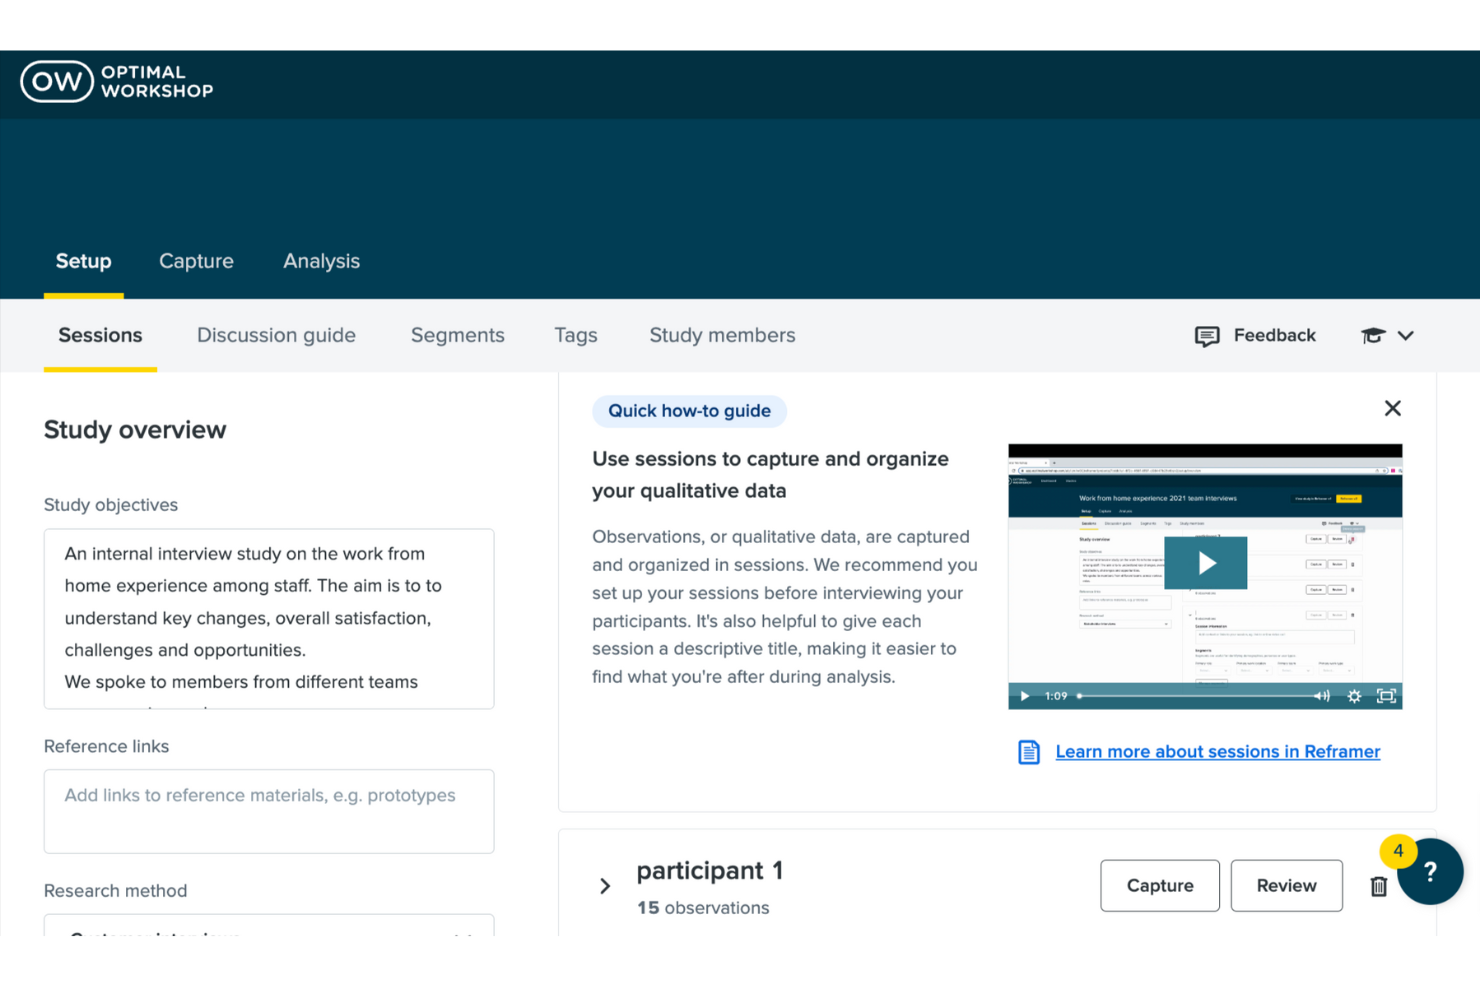
Qualitative research processes can get confusing and overwhelming, which is why Reframer has become a popular tool. This software provides a single app to handle your entire qualitative research workflow, from conducting interviews and capturing observations, through to tagging and visualizing data.
Why I picked Reframer: Reframer is a useful tool for teams or individuals conducting qualitative research. Acting as a centralized platform, it is ideal for managing user interviews and usability testing. The software is also equipped with robust tagging and segmentation capabilities.
Using Reframer, you can visualize group observations, explore connections between tags, and discover patterns within the theme builder. The software also promotes collaborative work by allowing guest notetakers during interview sessions.
Reframer Standout Features and Integrations:
Standout features include the ability to record observations from usability tests and interviews, then tag these for easier analysis. The theme builder helps you group observations based on the tags they contain, so you can identify overarching themes or patterns.
The built-in visualization tools include an affinity map, chord diagrams, and bubble charts. Using these, you can explore connections between tags, and show your observations in a way that’s easy to understand.
Regarding integrations, Reframer offers an .xls export option, allowing the software to be used in conjunction with a variety of data analysis or spreadsheet applications. These include Google Sheets, Excel, and advanced statistical software.
Pros and Cons
Pros:
- Visualizes data via various charts
- Powerful segmentation and tagging
- Comprehensive qualitative research workflow
Cons:
- Theme builder requires tag refinement
- Tagging system may introduce bias

Using Dovetail, you can analyze qualitative data to identify themes and patterns. You can also deploy sophisticated data management and visualization tools to uncover rich insights and report on findings.
Why I picked Dovetail: Dovetail is a proven user research and feedback analysis platform that helps businesses collect and analyze user feedback and research data. The rich text tools enable you to tag, group, and highlight insights from unstructured data. This allows you to turn information such as customer interviews into actionable insights.
Dovetail also facilitates collaboration among team members to speed up the process of obtaining insights from large-size datasets. Together, these features add up to a powerful combination that makes Dovetail a valuable tool for researchers and customer experience professionals alike.
Dovetail Standout Features and Integrations:
Features that make Dovetail especially useful for user research and feedback analysis include a robust text analytics toolset for tagging and grouping insights, a collaborative workspace for team-based research, a repository for storing and organizing all user research data, and interactive data visualization tools for presenting insights. It also supports sentiment analysis and allows for the creation of shareable insights reports.
Dovetail integrates with a variety of commonly used platforms, including Slack for team communication, Zapier for automated workflows, and various customer feedback and user research tools. Additionally, it supports single sign-on (SSO) with providers like Google and Okta for secure and convenient access. It also provides a flexible API for custom integrations to cater to unique business needs.
Pros and Cons
Pros:
- Interactive data visualization tools
- Comprehensive research data repository
- Collaborative workspace for teams
Cons:
- Requires consistent data input
- Limited multimedia data analysis

Atlas.ti is a research software designed to help teams organize, analyze, and interpret qualitative data. It supports projects that involve text, images, audio, video, and even geospatial information. The platform is built for users who need structured ways to uncover insights from large, complex datasets.
Why I picked Atlas.ti: Atlas.ti gives you the ability to work with many data formats in one place, which helps your team handle complex research without switching tools. You can use its coding system to categorize and track recurring themes across your data. The reporting features make it easier to turn findings into presentations or shared outputs. And with its built-in AI support, you can speed up analysis while still keeping full control of your work.
Atlas.ti Standout Features and Integrations:
Standout features include tools to code and annotate data across multiple file types, letting you work with text, media, and geographic sources side by side. The visualization options help you see relationships and connections within your data more clearly. You can also generate reports and summaries that keep your findings structured and easy to share.
Integrations include Microsoft Word, Microsoft Excel, Microsoft PowerPoint, IBM SPSS, Google Docs, OpenAI, NVivo, EndNote, SurveyMonkey, and MAXQDA.
Pros and Cons
Pros:
- Built-in AI support
- Strong visualization options
- Handles many types of media
Cons:
- Updates may shift workflows
- Setup may take time
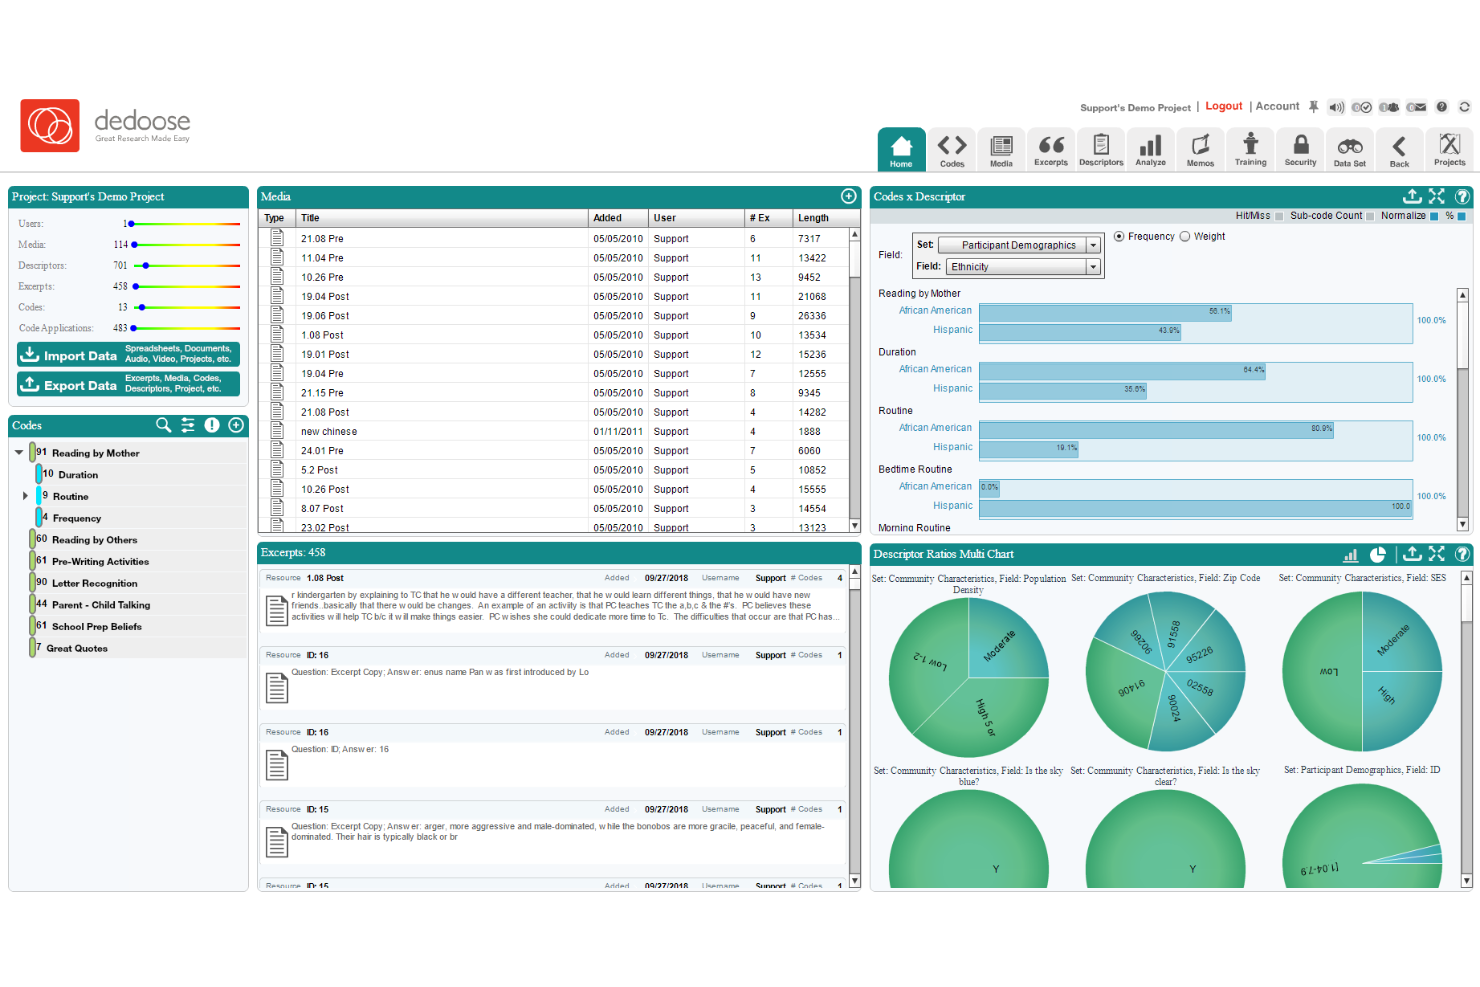
Dedoose is a web-based tool for qualitative and mixed methods research. It facilitates data collection, analysis, and organization. As a result, you can extract meaningful customer insights from data such as textual, visual, and audio sources.
Why I picked Dedoose: This tool offers robust capabilities for analyzing, managing, and presenting data. The feature set includes the ability to organize, transcribe, code, and extract insights from large volumes of unstructured data, such as focus groups, interviews, or surveys.
Dedoose also aids collaboration through its cloud-based design and offers powerful data visualization tools. These aid in understanding complex data platforms and communicating research findings.
Dedoose Standout Features and Integrations:
Dedoose’s biggest standout feature is its web-based approach. This enables researchers to access and work on their projects from anywhere, fostering better collaboration and teamwork.
The software is also notable for its rich set of analysis tools. These include charting, data coding, and data visualization. The exceptional mixed-methods data handling allows you to integrate and analyze qualitative and quantitative data together.
Integration support includes the ability to import data from many different sources, such as spreadsheets, text documents, PDFs, video, and audio files. The software also integrates with popular transcription services to accelerate the processing of audio and video data.
Pros and Cons
Pros:
- Advanced charting capabilities
- Robust data coding tools
- Web-based real-time collaboration
Cons:
- Limited multimedia analysis tools
- Requires stable internet connection
Best for computer-assisted coding, analysis, and report writing capabilities
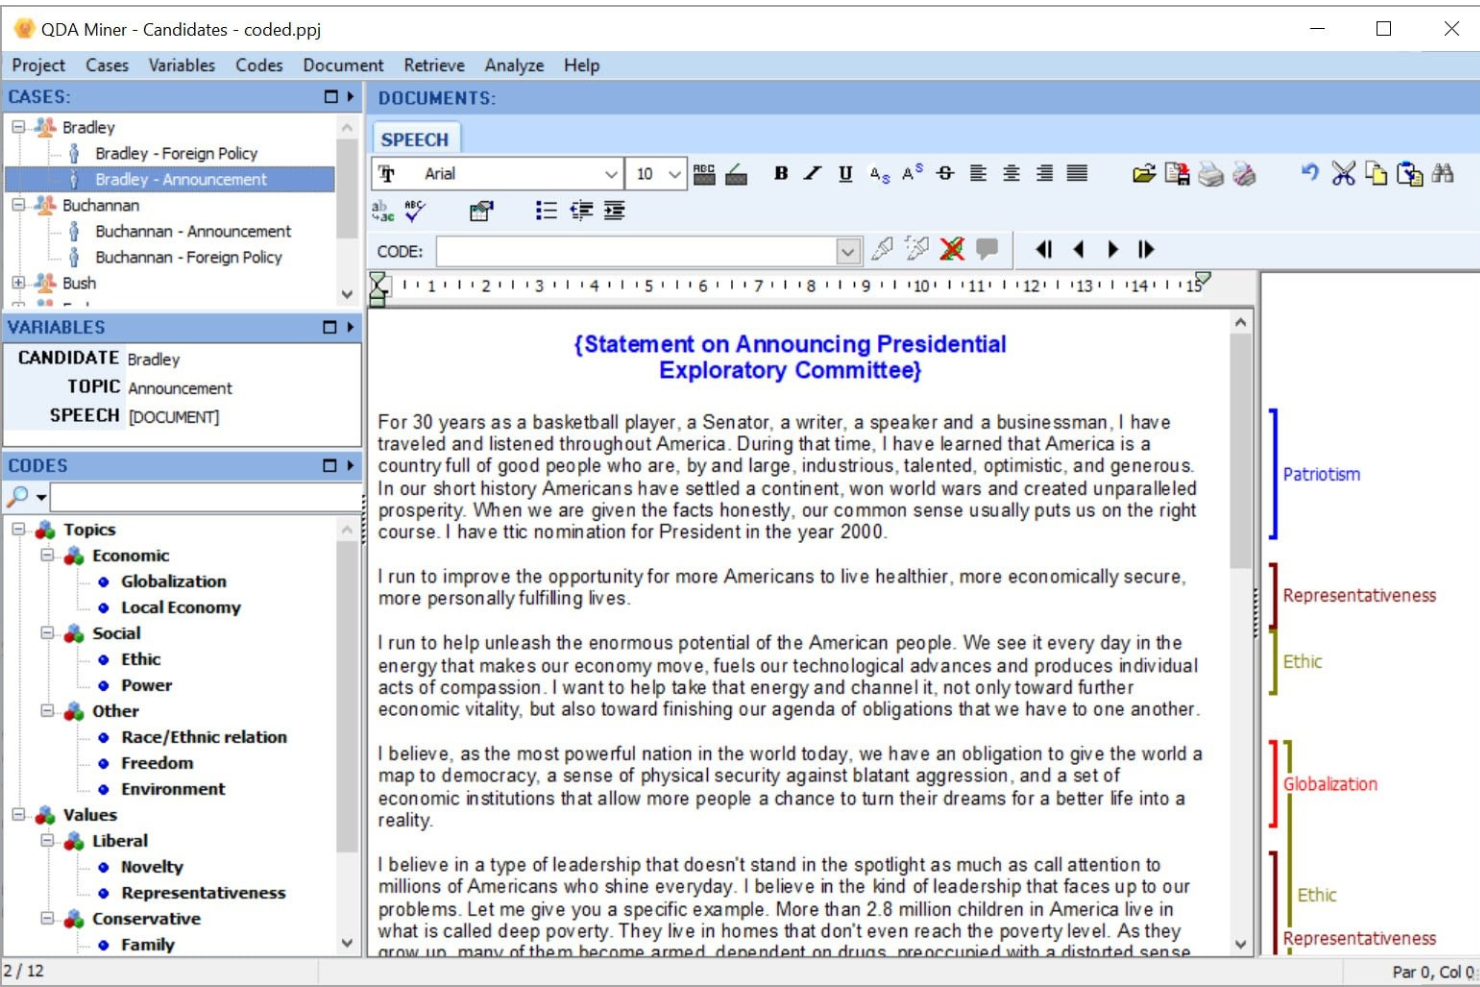
QDA Miner is a popular qualitative data analysis tool for coding, organizing, retrieving, and annotating collections of images and documents. The software is well-suited to analyzing interview or focus group transcripts, journal articles, legal documents, speeches, or books.
Why I picked QDA Miner: QDA Miner allows you to code and analyze documents quickly and reliably. You can import data from Word, Excel, HTML, XML, SPSS, Stata, NVivo, or PDFs. Information can also be gathered from social media, emails, web survey platforms, reference management tools, LexisNexis, and Factiva.
The software also includes report writing functionality for creating comprehensive reports of qualitative and mixed methods data analysis. This feature includes the ability to summarize coded data or visually represent findings with graphs and charts. Findings can be integrated into a written narrative for easy interpretation.
QDA Miner Standout Features and Integrations:
Standout features include a powerful coding system, a robust text analysis suite, and comprehensive data visualization tools. This makes it perfect for data categorization, text mining, and sophisticated analysis.
The software also supports an array of data types and provides innovative features such as geographic information system (GIS) analysis and flexible data modeling.
QDA Miner integrates easily with WordStat, a text mining and content analysis tool, as well as with SlimStat, a statistical analysis tool. As a result, it gives you flexibility to analyze text and relate the content to structured information, including categorical and numerical data.
The software is also compatible with transcription tools for processing audio and video data. In addition, it can work with statistical tools such as SPSS and R, giving a comprehensive approach to data analysis.
Pros and Cons
Pros:
- Accommodates multiple data types
- Flexible data modeling
- Supports GIS analysis
Cons:
- Less efficient coding system
- Limited multimedia analysis tools

Delve is a research platform built to help individuals and teams analyze qualitative data in a structured way. It supports projects where you need to organize, code, and interpret information gathered from interviews, focus groups, and open-ended surveys. The tool is designed for users who want to move from raw data to clear, defensible insights.
Why I picked Delve: Delve gives you a guided approach to coding, which helps you and your team apply consistency across your analysis. Its step-by-step process makes it easier to handle large sets of transcripts without losing track of your themes. You can build a transparent codebook that others can review and follow, keeping your research rigorous. The reporting functions also make it straightforward to show the logic behind your findings.
Delve Standout Features and Integrations:
Standout features include structured codebook creation that lets your team build and refine categories as you work through your data. The transcript analysis tools guide you through coding and comparison in a repeatable way. You can also generate reports that capture how your themes connect back to the original data.
Integrations include Microsoft Word, Microsoft Excel, Google Docs, Google Sheets, Dropbox, OneDrive, Zoom, Slack, Trello, and Asana.
Pros and Cons
Pros:
- Works well with large transcripts
- Transparent codebook system
- Guided coding process
Cons:
- Collaboration features are basic
- Setup can feel manual
Other Qualitative Data Analysis Software
Here are some other contenders that didn’t quite make my list, but may be a great fit for your particular use case:
- HyperRESEARCH
For a flexible, cross-platform tool
- Quirkos
For qualitative text data immersion
- Transana
For automated transcription
- LiGRE
For qualitative data analysis in multiple languages
- Cauliflower
For no-code text analysis via an integrated chatbot
- MAXQDA
For qualitative and mixed methods data analysis
- NVivo
For asking complex questions to identify themes
- Glimpse
For a self-serve human research platform
- Monkey Learn
For no-code text analytics
- Raven’s Eye
For intelligent natural language analysis
- webQDA
For analyzing data in a distributed environment
- Square Feedback
For analyzing private customer feedback


Related CX Software Reviews
If you still haven't found what you're looking for here, check out these related customer experience management tools that we've tested and evaluated.
- Customer Service Software
- Help Desk Software
- Call Center Software
- Customer Messaging Platform
- Digital Experience Platform
- Sentiment Analysis Tools
How I Evaluate Qualitative Data Analysis Software
I evaluate qualitative data analysis tools in two layers: the baseline coding and thematic analysis capabilities a platform must have, and the differentiators that separate one tool from another.
Core Functionality (Table Stakes for This List)
These core capabilities serve as the acceptance criteria for inclusion on my list of qualitative data analysis software:
- Qualitative Data Coding: I evaluate whether a tool supports hierarchical code structures, in-vivo coding, and tagging across multiple media types, not just plain text.
- Multi-Format Data Import: A platform should handle transcripts, PDFs, audio, video, images, and survey responses so researchers aren't forced to convert files externally.
- Thematic Analysis Tools: I look for dedicated theme-building workflows that let you group codes into categories and trace patterns across cases or participant groups.
- Query & Retrieval Features: Beyond basic keyword search, I check for Boolean, matrix, and proximity queries that let you compare coded segments by participant attributes.
- Visualization of Findings: Tools like code maps, concept networks, and hierarchy charts help researchers communicate findings. I evaluate the range and export quality of these visuals.
- Team Collaboration Support: For multi-researcher projects, I look at shared coding access, project merging, and intercoder reliability checks like Cohen's kappa calculations.
I rank each vendor on a scale from 0 (does not offer the functionality) to 5 (excels in this area) for each criterion.
Vendors need to achieve a minimum average score to be considered for inclusion on my list. From there, I consider what sets each platform apart.
Differentiating Factors (What Sets Vendors Apart)
Once I've curated my list, here's how I contrast and compare different vendors in the qualitative data analysis software space:
Standout Features
I pay close attention to platforms that offer built-in AI-assisted analysis and automated transcription, since these features let teams rapidly process large volumes of interviews or focus groups. Mixed methods integration also stands out. For example, when a tool lets you bring in survey results or run basic stats alongside qualitative insights, it helps bridge research worlds. Robust sentiment or emotion analysis can be especially valuable for projects aimed at uncovering tone or mood within open-ended data.
Beyond Features
Data security matters a lot here. Qualitative researchers often work with sensitive participant data that falls under GDPR or IRB requirements, so I check whether a platform offers encryption, anonymization tools, and data residency options. Licensing and pricing models vary widely too, and I also consider methodology fit and look at whether a tool includes templates or workflows tailored to approaches like grounded theory or phenomenology.
How to Choose Qualitative Data Analysis Software
Qualitative data analysis software can systematically organize and analyze large volumes of unstructured customer feedback and extract actionable insights to enhance customer satisfaction and drive business improvements. To help you figure out which qualitative data analysis software best fits your needs, you need to pinpoint your key users and document their specific challenges first.
As you're shortlisting, trialing, and selecting qualitative data analysis software consider the following:
- What problem are you trying to solve - Start by identifying the qualitative data analysis software feature gap you're trying to fill to clarify the features and functionality the qualitative data analysis software needs to provide.
- Who will need to use it - To evaluate cost and requirements, consider who'll be using the software and how many licenses you'll need. You'll need to evaluate if it'll just be the customer success team or the whole organization that requires access. When that's clear, it's worth considering if you're prioritizing ease of use for all, or speed for your qualitative data analysis software power users.
- What other tools it needs to work with - Clarify what tools you're replacing, what tools are staying, and the tools you'll need to integrate with, such as accounting, CRM or HR software. You'll need to decide if the tools will need to integrate together, or alternatively, if you can replace multiple tools with one consolidated qualitative data analysis software.
- What outcomes are important - Consider the result that the software needs to deliver to be considered a success. Consider what capability you want to gain, or what you want to improve, and how you will be measuring success. For example, an outcome could be the ability to get greater visibility into performance. You could compare qualitative data analysis software features until you’re blue in the face but if you aren’t thinking about the outcomes you want to drive, you could be wasting a lot of valuable time.
- How it would work within your organization - Consider the software selection alongside your workflows and delivery methodology. Evaluate what's working well, and the areas that are causing issues that need to be addressed. Remember every business is different — don’t assume that because a tool is popular that it'll work in your organization.
Trends in Qualitative Data Analysis Software
The field of qualitative data analysis (QDA) software is undergoing a period of exciting development. As researchers and professionals grapple with ever-increasing volumes of unstructured data, QDA vendors are innovating to meet the challenges and demands of this evolving landscape. Here's a breakdown of the key trends shaping the QDA software landscape:
Evolving Features
- Enhanced Text Analysis Capabilities: Updates have introduced more sophisticated algorithms for sentiment analysis, topic detection, and emotional intelligence. These improvements cater to the growing demand for deeper, more nuanced understanding of text data, helping users pinpoint subtleties in customer feedback and social media interactions.
- Advanced Data Visualization Tools: There is a noticeable shift towards more dynamic and interactive visualizations. These tools help present complex data sets in more comprehensible ways, aiding in quicker decision-making and presentation to stakeholders who may not be as data-savvy.
- AI-Driven Automation: Automation features powered by AI are increasingly prominent, particularly in data coding and pattern recognition. This trend responds to the need for faster turnaround times in data processing and insight generation, reducing the manual effort required and allowing teams to focus on strategy.
Novel and Unusual Functionality
- Predictive Analytics Integration: Some of the most novel updates involve predictive analytics, which uses historical data to forecast trends and behaviors. This feature is particularly groundbreaking for prospective market analyses and anticipating customer behaviors, adding a forward-looking dimension to traditional qualitative analysis.
- Voice and Video Data Analysis: With the rise of multimedia content, tools that can analyze video and audio data for qualitative insights are becoming more common. This functionality is crucial for comprehensive media analysis, including customer service calls and video reviews, expanding the scope of data sources that can be analyzed.
In-Demand Features
- Collaboration Enhancements: As remote work persists, features that support real-time collaboration and cloud-based data sharing are in high demand. These functionalities ensure that geographically dispersed teams can work efficiently and stay aligned, which is vital for maintaining project continuity and data integrity.
- Scalable Infrastructure: With the increasing volume of data, scalable solutions that can handle large datasets without compromising performance are crucial. Organizations are looking for software that grows with their data needs, ensuring longevity and adaptability of the investment.
Declining Importance
- Local Storage Options: With the shift towards cloud-based environments, the importance of local storage options is diminishing. Organizations prefer cloud storage for its scalability, accessibility, and cost-effectiveness, reducing the reliance on in-house servers and hardware.
Each of these trends highlights a specific area of need within the community of customer success professionals and other users of qualitative data analysis software. By staying abreast of these developments, organizations can better equip their teams with the tools necessary to navigate the complexities of customer data and drive meaningful business outcomes.
What is Qualitative Data Analysis Software?
Qualitative data analysis software (QDAS) is a tool that helps researchers and professionals systematically analyze large volumes of non-numerical or unstructured data, such as text, video, and audio files. This data may be collected through focus groups, interviews, or techniques such as document analysis.
QDAS typically includes features such as data coding, data visualization, data retrieval, linking of data segments, reporting, content analysis, and voice analysis. The goal is to enable researchers to gain a more nuanced understanding of market dynamics and consumer sentiment, driving strategic decisions that align with customer desires and industry trends.
Features of Qualitative Data Analysis Software
Sifting through mountains of text-based data, like interview transcripts or social media posts, can be daunting. Qualitative data analysis software streamlines this process, helping researchers and professionals systematically uncover hidden gems within the data. Here are some key features to consider when choosing the right software:
- Coding and Annotation: Assign meaningful tags or codes to segments of text to categorize and group related ideas. This helps identify patterns and emerging themes across your data.
- Data Import and Organization: Effortlessly import various data formats – interviews, documents, focus groups – and organize them for efficient analysis. This creates a central hub for all your qualitative data.
- Search and Retrieval: Quickly find specific data points using keywords or pre-defined codes. This allows you to revisit relevant sections, identify connections, and refine your analysis.
- Advanced Visualization Tools: Turn complex data into visually compelling charts and graphs. This helps present findings in an easily digestible way for both technical and non-technical audiences.
- Data Security and Privacy: Ensure your sensitive data is protected with robust security measures and user access controls. This is paramount, especially when working with confidential customer information.
- Team Collaboration Features: Work seamlessly with colleagues on the same project, share codes, and discuss interpretations. This is crucial for ensuring intercoder reliability and fostering a collaborative research environment.
- AI-powered Assistance: Leverage artificial intelligence for tasks like sentiment analysis or identifying recurring phrases. This can significantly reduce analysis time and provide a starting point for further exploration.
- Export Capabilities: Easily export analysis results in various formats for further use in reports, presentations, or publications, ensuring research findings reach the intended audience.
- Content & Voice Analysis: Utilize tools like word clouds or sentiment analysis to gain deeper insights from textual data, uncovering underlying patterns and identifying key themes. Also, extract meaning from audio and video files with features like transcription and annotation capabilities (particularly useful for multimedia data sources).
With these features in mind, you can select a qualitative data analysis software that empowers you to transform mountains of customer data into actionable insights. This knowledge can then be used to inform product development, marketing strategies, and overall customer experience improvements.
Benefits of Qualitative Data Analysis Software
Qualitative data analysis software helps researchers and businesses extract rich insights from open-ended responses, interviews, and focus groups. Here are five key benefits that software can offer you:
- Streamlined Analysis: Effortlessly organize, code, and search through vast amounts of textual data. This saves researchers and analysts countless hours compared to manual methods, allowing them to focus on deeper analysis and interpretation.
- Enhanced Collaboration: Work seamlessly with colleagues on projects. Share codes, discuss interpretations, and ensure intercoder reliability – all within a centralized platform. This fosters a collaborative environment and strengthens the overall research process.
- Deeper Customer Insights: Uncover hidden patterns and emerging themes within your data. Software tools like sentiment analysis and word clouds go beyond surface-level understanding, revealing the "why" behind customer behavior.
- Clearer Communication: Transform complex qualitative data into visually compelling charts and reports. This allows researchers to present findings in a way that's easily digestible for both technical and non-technical audiences, ensuring clear communication and impactful presentations.
- Data-Driven Decisions: Gain actionable insights that inform business strategies. By understanding customer needs and motivations, businesses can make data-driven decisions that improve products, services, and ultimately, the customer experience.
Investing in qualitative data analysis software empowers you to transform qualitative data into a strategic asset. This can lead to improved customer experiences, informed product development, and ultimately, business growth.
Costs & Pricing for Qualitative Data Analysis Software
Qualitative data analysis software offers various pricing and plan options, each designed to cater to different research scales and organizational needs. Understanding these plans and what they provide is crucial for choosing a software package that aligns with your organization's research goals and budget. Here's a snapshot of typical plan options you might encounter:
| Plan Type | Average Price | Common Features |
|---|---|---|
| Free | $0 | Basic coding tools, limited data storage, community support |
| Standard | $25 - $50/user/month | Advanced coding, text analysis, basic reporting, email support |
| Professional | $75 - $150/user/month | Full feature access including multimedia analysis, advanced reporting, cloud storage, phone support |
| Enterprise | Custom Pricing | Custom features, integration capabilities, personal account manager, on-site training |
When selecting a plan, consider the volume of data you need to analyze, the complexity of your research projects, and the level of support you anticipate requiring. Keep in mind that the right software should not only meet your current analytical needs but also adapt as your organization grows. Balancing functionality with cost will ensure you receive value from your investment and effectively support your organization’s research objectives.
FAQs about Qualitative Data Analysis Software
Here are answers to the questions I’m most often asked about qualitative data analysis software:
What is qualitative data?
Qualitative data is descriptive, non-numerical information that may be derived from audio, video, text, or images. This customer data is commonly used to provide deeper insights into topics through observed attributes and characteristics. This type of data is often used in fields such as market research and social sciences, where themes and patterns can be identified in collected data. These are then interpreted, to help in understanding concepts, behaviors, experiences, and opinions.
How can analyzing qualitative data help me improve my user experience?
By analyzing qualitative data, you can gain deep insights into the behaviors, pain points, and needs of your customers. You will gain an understanding of what is happening and why this occurred.
You can then leverage this knowledge to guide enhancements to your products and services. This will ultimately lead to a more satisfying customer experience that meets the expectations of your audience.
What is sentiment analysis?
Also known as opinion mining, sentiment analysis uses text analysis, natural language processing, and computational linguistics to understand the emotional tone behind words.
This technique is frequently used in brand monitoring, social media monitoring, and the gathering of customer feedback. Sentiment analysis helps companies understand consumer attitudes and reactions to a specific brand or product.
What other customer analysis software reviews are worth reading?
Here are some more tools I recommend for getting the best out of customer analysis:
Customer Data Analysis Trends for 2023 and Beyond
Turning to customer and user data to inform your product, marketing, sales, and support strategies is essential in 2023. And the drive to dig deeper into both qualitative and quantitative data is only growing stronger. NewVantage Partners’ 2023 Big Data and AI Executive Survey turned to data executives from over 116 companies for insights into their functions and priorities. The results showed that leading into 2023:
- 93.9% of organizations planned to increase their overall investment in data,
- 79.7% of organizations planned to increase their investment in data products,
- 82.0% of organizations planned to increase their investment in data modernization,
- 80.5% of organizations planned to increase their investment in artificial intelligence (AI) and machine learning (ML), and
- 78.7% of organizations planned to increase their investment in data quality.
Clearly, data analytics is a top priority for businesses. Another notable finding from the study was that data modernization was ranked as the primary area of investment by 40.7% of respondents. Qualitative analysis software providers have an important challenge ahead of them: building features and functionalities that support high quality, modern qualitative research and statistical analysis.
And this is confirmed by the 2023-2030 Data Analytics Market Size, Share & Trends Analysis Report by Grand View Research. The report indicates that the global data analytics market size is projected to grow at a compound annual growth rate (CAGR) of 26.7% from 2023 to 2030.
So what does this mean for consumers (that’s you)? More options, more functionalities, and more features to leverage in your customer insights collection and analysis. As qualitative data analysis tools continue to evolve, I’ll be updating this list to reflect those changes! So if you’re not ready to purchase just yet, stay tuned.
What's Next
If you're in the process of researching qualitative data analysis software, connect with a SoftwareSelect advisor for free recommendations.
You fill out a form and have a quick chat where they get into the specifics of your needs. Then you'll get a shortlist of software to review. They'll even support you through the entire buying process, including price negotiations.