10 Best Survey Analysis Software Of 2026: Compared

10 Best Survey Analysis Software Shortlist


The best survey analysis software turns raw responses into insights your team can actually use. These tools organize and clean survey data, surface trends through visualization and text analysis, and help you make data-driven decisions that improve customer experience and strategy.
Drawing on two decades building and scaling tech editorial operations, I’ve reviewed and compared dozens of platforms to separate real value from vendor hype. This guide highlights the top tools for analyzing survey results, plus what to look for when choosing one that fits your organization’s data needs, workflows, and goals.
Why Trust Our Reviews
We’ve been testing and reviewing survey analysis software since 2021. As CX professionals ourselves, we know how critical and difficult it is to make the right decision when selecting software.
We invest in deep research to help our audience make better software purchasing decisions. We’ve tested more than 2,000 tools for different customer experience use cases and written over 1,000 comprehensive software reviews. Learn how we stay transparent & our software review methodology.
The 10 Best Survey Analysis Software Summary
This comparison chart summarizes basic details about each of my top survey analysis software selections. You can view pricing details and the availability of free trials or demos side-by-side to help you find the best software for your budget and business needs.
| Tool | Best For | Trial Info | Price | ||
|---|---|---|---|---|---|
| 1 | Best for multi-channel feedback collection | 14-day free trial + free demo available | Pricing upon request | Website | |
| 2 | Best for AI analysis of open-ended feedback | Free demo available | Pricing upon request | Website | |
| 3 | Best for real-time survey data analysis | Free demo available | Pricing upon request | Website | |
| 4 | Best for omnichannel survey distribution | 14-day free trial | From $19/month (billed annually) | Website | |
| 5 | Best for customer knowledge graph insights | Free demo available | Pricing upon request | Website | |
| 6 | Best for customer journey feedback analysis | 10-day trial | From $56/month | Website | |
| 7 | Best for digging into data to address growth gaps | Free plan available | From $30/user/month (billed annually) | Website | |
| 8 | Best for blending, analyzing, and tracking all your customer feedback in one platform | Guided trial available upon request | From $2,000/user/month (billed annually) | Website | |
| 9 | Best for analyzing both standardized and open-ended questions | 14-day free trial | Pricing upon request | Website | |
| 10 | Best for capturing and analyzing survey data at scale with AI | 14-day free trial + free plan available | From $175/month (billed annually) | Website |
-

SupportYourApp
Visit WebsiteThis is an aggregated rating for this tool including ratings from Crozdesk users and ratings from other sites.4.7 -
Tidio
Visit WebsiteThis is an aggregated rating for this tool including ratings from Crozdesk users and ratings from other sites.4.7 -
Freshdesk
Visit WebsiteThis is an aggregated rating for this tool including ratings from Crozdesk users and ratings from other sites.4.4


Best Survey Analysis Software Reviews
I’ve tested many survey analysis tools hands-on. In this guide, I’ll share my top picks based on intuitive workflows, analytical power, insightful visualizations, and other factors.
If you’re looking to extract deeper insights from customer satisfaction surveys, employee engagement polls, or market research, these solutions may work for you.
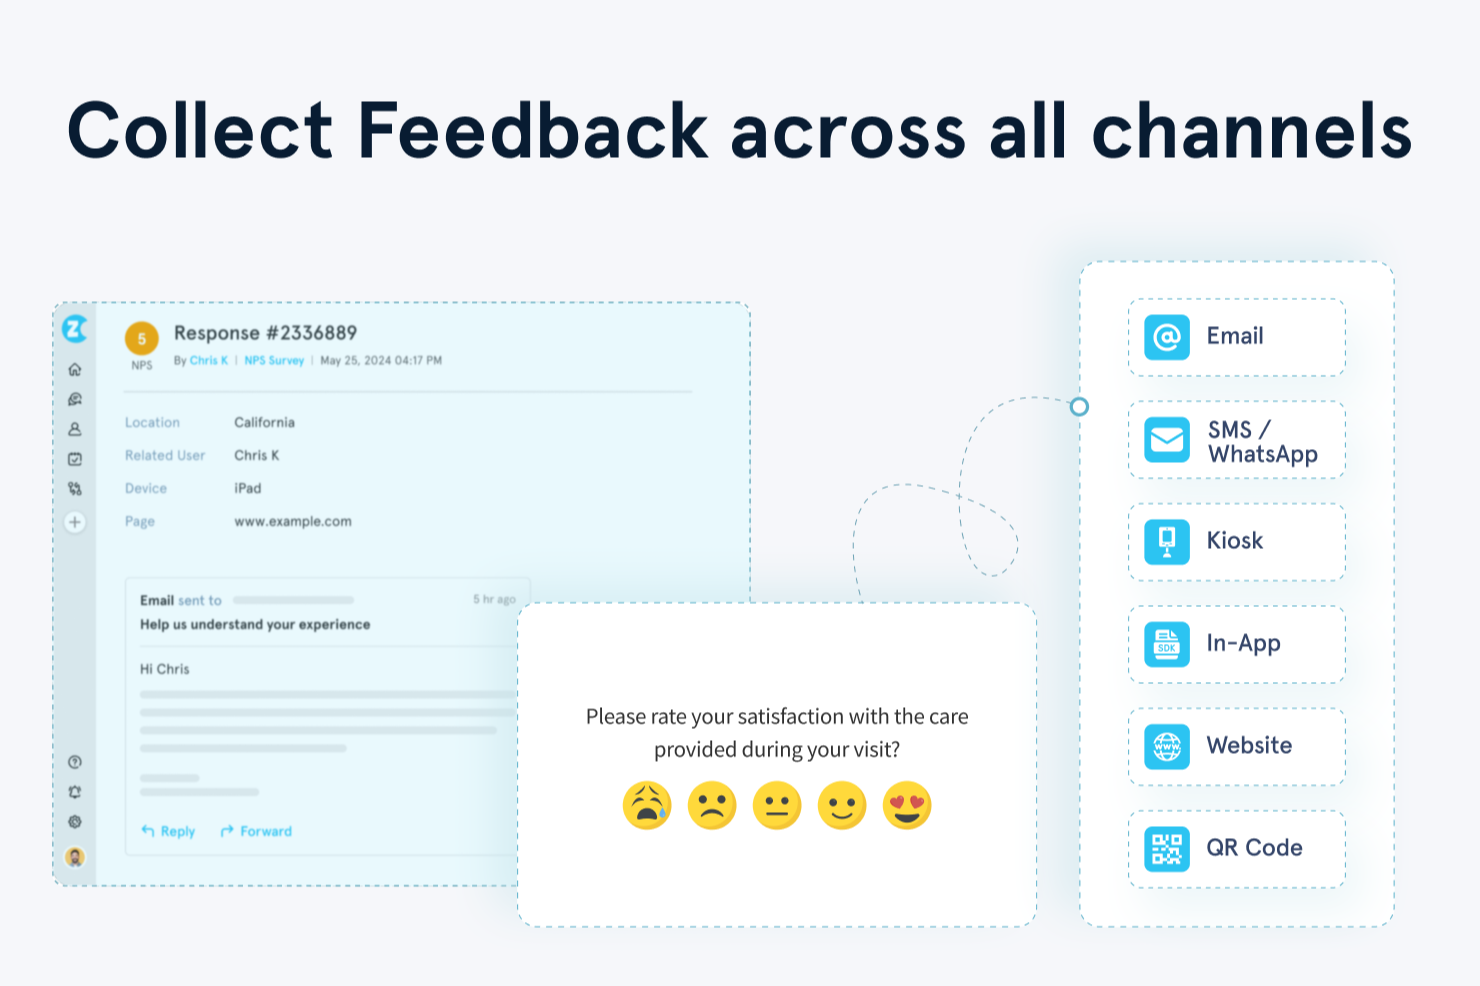
Zonka Feedback is a survey analysis platform that offers multi-channel survey distribution along with AI-powered sentiment analysis, thematic tagging, impact scoring, and real-time reporting dashboards.
Who is Zonka Feedback Best For?
Zonka Feedback works well for CX and customer success teams at mid-sized to enterprise companies that need to collect and analyze feedback across multiple customer touchpoints.
Why I Picked Zonka Feedback
I've included Zonka Feedback in my top picks because it covers more collection channels than most survey tools I've used. You can run surveys across email, SMS, WhatsApp, website, in-product, in-app (iOS, Android, and React Native), live chat, and offline kiosk, all from one platform. I like that offline surveys keep collecting responses without an internet connection and sync as soon as the device reconnects, which is especially useful for retail, healthcare, or event-based teams. The in-app mobile SDK also lets you trigger surveys based on specific app actions, so you're capturing feedback at the exact moment it's most relevant.
Zonka Feedback Key Features
- AI sentiment analysis: Scores responses for emotion, intent, and urgency so you can prioritize follow-up without manual review.
- Thematic analysis: Groups open-text responses into recurring themes using auto-tagging, giving you a structured view of what customers are saying.
- Impact analysis: Links feedback themes directly to NPS, CSAT, and CES scores to show which issues are driving metric changes.
- Real-time reporting dashboards: Displays live response data with drill-down filters by channel, segment, date, or location.
Zonka Feedback Integrations
Zonka Feedback offers native integrations with Salesforce, HubSpot, Zendesk, Freshdesk, Intercom, HelpScout, Front, Pipedrive, Jira, Slack, Microsoft Teams, Google Sheets, Zoom, Mailchimp, ActiveCampaign, and Airtable. It connects with Zapier, Make, Integrately, and provides webhooks and an API for custom integrations.
Pros and Cons
Pros:
- Real-time alerts for negative responses
- Offline and kiosk surveys are included
- AI-driven sentiment and thematic tagging
Cons:
- A/B testing options for surveys are limited
- Response caps on lower-tier plans
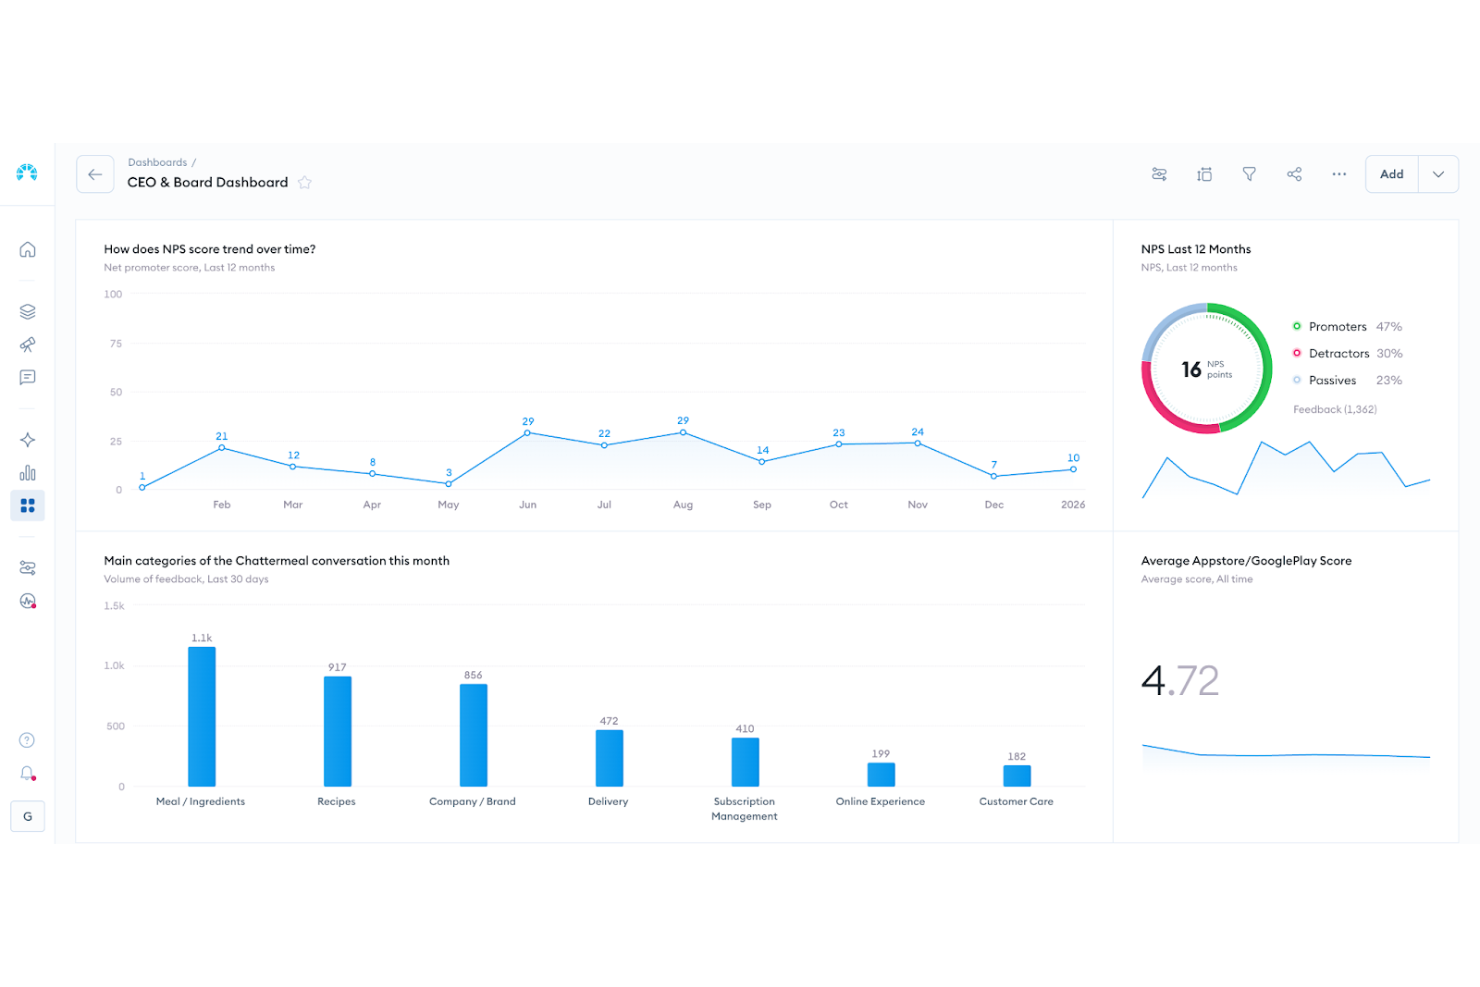
Chattermill provides a robust survey and feedback analytics solution for businesses that want to gain deeper insight into customer sentiment. It is well suited to CX, product, and insights teams that need to bring together feedback from surveys, support tickets, reviews, and other channels into a single, cohesive view. By reducing reliance on manual analysis and eliminating fragmented data sources, Chattermill helps you uncover meaningful trends, prioritize improvements, and make more informed decisions that strengthen service delivery and overall customer experience.
Why I Picked Chattermill
I picked Chattermill for its unique ability to analyze open-ended customer feedback using advanced AI and natural language processing. This feature is crucial for teams needing real-time insights into themes and sentiment shifts across multiple languages. Additionally, Chattermill's customizable dashboards and automated theme discovery make it easier for users to gain structured insights from qualitative feedback, a vital aspect for survey analysis software users seeking comprehensive understanding without manual effort.
Chattermill Key Features
In addition to its AI-driven insights, Chattermill provides several features that enhance its utility for survey analysis:
- Customer Feedback Analytics: This feature allows you to gather and analyze feedback from multiple sources, providing a comprehensive view of customer sentiments.
- Product Experience Analytics: You can assess how customers interact with your products, identifying areas for improvement and innovation.
- Support Data Analytics: By analyzing support interactions, you can uncover patterns and insights to enhance customer support services.
- AI-Driven Insights: Chattermill's AI capabilities help you connect customer feedback directly to business goals, facilitating informed decision-making.
Chattermill Integrations
Integrations include Slack, Jira, Notion, HubSpot, Salesforce, Zendesk, Intercom, SurveyMonkey, Typeform, and Google Sheets.
Pros and Cons
Pros:
- Industry specific sentiment models
- AI powered theme tagging
- Real time sentiment tracking
Cons:
- May require enterprise onboarding
- Pricing not publicly available

Sogolytics is a powerful survey analysis software designed to help organizations gather and analyze feedback efficiently.
Why I picked Sogolytics: Users can create dynamic surveys with features such as branching logic, piping, and skip logic to ensure that respondents only see relevant questions. Sogolytics also provides real-time data analysis and reporting, enabling users to spot trends and patterns quickly. The software’s cross-tab analysis and conditional formatting features allow for deeper insights, making it easier to interpret complex data sets and understand what participants truly mean.
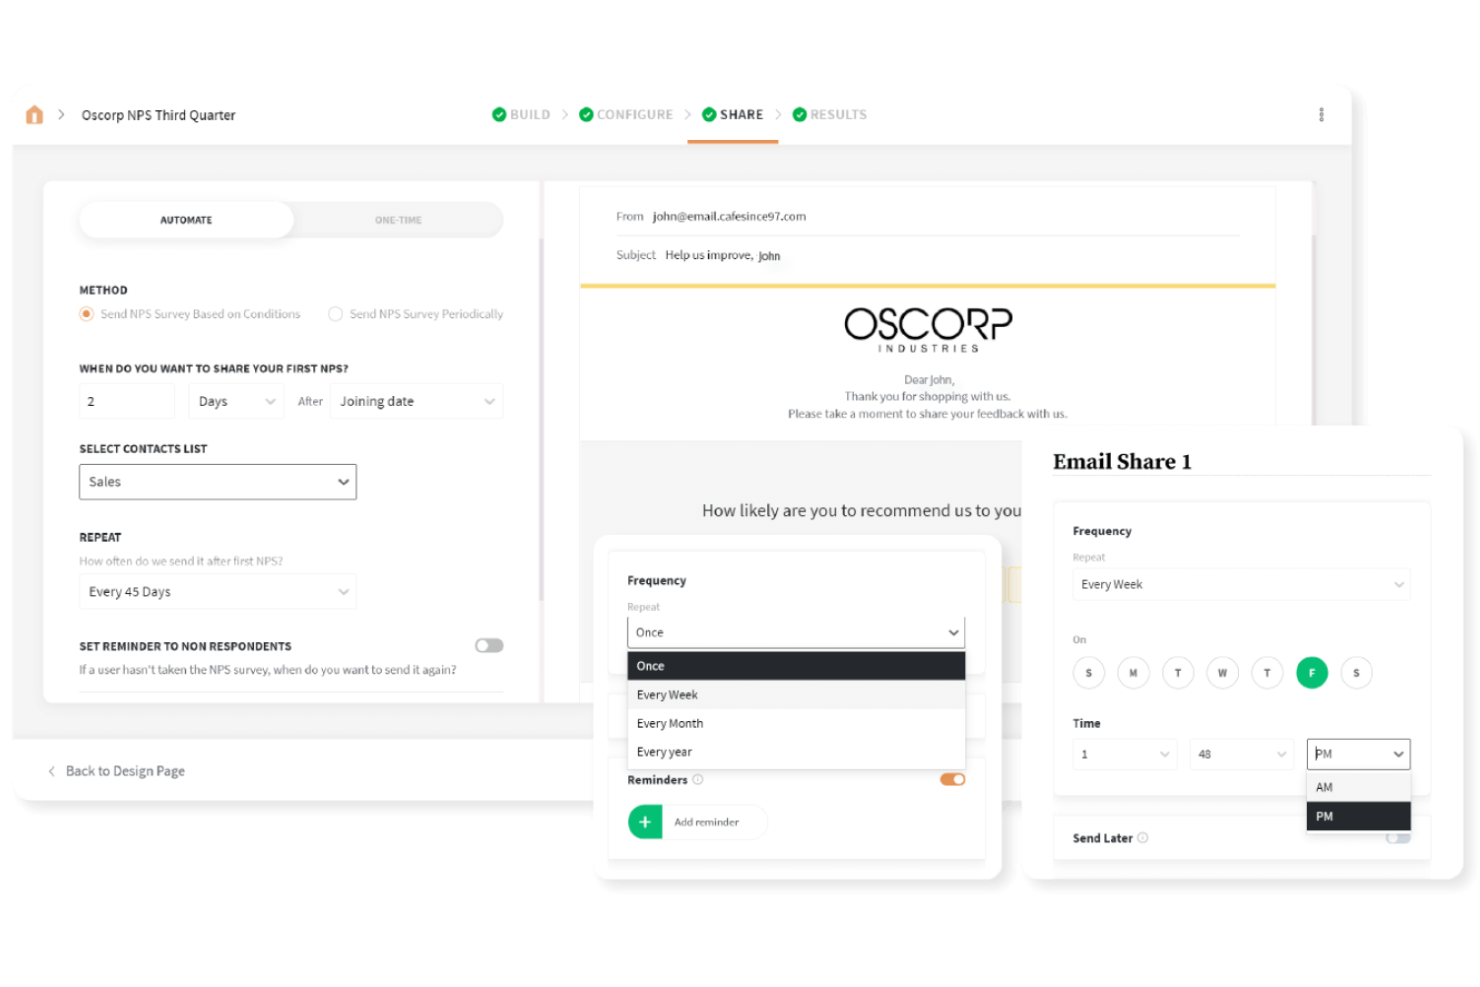
The platform includes automated reminders, personalized survey invitations, and multiple distribution channels, ensuring that surveys reach respondents on their preferred platforms. Additionally, Sogolytics supports anonymous surveys and auto-save responses, which helps in reducing survey abandonment and improving data quality.
Sogolytics Standout Features and Integrations:
Standout features include customizable survey themes, numerous question types, advanced branching logic, real-time response tracking, cross-tab analysis, conditional formatting, response trend reports, live reports, survey templates, and multi-channel distribution options.
Integrations include Salesforce, Microsoft Dynamics, HubSpot, Google Analytics, Slack, Mailchimp, Zendesk, and Zapier.
Pros and Cons
Pros:
- Multi-channel distribution
- Variety of question types available
- Extensive customization options for survey designing
Cons:
- Free version may be too basic for some users
- Does not support direct creation of questionnaires in non-English languages
New Product Updates from Sogolytics

Sogolytics Launches AI-Powered Experience Navigator
Sogolytics introduces Experience Navigator, an AI-powered tool for building strategy and action plans. This update helps teams turn goals into tailored execution plans with relevant metrics and projects in minutes. For more information, visit Sogolytics’ official site.
 .
.
SurveySparrow is an online platform that can be used to create and distribute surveys, collect responses, and analyze the data.
Why I picked SurveySparrow: This software allows you to distribute your surveys across various channels like weblinks, in-app embedding, email, SMS, and QR codes. And when your respondents receive the survey, it's presented like a chat to keep it engaging and quick to fill out. This can help improve response rates and get you more data on your audience.
You can also pose open-ended questions, providing more qualitative data in addition to quantitative insights. You can dig deeper into your audience's perspective and give them a voice. Data can be segmented based on lots of different factors for more detailed analysis.
SurveySparrow Standout Features and Integrations:
Standout features include recurring surveys, which allow you to measure the same metrics over time. Other helpful features are the chat-like interface, a variety of question types, and plenty of reporting capabilities.
Integrations include MailChimp, HubSpot, Intercom, Salesforce, Zapier, Google Sheets, Google Analytics, Facebook Pixel, and many other systems.
Pros and Cons
Pros:
- Supports multiple languages
- Helpful automations available
- Mobile-first, friendly end user experience
Cons:
- Comes with a learning curve
- Limited customization on templates

Enterpret is an AI-driven survey analysis software built to help teams better understand customer feedback, supported by customer knowledge graph insights that add helpful context. It brings together survey data and other sources of feedback to give product and CX teams a clearer view of customer sentiment. By automating analysis and surfacing insights faster, Enterpret helps organizations respond more effectively to customer needs.
Why I Picked Enterpret
I picked Enterpret as a top choice for survey analysis software because of its AI-driven approach to consolidating and analyzing customer feedback. Its adaptive taxonomy feature allows your team to organize insights effectively, transforming unstructured data into structured, actionable intelligence. Additionally, the natural language querying feature provides instant insights, enabling you to interact with data in a user-friendly way without technical expertise. These capabilities are crucial for organizations looking to enhance product management and customer experience by understanding customer feedback comprehensively.
Enterpret Key Features
In addition to customer knowledge graph insights, Enterpret offers:
- Dynamic Dashboards: Provides visualizations of insights, making it easier for your team to comprehend and act on the data.
- Automated Workflows: Streamlines the process of addressing customer feedback by automating resolution actions, improving efficiency.
- Sentiment Detection: Tracks positive, neutral, and negative feedback over time.
- Alerting & Notifications: Flags spikes in complaints or emerging issues quickly.
Enterpret Integrations
Integrations include Zendesk, Salesforce, Intercom, Slack, HubSpot, Jira, Freshdesk, Gainsight, Segment, and Mixpanel.
Pros and Cons
Pros:
- Organizes unstructured feedback automatically
- Identifies trends and emerging issues quickly
- Provides strong context through knowledge graphs
Cons:
- Insights depend on data quality and volume
- Requires setup time to tune taxonomy

Survicate's survey software is designed to analyze customer feedback across multiple channels, including email surveys, web forms, and in-app feedback widgets.
Why I picked Survicate: I selected Survicate as a sentiment analysis tool because it offers comprehensive feedback collection across various channels, which is crucial for understanding customer sentiment in today's multi-platform environment. Once your customer data is in, you can use Survicate to analyze the sentiment within the responses and track changes over time.
In their Results tab, you can analyze the sentiment of your customer feedback into each category (Very Happy, Happy, Neutral, Unhappy, and Very Unhappy), and visualize the data over different periods, including daily, weekly, monthly, quarterly, or yearly.
Survicate Standout Features and Integrations:
Features include AB testing to compare survey versions, anonymous feedback collection for more honest responses, and precise audience targeting to ensure feedback is obtained from the desired customer segment. Survicate also offers advanced survey logic which allows users to create dynamic surveys that are tailored to previous responses.
Integrations are available with a range of widely-used business and marketing tools, including ActiveCampaign, Amplitude, Drip, Intercom, Salesforce, HubSpot, Mailchimp, Klaviyo, Google Analytics, Mixpanel, Optimizely, Slack, Zendesk, and many others. They also offer webhooks and an API for additional custom integrations too.
Pros and Cons
Pros:
- Can collect in-app NPS and CSAT scores
- Advanced targeting and segmentation options
- Real-time feedback collection
Cons:
- Limited options for multilingual surveys
- Implementation process can be complicated
New Product Updates from Survicate

Survicate Adds RudderStack Integration for Survey Targeting
Survicate now lets you launch surveys using RudderStack data, making it easier to target specific user groups defined in RudderStack and learn more about them. For more information, visit Survicate's official site.
 .
.
SurveyMonkey is an online survey platform that makes it easy for anyone to create and distribute surveys. You can then analyze the results through an intuitive drag-and-drop builder with pre-made expert templates.
With its simple interface and flexible pricing plans, SurveyMonkey is suitable for solopreneurs, smaller businesses, and large enterprises. This is why I think it's one of the best survey tools available today. This tool excels at deep dives into data, which allow you to identify, analyze, and address growth gaps
Why I picked SurveyMonkey: SurveyMonkey offers skip logic, pre-made question types, and branching. You can create customized surveys easily, with no technical skills required.
SurveyMonkey includes collection methods like email, web link, social media, and QR code, and includes partial response tracking. You can generate standard reports on response data as well as export results to Excel for further analysis.
An advantage of SurveyMonkey is that it has a large global reach, with the platform available in over 20 languages. This makes it easy to reach your target audience. There is also 24/7 customer support and tons of help resources like guides, videos, and webinars for onboarding users smoothly. SurveyMonkey is an estabished company trusted by over 345,000 businesses worldwide.
SurveyMonkey Standout Features and Integrations:
Standout features that make SurveyMonkey a leading online survey tool include its customizable design themes, user-friendly drag-and-drop builder, skip logic, and branching. You also get logic and data filters, standard crosstab, text analysis, and benchmark reports. SurveyMonkey provides team collaboration features and CX tools like CSAT and NPS surveys.
Integrations are offered with CRM, marketing, and business intelligence platforms like HubSpot, Marketo, Microsoft Power BI, and Salesforce, connecting survey data insights across programs. SurveyMonkey also integrates with apps like Eventbrite, Mailchimp, Slack, and Zapier for extended workflows.
Pros and Cons
Pros:
- Free survey templates are available
- Includes skip logic, branching and advanced data filters
- Customizable design themes
Cons:
- Lack of data validation tools
- Data capacity limits on lower tiers
Thematic
Best for blending, analyzing, and tracking all your customer feedback in one platform

Thematic handles much of the hard work of survey analysis on autopilot. Using smart automation, this analysis tool delivers actionable insights, making it easy to track, blend, and analyze customer feedback in one platform.
Why I picked Thematic: Thematic combines a range of technologies to surface insights from all kinds of open-ended data. Researchers can analyze responses, then draw insightful conclusions, all thanks to Thematic's unique approach. The system delivers unprecedented depth, drawing on features like auto-coding, statistical insights, and sentiment analysis.
Thematic Standout Features and Integrations:
Standout features included with this software include predictive coding and contextual analysis. You also get comparison tagging to faciliate granular text analysis and theme identification. Extensive language support opens up a range of new opportunities.
Integrations include survey tools like Qualtrics, facilitating direct data imports for immediate analysis. You also get dashboards to optimize visibility, collaboration features, and API access to improve sharing across your organization.
Thematic also connects easily with visualization tools like Looker and Tableau. This allows you to produce complex data visualizations, leveraging Thematic's text analysis capabilities.
Pros and Cons
Pros:
- Support for project templates
- Natural workflow and guidance
- Top-notch qualitative analysis
Cons:
- High prices for sophisticated capabilities
- Limited analysis features

MAXQDA deploys professional-grade analysis tools to transform your data into tangible findings, bringing research to life. As a result, MAXQDA is a great application for analyzing both open-ended and standardized questions.
Why I picked MAXQDA: This tool has the advantage of combining raw power with granular flexibility. It supports comprehensive mixed methods research but is also able to handle multi-dimensional investigations.
The huge feature set and customization options allow you to explore data any way you wish. MAXQDA is ideal for mixed methods studies, helping you develop multi-dimensional understanding. Its analytical engine and customization flexibility are best-of-breed.
MAXQDA Standout Features and Integrations:
Standout features include focus group controls, statistical analysis, geo-mapping, and advanced coding that drives insight extraction. You can tailor everything to uncover any insights needed to inform decisions.
Integrations are available with tools for surveys, interviews, audio, video, and images. These provide unlimited flexibility, while collaboration features promote better teamwork. The analysis, visualization, and reporting tools integrate readily with various applications. These include statistical tools like SPSS Statistics, data visualization tools like Tableau, and transcription services like Trint.
Pros and Cons
Pros:
- Perfect for mixed methods research
- Excellent analysis and visualization capabilities
- High degree of flexibility and customization
Cons:
- High costs for advanced features
- Not suited to basic research needs

Sprig is a product experience platform designed to help CX teams capture, analyze, and act on customer feedback. By integrating advanced AI into tools like in-product surveys, feedback widgets, heatmaps, and session replays, Sprig provides a comprehensive platform to collect and analyze in-the-moment insights directly from users. This real-time feedback loop helps identify customer pain points, preferences, and behavior patterns, providing actionable insights and driving data-backed optimizations to the customer experience.
Why I picked Sprig: Sprig helps your team analyze customer feedback using AI to highlight the most important trends and takeaways. The tool’s AI-driven survey analysis allows you to quickly understand what’s working and what needs attention. You’ll receive clear, actionable suggestions based on real-time feedback from your users.
The software's AI makes it seamless to analyze high volumes of customer feedback and prioritize the improvements that will have the biggest impact. The ability to turn raw survey data into meaningful insights at scale helps your team make better decisions faster.
Sprig Standout Features and Integrations:
Features include AI-powered survey analysis, real-time feedback collection, heatmaps, session replays, and automated reporting. Your team can quickly understand user feedback and act on key insights. The tool also helps prioritize feedback for easier decision-making.
Integrations include Mixpanel, Amplitude, Jira, Slack, Segment, Google Analytics, and Optimizely.
Pros and Cons
Pros:
- Automatically prioritizes feedback
- Real-time survey analysis
- Simplifies feedback analysis workflows
Cons:
- Learning curve for advanced features
- Requires technical setup
Other Survey Analysis Software
Here are some other survey analysis tools that didn’t make my shortlist, but which may be a good fit for your specific needs.
- SentiSum
For automating the analysis of CSAT survey results
- Dovetail
For uncovering insights across all kinds of customer touch-points
- Snap XMP
For turning survey data into word clouds
- MonkeyLearn
For identifying patterns and trends beyond survey responses
- Displayr
For all-in-one analysis, purpose-built for survey data
- Crunch.io
For analyzing current and historical data from multiple survey sources
- KnowledgeHound
For valuable, data-backed answers from customer data in seconds
- Q Research Software
For quick and easy survey reporting
- Cauliflower
For AI-powered survey analysis
- Jotform
For various visualization options


Related CX Software Reviews
If you still haven't found what you're looking for here, check out these related customer experience management tools that we've tested and evaluated.
- Customer Service Software
- Help Desk Software
- Call Center Software
- Customer Messaging Platform
- Digital Experience Platform
- Sentiment Analysis Tools
Selection Criteria for Survey Analysis Software
Survey analysis software is crucial for optimizing data gathering, analysis, and reporting, enabling businesses to make informed decisions based on customer feedback. Having personally tried and researched a variety of survey analysis tools, I have established a clear set of criteria to evaluate these platforms, ensuring they meet the essential needs of users in this sophisticated field.
Core Survey Analysis Software Functionality - 25% of total weighting score Common features for survey analysis software typically include data importation, organization, cleaning, statistical testing, and visual representation capabilities like charts and graphs. These elements are critical for any robust survey tool.
To be considered for inclusion on my list of the best survey analysis software, the solution had to support the ability to fulfill common use cases:
- Efficiently import and organize survey data from diverse sources.
- Process and clean data to ensure accuracy and usability.
- Perform essential statistical tests.
- Produce a variety of visual data presentations to clarify insights.
- Real-time data processing for up-to-the-minute analytics.
Additional Standout Features - 25% of total weighting score
- Advanced Sentiment Analysis: Tools that utilize natural language processing to parse and understand open-ended responses, identifying sentiments and thematic elements.
- Predictive Analytics: Employing machine learning models to forecast trends and user behavior based on historical data.
- Integration with BI Tools: Seamless connectivity with platforms like Microsoft Power BI and Tableau for enhanced data sharing and visualization.
Usability - 10% of total weighting score
- I prioritize software that combines sophisticated analysis capabilities with user-friendly interfaces.
- The design must allow users to navigate easily between different analytics, reporting, and data visualization tools without extensive training.
- All key functions should be accessible from a well-organized dashboard.
Onboarding - 10% of total weighting score
- The presence of comprehensive training materials such as videos, templates, and interactive tours is essential for smooth user onboarding.
- I evaluate how quickly a new user can begin extracting value from the software, ensuring minimal downtime and frustration.
Customer Support - 10% of total weighting score
- I assess the responsiveness and effectiveness of the support team, looking for multi-channel support including live chat, email, and phone.
- Availability of a detailed knowledge base and regular software updates are critical for ongoing user support and satisfaction.
Value For Money - 10% of total weighting score
- I consider the pricing structure, ensuring it provides various tiers to suit different user needs and budgets.
- The software should offer clear benefits and ROI at each pricing level, from basic to enterprise solutions.
Customer Reviews - 10% of total weighting score
- Positive customer feedback is crucial, particularly concerning the software's reliability, ease of use, and the quality of support offered.
- I look for reviews that highlight the software’s impact on enhancing business operations and decision-making.
By carefully examining these criteria, I ensure that the survey analysis software recommended can effectively meet the specific needs and pain points of users, allowing them to gain actionable insights from their survey data efficiently. This thorough approach helps identify tools that are not only capable but also provide exceptional value and user experience.
How to Choose Survey Analysis Software
Choosing the right survey analysis software can make gathering and organizing data easier, help you find important trends and insights quickly, and save you time and money on survey projects.
As you're shortlisting, trialing, and selecting customer segmentation tools consider the following:
- What problem are you trying to solve - Start by identifying the survey analysis feature gap you're trying to fill to clarify the features and functionality the survey analysis software needs to provide.
- Who will need to use it - To evaluate cost and requirements, consider who'll be using the software and how many licenses you'll need. You'll need to evaluate if it'll just be the CX team or the whole organization that requires access. When that's clear, it's worth considering if you're prioritizing ease of use for all, or speed for your survey analysis software power users.
- What other tools it needs to work with - Clarify what tools you're replacing, what tools are staying, and the tools you'll need to integrate with, such as accounting, CRM or HR software. You'll need to decide if the tools will need to integrate together, or alternatively, if you can replace multiple tools with one consolidated survey analysis software.
- What outcomes are important - Consider the result that the software needs to deliver to be considered a success. Consider what capability you want to gain, or what you want to improve, and how you will be measuring success. For example, an outcome could be the ability to get greater visibility into performance. You could compare survey analysis software features until you’re blue in the face but if you aren’t thinking about the outcomes you want to drive, you could be wasting a lot of valuable time.
- How it would work within your organization - Consider the software selection alongside your workflows and delivery methodology. Evaluate what's working well, and the areas that are causing issues that need to be addressed. Remember every business is different — don’t assume that because a tool is popular that it'll work in your organization.
Trends in Survey Analysis Software
As we look into the trends in survey analysis software, several emerging developments are evident, focusing on enhancing researchers' ability to gather and analyze data effectively. Here's a breakdown of these trends based on the latest product updates and industry insights:
- Generative AI and Large Language Models (LLMs): These technologies are becoming increasingly popular for automating and enhancing data analysis and report generation. By using LLMs, survey analysis software can provide more nuanced insights and generate detailed reports without manual intervention, significantly reducing the time researchers spend on data processing.
- Advanced AI Capabilities for Personalized Experiences: There's a growing trend towards leveraging AI to create more personalized and interactive survey experiences. This can increase engagement rates and the quality of data collected, as more tailored questions are likely to elicit more accurate responses from participants.
- Integration with Digital Marketplaces: As digital marketplaces become more specialized, there's an emerging trend for survey analysis tools to be integrated directly into these platforms. This allows for easier access and use by a broader audience, potentially increasing the tool's adoption and data collection scalability.
- Emphasis on AI Safety and Ethics: With the rapid advancement in AI, there's an increased focus on incorporating safety, transparency, and ethical considerations into survey analysis software. Features that ensure data privacy, secure AI practices, and compliance with regulations are becoming critical.
- Demand for Real-Time Data Processing: The ability to process and analyze data in real-time is a highly sought-after feature in survey analysis software. This allows organizations to react quickly to feedback and make timely decisions based on the latest data.
- Increased Focus on Sustainability: Software providers are also emphasizing tools that help organizations measure and manage their environmental and social governance (ESG) impact through surveys and data analysis, aligning with broader corporate sustainability goals.
These trends reflect a dynamic shift in how survey data is collected, analyzed, and utilized, emphasizing efficiency, real-time insights, and scalability. As organizations continue to demand deeper insights and more efficient data handling, these features are guiding the development of next-generation survey analysis software, setting the stage for more innovative and integrated solutions in the research field.
What is Survey Analysis Software?
Survey analysis software helps organizations collect, organize, and interpret survey data to uncover trends, patterns, and insights. These tools combine statistical analysis, data visualization, and text analytics to transform raw responses into actionable intelligence—supporting data-driven decisions that improve products, services, and customer experience.
Features of Survey Analysis Software
Choosing the right survey analysis software is essential for researchers like me who need to sift through vast amounts of data to find meaningful insights. A good software solution not only collects data but also helps interpret it in a way that can be turned into actionable decisions. Here are the most crucial features to look for:
- Data Visualization Tools - These tools convert raw data into graphical representations. They allow me to quickly identify patterns and trends that might be hidden in text-based data alone.
- Cross-tabulation Capability - This feature enables the comparison of responses across different groups. It helps me understand how different segments of the population respond to survey questions, which is essential for targeted analysis.
- Advanced Statistical Analysis - Advanced statistical tools such as regression analysis, factor analysis, or t-tests. These methods allow me to validate hypotheses and measure correlations between different survey responses, ensuring the data supports robust conclusions.
- Automated Report Generation - The ability to automatically generate reports saves time and ensures consistency in how survey results are presented. This feature allows me to focus more on analysis rather than on formatting and presenting data.
- Real-time Response Collection - Gathering responses in real-time helps in quickly adjusting the focus of the survey if initial results show unexpected trends. It ensures that I can make the most of the data collection period.
- Anonymity and Privacy Settings - Proper handling of respondent anonymity and data privacy assures participants that their responses remain confidential. This increases the likelihood of receiving honest and accurate responses.
- Multi-language Support - This allows the survey tool to reach a broader audience by supporting multiple languages. It is crucial for international studies to ensure that language barriers do not skew the data.
- Mobile Compatibility - With many users accessing the internet via mobile devices, having a mobile-compatible survey ensures higher response rates. It makes the survey accessible to a wider audience.
- Integration with Other Tools - The ability to integrate with other data tools and platforms, like CRM software or data analytics platforms, streamlines the workflow and enriches the data ecosystem, making data management more efficient.
- User-friendly Interface - An intuitive and easy-to-navigate interface ensures that I can utilize all features of the software without needing extensive training. This accessibility is key to efficiently managing and analyzing survey data.
Choosing software packed with these features can empower you to effectively transform raw survey data into valuable insights. This helps you make informed decisions that positively impact your research and strategies.
Benefits of Survey Analysis Software
Survey analysis software can help you enhance your understanding of and engagement with respondents. Here are five primary benefits of survey analysis software for users and organizations:
1. Efficient Data Management: Survey analysis software streamlines the process of collecting and organizing data. By automating data entry and storage, users can avoid the common pitfalls of manual errors and data redundancy, ensuring that data is accurate and readily accessible for analysis.
2. Advanced Analytical Tools: These platforms often come equipped with sophisticated analytical tools that can perform complex data analysis with ease. This allows users to derive deeper insights from survey data, which can inform strategic decision-making and improve outcomes across various aspects of the business.
3. Enhanced Reporting Capabilities: The ability to generate comprehensive and customizable reports is a key feature of survey analysis software. Users can create visually appealing and easy-to-understand reports that effectively communicate findings to stakeholders, facilitating better information sharing and collaboration.
4. Time and Cost Efficiency: By automating various aspects of the survey process, such software significantly reduces the time and labor traditionally required to conduct surveys and analyze results. This efficiency not only speeds up the research cycle but also reduces the costs associated with it, making it a cost-effective solution for businesses.
5. Scalability: Survey analysis software is designed to handle varying scales of data, from small datasets to large volumes of complex information. This scalability ensures that as a business grows, the software can continue to meet its evolving data analysis needs without requiring frequent upgrades or changes in methodology.
With its capacity to enhance productivity, provide valuable insights, and adapt to growing data demands, this technology stands as a vital asset for modern businesses seeking to maintain a competitive edge.
Costs & Pricing for Survey Analysis Software
Survey analysis software offers a range of pricing and plan options tailored to meet diverse business needs and scales. Each plan is designed to provide specific features that can help businesses of all sizes gather and analyze survey data effectively. Understanding these plans and their offerings is crucial for selecting a software package that matches your organization's objectives and budget constraints. Here’s a quick overview of typical plan options you might come across:
| Plan Type | Average Price | Common Features |
|---|---|---|
| Free | $0 | Basic survey creation, limited responses, basic data analysis tools |
| Basic | $20 - $30/month | Advanced survey designs, increased response limits, export options |
| Professional | $50 - $100/month | Custom branding, integration capabilities, advanced analytics |
| Enterprise | $1000+/month | Full customization, 24/7 support, unlimited surveys and responses |
When selecting a plan, consider the scope of your survey projects, the depth of data analysis required, and the level of support you might need. Balancing these factors with cost will help ensure you receive maximum value from your investment and effectively support your data-driven decision-making processes.
Survey Analysis Software FAQs
Survey analysis is a specialist field, yet it’s important to every business. So it’s no surprise that I get lots of questions on this topic. Here are answers to the most common questions I’ve received:Survey analysis software helps organizations collect, organize, and interpret survey data to uncover trends, patterns, and insights. These tools combine statistical analysis, data visualization, and text analytics to transform raw responses into actionable intelligence—supporting data-driven decisions that improve products, services, and customer experience.
What does survey analysis software do?
The core strength they share is the ability to take raw survey data and turn it into tangible insights. You can then identify patterns, trends, correlations, and conclusions that can improve business decisions. But each tool takes its own approach based on features, ease of use, and ideal use cases.
What is sentiment analysis and how does it work?
Sentiment analysis is the process of analyzing text to identify the prevailing opinion. It involves extracting data and quantifying this in a useful way. This is done using natural language processing and text analysis. In general, the goal is to determine whether the opinion expressed is positive, negative, or neutral towards the chosen topic.
What’s the connection between sentiment analysis and natural language processing?
Sentiment analysis describes the process of identifying and categorizing opinions expressed in text form. It determines whether they are positive, negative, or neutral in tone.
Natural language processing (NLP) is a branch of artificial intelligence. This technology is often used to help computers interpret, understand, and obtain meaning from human language.
Sentiment analysis relies heavily on natural language processing techniques like speech tagging and semantic parsing. These are used to understand the sentiment of unstructured text.
What is a net promoter score and how can you improve it?
The Net Promoter Score (NPS) is used to measure customer loyalty and employee satisfaction. It is usually assessed by asking customers how likely they are (on a 0-10 scale) to recommend a company, product, or service to others.
People who show scores of 9-10 are considered promoters, while those in the 7-8 range are passives. People scoring in the 0-6 range are detractors. NPS is calculated simply by subtracting the detractors from the promoters. So improving your customer service should lead to a higher score.
NPS provides a handy metric of overall customer satisfaction. Companies can track and benchmark over time, to assess how sentiment is changing. Businesses can measure customer satisfaction through metrics like Net Promoter Score. To track ease of service delivery, they may use Customer Effort Score (CES). Together, tracking these metrics can help youimprove your retention and customer experience management.
What are voice of customer analytics?
Successful companies are focused on understanding their customer needs and preferences. This can be achieved by actively listening to the voice of the customer. Businesses may use regular feedback channels such as surveys, reviews, and direct outreach. Both qualitative and quantitative methods can help build a complete picture of your current customer sentiment.
What other survey & data analysis software reviews should I read?
Whether you’re looking to engage more effectively with customers or dive deeper into market trends, reading comprehensive reviews on various survey and data analysis software can guide your decision-making process. Here are some areas and tools you might consider delving into for more insights.
Turn Feedback into Action
With the help of today’s survey analysis software, you’ll be able to understand your customers in great depth. They say that ‘data is the new oil,’ and understanding customer feedback can certainly be the path to business success.
The global online survey software market is a $3.2 billion industry with a compound annual growth rate of 14.6%. To ensure you don’t miss the next big strike, sign up for our newsletter. That way, we can keep you up to date with the latest news in this fast-moving sector.