10 Beste Dynatrace-Alternativen im Test 2026

Beste Dynatrace-Alternativen: Kurzliste


Als Customer Experience Manager stehen Sie vor zahlreichen Herausforderungen. Sie benötigen Tools zur Datenbeobachtung, die Ihrem Team helfen, Leistungsprobleme zu verfolgen, Ressourcen zu verwalten und Ihre Kunden zufrieden zu stellen. Dynatrace ist beliebt, erfüllt aber möglicherweise nicht Ihre spezifischen Anforderungen.
Nach meiner Erfahrung kann die richtige Alternative einen großen Unterschied machen. Vielleicht suchen Sie nach günstigeren Preisen, bestimmten Funktionen oder einer besseren Integration in bestehende Systeme.
Ich habe verschiedene Optionen unabhängig getestet und bewertet, um Ihnen die besten Alternativen zu Dynatrace vorzustellen. Ich führe Sie durch meine Top-Auswahl und helfe Ihnen, eine fundierte Entscheidung zu treffen, die zu Ihrem Unternehmen passt. Lassen Sie uns die Lösungen erkunden, die Ihrem Team echten Mehrwert bieten.
Was ist Dynatrace?
Dynatrace ist eine Datenbeobachtungsplattform, die Unternehmen dabei hilft, die Anwendungsleistung zu überwachen und zu optimieren. Sie wird in der Regel von IT-Profis, Entwicklern und Managern für das Kundenerlebnis genutzt, die reibungslose Abläufe und eine hohe Nutzerzufriedenheit sicherstellen müssen.
Automatisiertes Infrastruktur-Monitoring, KI-gestützte Einblicke und Workflows für vollständige Datenbeobachtung helfen Teams, Probleme zu identifizieren, Leistungskennzahlen zu verstehen und das Ressourcenmanagement zu verbessern. Insgesamt liefert Dynatrace wertvolle Informationen, um die Systemverfügbarkeit zu erhöhen.
Beste Dynatrace-Alternativen: Zusammenfassung
Diese Vergleichstabelle fasst die Preisinformationen meiner Top-Auswahl an Dynatrace-Alternativen zusammen, damit Sie die beste Lösung für Ihr Budget und Ihren Bedarf finden.rn
| Tool | Best For | Trial Info | Price | ||
|---|---|---|---|---|---|
| 1 | Am besten für umfassendes Full-Stack-Monitoring geeignet | Kostenlose Testversion + kostenlose Demo verfügbar | Preise auf Anfrage | Website | |
| 2 | Am besten für einheitliche Sicherheit und Observability | 14-tägige kostenlose Testphase + kostenlose Demo verfügbar | Preise auf Anfrage | Website | |
| 3 | Am besten geeignet für KI-gestützte Vorfallserkennung | Kostenlose Demo verfügbar | Ab $21.20/MVS/Monat | Website | |
| 4 | Am besten geeignet für die Integration im AWS-Ökosystem | Kostenlose Version verfügbar | Pay-as-you-go-Modell | Website | |
| 5 | Am besten für Azure-Service-Integration | 30-tägige kostenlose Testversion + kostenloser Tarif verfügbar | Ab $0,05/GB aufgenommen | Website | |
| 6 | Am besten geeignet für All-in-One-Netzwerküberwachung | 30-tägige kostenlose Testversion verfügbar | Ab $179/Monat (jährlich abgerechnet) | Website | |
| 7 | Am besten geeignet für Echtzeit-Fehlerverfolgung | Kostenloser Tarif + kostenlose Demo verfügbar | Ab $26/Monat (jährlich abgerechnet) | Website | |
| 8 | Am besten geeignet für hybrides IT-Monitoring | Kostenlose Version + 30-tägige kostenlose Testphase verfügbar | Ab $225/Monat (jährliche Abrechnung) | Website | |
| 9 | Am besten geeignet für Cloud-native Observabilität | 14-tägige kostenlose Testphase + kostenloser Tarif verfügbar | Ab $15/Host/Monat (jährliche Abrechnung) | Website | |
| 10 | Am besten für agentenloses Datenbank-Monitoring | 30-tägige kostenlose Testversion + kostenlose Demo + kostenloser Tarif verfügbar | Ab $199/Jahr | Website |
Warum Sie unseren Software-Bewertungen vertrauen können
Wir testen und bewerten seit 2020 Software. Als CX-Experten wissen wir, wie entscheidend – und schwierig – es ist, bei der Auswahl der passenden Software die richtige Entscheidung zu treffen. Wir investieren viel Zeit in gründliche Recherche, um unseren Lesern zu besseren Kaufentscheidungen zu verhelfen. Wir haben über 2.000 Tools für verschiedene CX-Anwendungsfälle getestet und mehr als 1.000 umfassende Software-Bewertungen verfasst. Erfahren Sie mehr darüber, wie wir transparent bleiben & unsere Software-Bewertungsmethodik.
-

SupportYourApp
Visit WebsiteThis is an aggregated rating for this tool including ratings from Crozdesk users and ratings from other sites.4.7 -
Tidio
Visit WebsiteThis is an aggregated rating for this tool including ratings from Crozdesk users and ratings from other sites.4.7 -
Freshdesk
Visit WebsiteThis is an aggregated rating for this tool including ratings from Crozdesk users and ratings from other sites.4.4


Beste Dynatrace-Alternativen: Bewertungen
Nachfolgend finden Sie meine ausführlichen Zusammenfassungen der besten Dynatrace-Konkurrenten, die es auf meine Kurzliste geschafft haben. Meine Bewertungen bieten einen detaillierten Blick auf die wichtigsten Funktionen, Vor- und Nachteile, Integrationen und ideale Einsatzszenarien jedes Tools, damit Sie die beste Lösung für sich finden.rn
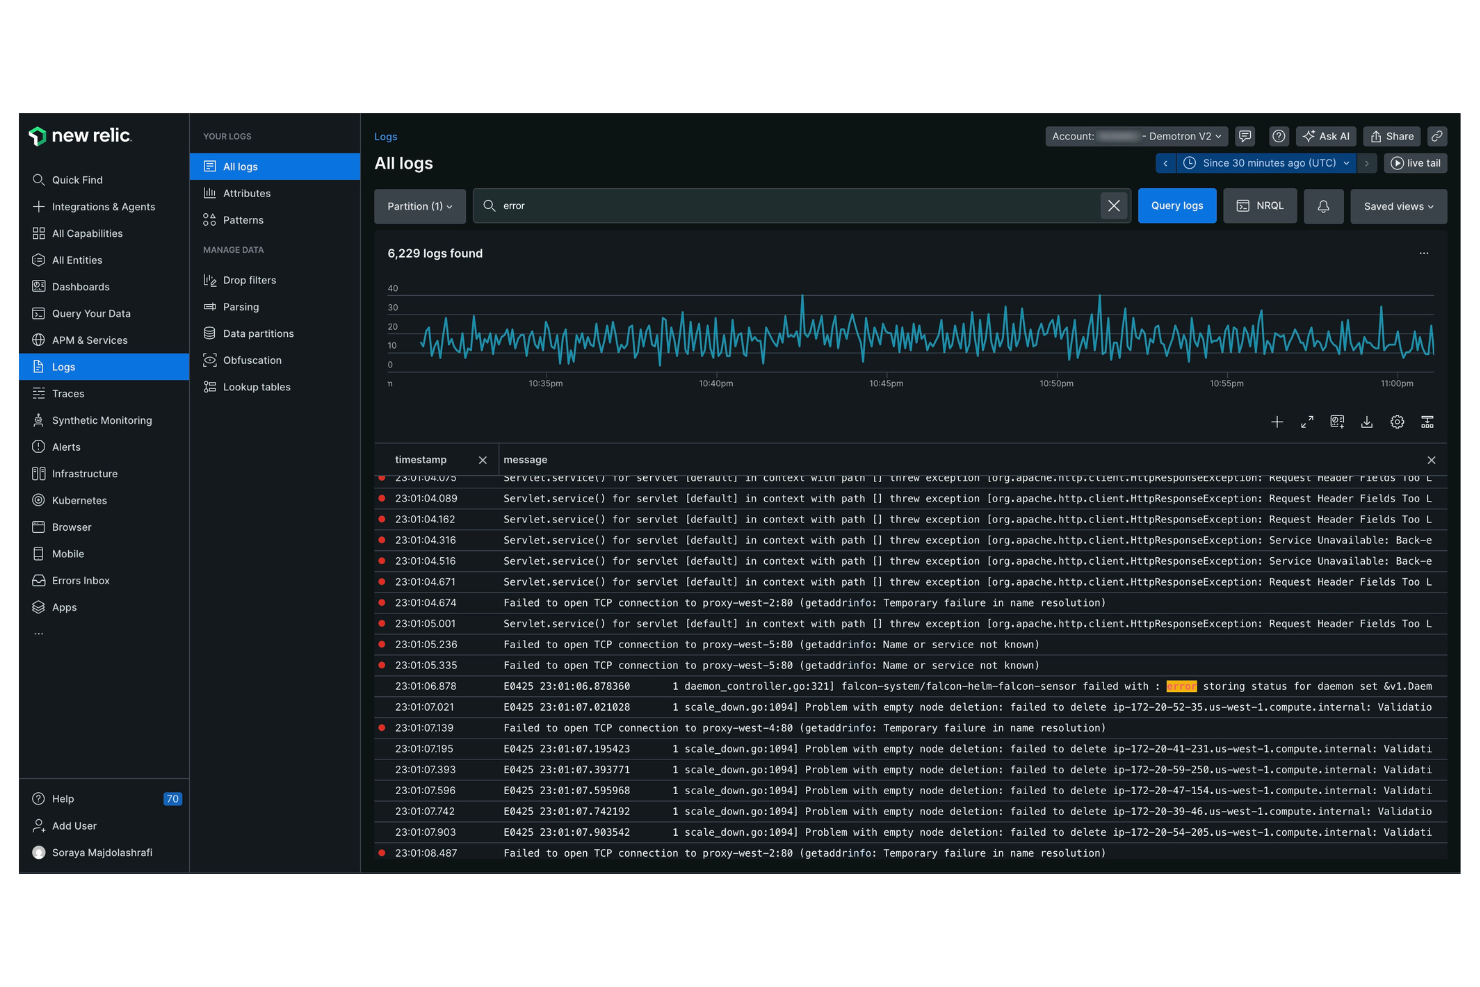
New Relic ist eine Software-Analyse- und Leistungsüberwachungsplattform, die für Softwareentwickler und IT-Fachleute entwickelt wurde. Sie bietet Einblicke in die Anwendungsleistung und den Zustand der Infrastruktur und hilft Ihnen, Ihre digitalen Abläufe zu optimieren.
Warum es eine gute Dynatrace-Alternative ist: New Relic bietet durchgängiges Full-Stack-Monitoring und ermöglicht so Transparenz über Ihren gesamten Anwendungs-Stack. Die Echtzeit-Analysen der Plattform liefern umsetzbare Erkenntnisse, sodass Ihr Team schnell auf Probleme reagieren kann. Mit den anpassbaren Dashboards können Sie Daten so visualisieren, wie es Ihren spezifischen Anforderungen entspricht.
Herausragende Funktionen und Integrationen:
Funktionen umfassen Fehleranalysen, mit denen Sie Anwendungsfehler identifizieren und beheben können. Die verteilte Nachverfolgung hilft Ihnen, Anfragen über verschiedene Dienste hinweg zu verfolgen, sodass Sie Engpässe erkennen können. Die Plattform bietet außerdem synthetisches Monitoring, um Benutzerinteraktionen zu simulieren und die Anwendungsleistung zu testen. Mit dem Log-Management können Sie Protokolldaten sammeln und analysieren, um tiefere Einblicke in Ihre Systeme zu erhalten.
Integrationen umfassen AWS, Microsoft Azure, Google Cloud Platform, Kubernetes, Docker, Slack, PagerDuty und mehr.
Pros and Cons
Pros:
- Effektives verteiltes Tracing
- Echtzeit-Analysen
- Anpassbare Dashboards
Cons:
- Benutzeroberfläche kann überladen und komplex wirken
- Preise pro Nutzerplatz sind teuer
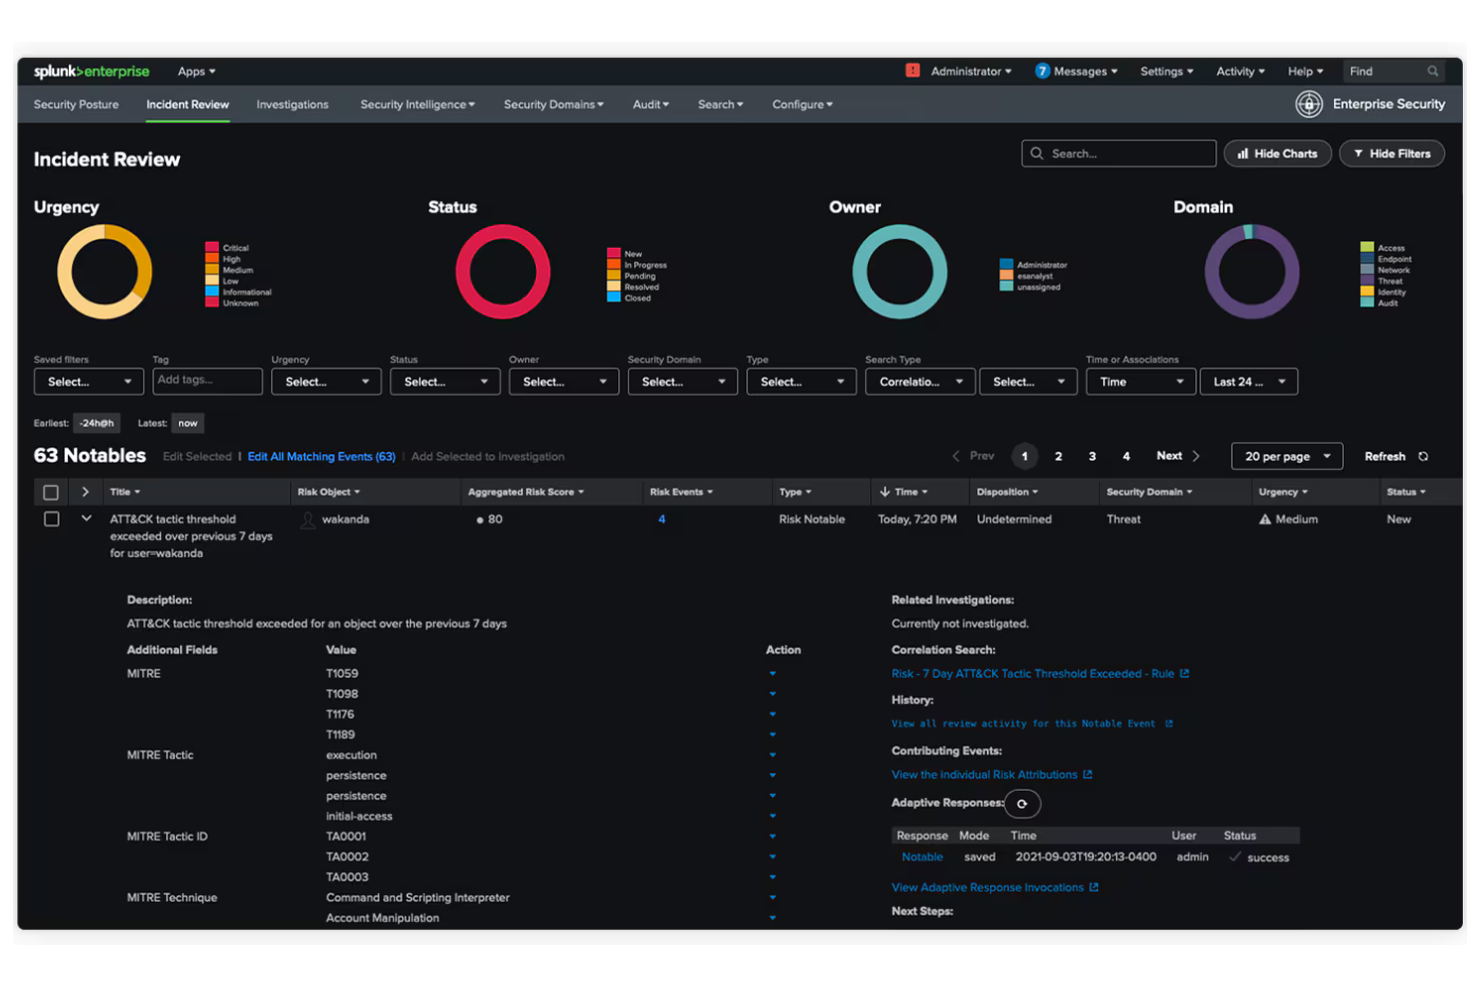
Splunk ist eine Datenplattform, die für IT-Betrieb, Anwendungssicherheit und Geschäftsanalysen entwickelt wurde. Sie hilft Unternehmen, Daten in umsetzbare Erkenntnisse zu verwandeln, um Entscheidungsfindung und operative Effizienz zu verbessern.
Warum es eine gute Dynatrace-Alternative ist: Splunk bietet einheitliche Sicherheit und Observability und ermöglicht einen vollständigen Überblick über Ihre Daten in verschiedenen Umgebungen. Die Echtzeit-Datenverarbeitung unterstützt Ihr Team dabei, Probleme schnell zu erkennen und darauf zu reagieren. Dank der Funktionen für maschinelles Lernen erhält Ihr Unternehmen vorausschauende Einblicke und kann potenzielle Probleme frühzeitig erkennen. Benutzerdefinierte Dashboards ermöglichen es, Daten in einem für Ihre Betriebsabläufe passenden Format zu visualisieren.
Herausragende Funktionen und Integrationen:
Funktionen umfassen fortschrittliche Bedrohungserkennung, um Sicherheitsrisiken in Echtzeit zu identifizieren. Die Plattform bietet außerdem Log-Management zur Sammlung und Analyse von Daten über Microservices hinweg sowie leistungsstarke Analysen zur Aufdeckung verborgener Muster und Trends.
Integrationen umfassen AWS, Microsoft Azure, Google Cloud Platform, ServiceNow, Cisco, Palo Alto Networks und weitere.
Pros and Cons
Pros:
- Einheitliche Datenansicht
- Echtzeit-Verarbeitung
- Fortschrittliche Bedrohungserkennung
Cons:
- Komplexe Konfiguration und Einrichtung
- Hohe Hardware-/Ressourcenanforderungen
IBM Instana ist eine APM- und Observability-Plattform, die sich an DevOps-Teams und IT-Betrieb richtet. Sie hilft dabei, Anwendungen und Infrastruktur zu überwachen und liefert Einblicke, um Leistung und Benutzererlebnis zu optimieren.
Warum es eine gute Dynatrace-Alternative ist: IBM Instana bietet KI-gestützte Vorfallserkennung, sodass Ihr Team Probleme schnell identifizieren und beheben kann. Die automatische Erkennung und Anwendungszuordnung sorgen für vollständige Transparenz in Ihren Systemen. Die Überwachung in Echtzeit liefert sofortige Einblicke in Leistungskennzahlen und hilft Ihnen, einen optimalen Betrieb aufrechtzuerhalten. Mit dem intuitiven Dashboard können Sie relevante Daten einfach durchsuchen und analysieren.
Herausragende Funktionen und Integrationen:
Funktionen umfassen automatisierte Ursachenanalyse, die hilft, die Quelle von Problemen zu identifizieren. Die kontinuierliche Integrationsunterstützung der Plattform ermöglicht automatische Aktualisierungen und Bereitstellungen. Sie profitieren außerdem von individuell anpassbaren Benachrichtigungen, die Ihr Team über kritische Änderungen informiert halten.
Integrationen umfassen Kubernetes, Docker, AWS, Microsoft Azure, Google Cloud Platform, VMware Tanzu, Red Hat OpenShift und mehr.
Pros and Cons
Pros:
- KI-gestützte Vorfallserkennung
- Überwachung in Echtzeit
- Automatisierte Ursachenanalyse
Cons:
- Erfordert technisches Fachwissen
- Kann ressourcenintensiv sein
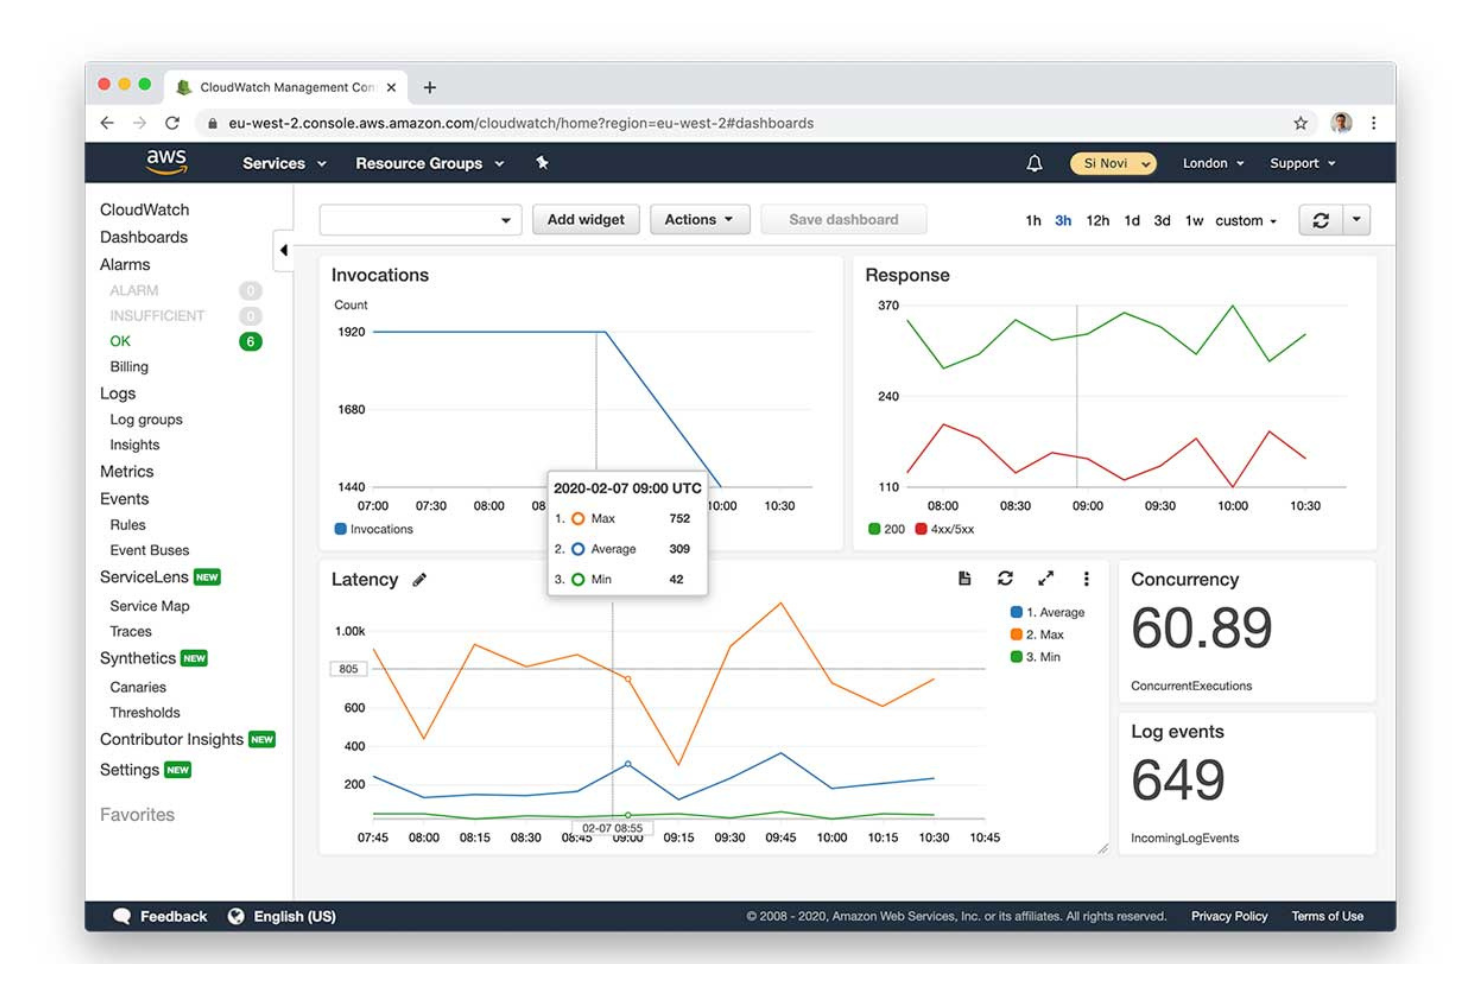
Amazon CloudWatch ist ein Überwachungs- und Verwaltungsdienst, der für Entwickler und IT-Betriebsteams entwickelt wurde. Er hilft bei der Überwachung von AWS-Ressourcen und Anwendungen und liefert Einblicke in die Systemleistung und den operativen Zustand.
Warum es eine gute Dynatrace-Alternative ist: Amazon CloudWatch bietet eine tiefe, native Integration in das AWS-Ökosystem und ist dadurch eine ideale Wahl für Teams, die AWS-Services nutzen. Die Überwachungsfunktionen in Echtzeit ermöglichen es Ihrem Team, Metriken und Protokolle effizient zu verfolgen. Die Möglichkeit, Alarme auf Basis von Schwellenwerten zu setzen, stellt sicher, dass Sie bei Problemen rechtzeitig benachrichtigt werden, um reagieren zu können. Die zentrale Protokollierung konsolidiert Daten aus verschiedenen Quellen und bietet eine einheitliche Sicht auf Ihre Umgebung.
Herausragende Funktionen und Integrationen:
Funktionen umfassen Anomalieerkennung, die dabei hilft, ungewöhnliche Muster in Ihren Metriken zu identifizieren. Der Dienst bietet benutzerdefinierte Dashboards, mit denen Sie Daten so visualisieren können, wie es den Anforderungen Ihres Teams entspricht. Mit der ereignisbasierten Automatisierung können Sie Reaktionen auf bestimmte Bedingungen oder Änderungen in Ihrer Umgebung automatisieren.
Integrationen umfassen die meisten AWS-Services, Dynatrace, xMatters, Slack, Microsoft Teams, SRE und mehr.
Pros and Cons
Pros:
- Tiefe AWS-Integration
- Überwachung in Echtzeit
- Anomalieerkennung
Cons:
- Sehr komplexe und verwirrende Preisgestaltung
- Kosten steigen bei hohem Protokollaufkommen stark an
Microsoft Azure Monitor ist eine cloudbasierte Plattform, die Telemetriedaten sammelt, analysiert und darauf reagiert. Sie bietet Einblicke in die Leistung und Gesundheit von Anwendungen und Infrastruktur innerhalb der Azure-Umgebung.
Warum es eine gute Dynatrace-Alternative ist: Microsoft Azure Monitor bietet eine enge Integration mit Azure-Diensten und ist damit eine ideale Wahl für Teams, die stark im Azure-Ökosystem verankert sind. Die Funktion Application Insights liefert detaillierte Analysen und hilft dabei, das Nutzerverhalten und die Anwendungsleistung zu verstehen. Mit Log Analytics können Sie Daten aus verschiedenen Quellen abfragen und auswerten, was Ihre Fähigkeit zur Fehlerbehebung verbessert. Individuelle Warnmeldungen helfen Ihrem Team, über kritische Ereignisse in Ihrer Umgebung informiert zu bleiben.
Herausragende Funktionen und Integrationen:
Funktionen umfassen automatische Skalierung, die es ermöglicht, Ressourcen je nach Bedarf automatisch anzupassen. Das Abhängigkeits-Tracking hilft Ihnen, die Beziehungen zwischen verschiedenen Komponenten Ihrer Anwendung zu visualisieren. Der Dienst bietet außerdem Netzwerküberwachung, um die Leistung und Verfügbarkeit Ihres Netzwerks sicherzustellen.
Integrationen umfassen Azure DevOps, Azure Security Center, Azure Automation, Azure Logic Apps, Azure Functions, Power BI, Microsoft Teams und mehr.
Pros and Cons
Pros:
- Detaillierte Einblicke in Anwendungen
- Starke Azure-Integration
- Effektive Log-Analyse
Cons:
- Fragmentierte Sicht bei hybriden Clouds
- Begrenzte Unterstützung außerhalb von Azure
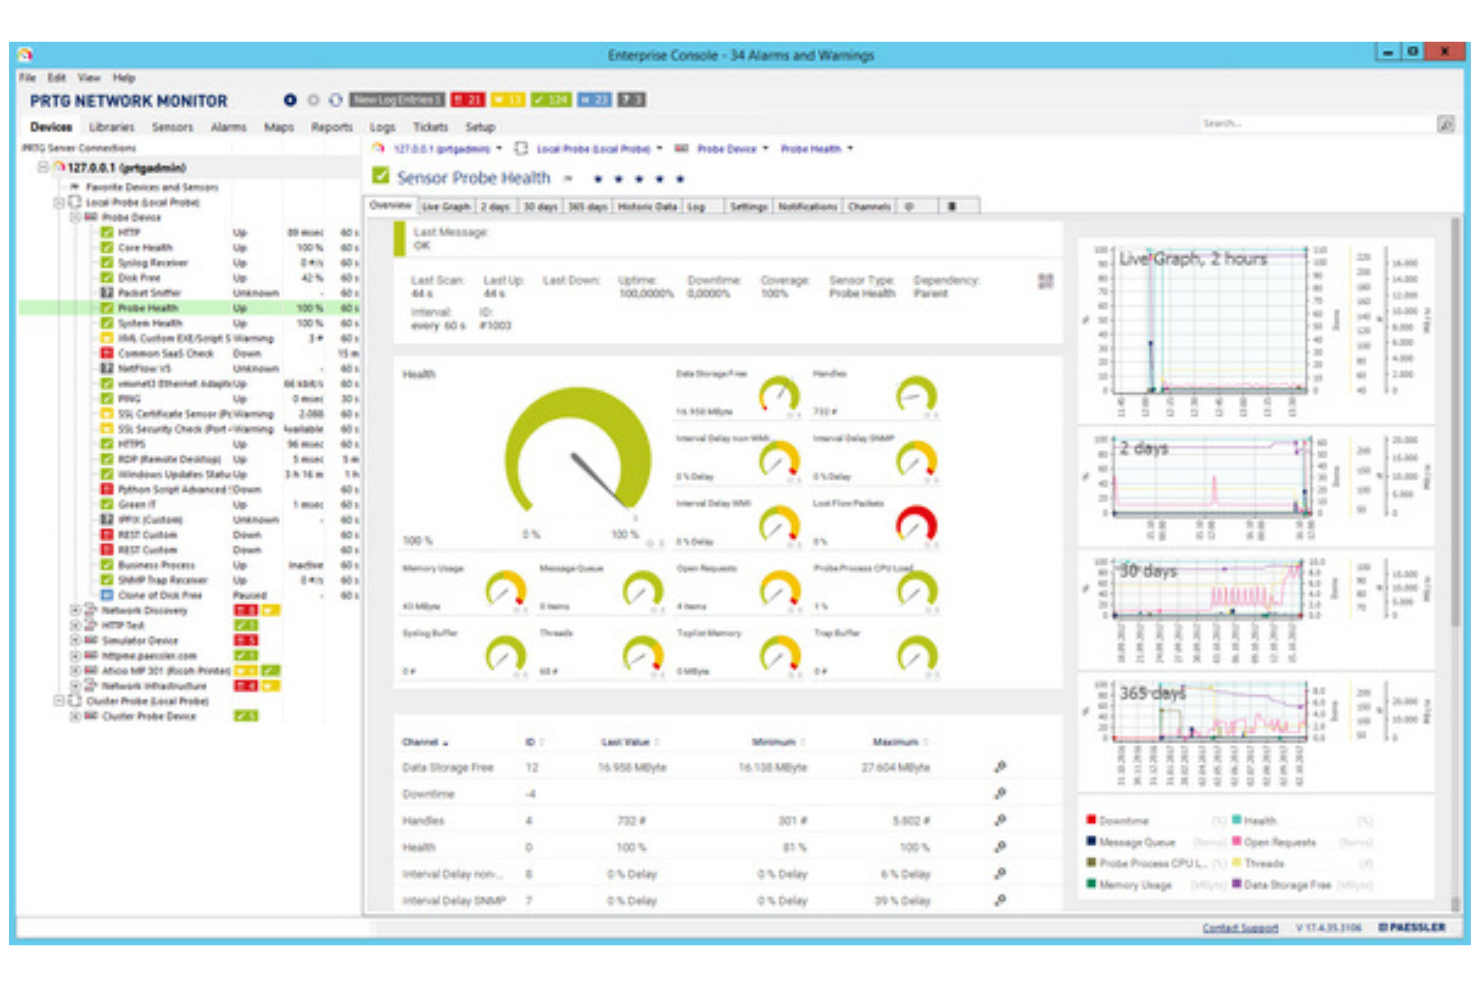
PRTG Network Monitor ist ein Überwachungstool, das von IT-Administratoren und Netzwerkmanagern eingesetzt wird. Es hilft dabei, die Netzwerkleistung zu überwachen und Probleme in Ihrer IT-Infrastruktur zu erkennen.
Warum es eine gute Alternative zu Dynatrace ist: PRTG Network Monitor bietet eine All-in-One-Netzwerküberwachung und verschafft Ihnen einen umfassenden Überblick über Ihr gesamtes Netzwerk. Die sensorbasierte Überwachung ermöglicht es Ihnen, verschiedene Metriken nach Ihren Wünschen zu überwachen. Das Tool bietet Echtzeit-Benachrichtigungen, um Ihr Team sofort über auftretende Probleme zu informieren. Anpassbare Dashboards erlauben es, Daten passend zu Ihren individuellen Anforderungen zu visualisieren.
Herausragende Funktionen und Integrationen:
Funktionen beinhalten einen Kartendesigner, mit dem Sie individuelle Netzwerkkarten zur besseren Visualisierung erstellen können. Die Berichterstellungsfunktion generiert detaillierte Berichte zur Netzwerkleistung und unterstützt Sie bei der Analyse. Es ist außerdem möglich, verteiltes Monitoring einzurichten, sodass Sie mehrere Netzwerke über eine einzige Oberfläche verwalten können.
Integrationen umfassen Microsoft Azure, AWS, VMware, Cisco Meraki, NetApp, Dell EMC, HPE, Synology und weitere.
Pros and Cons
Pros:
- All-in-One-Überwachungslösung
- Echtzeit-Benachrichtigungssystem
- Anpassbare Dashboard-Ansichten
Cons:
- Core-Server-Installation nur für Windows
- Sensoren verbrauchen die Lizenzanzahl schnell
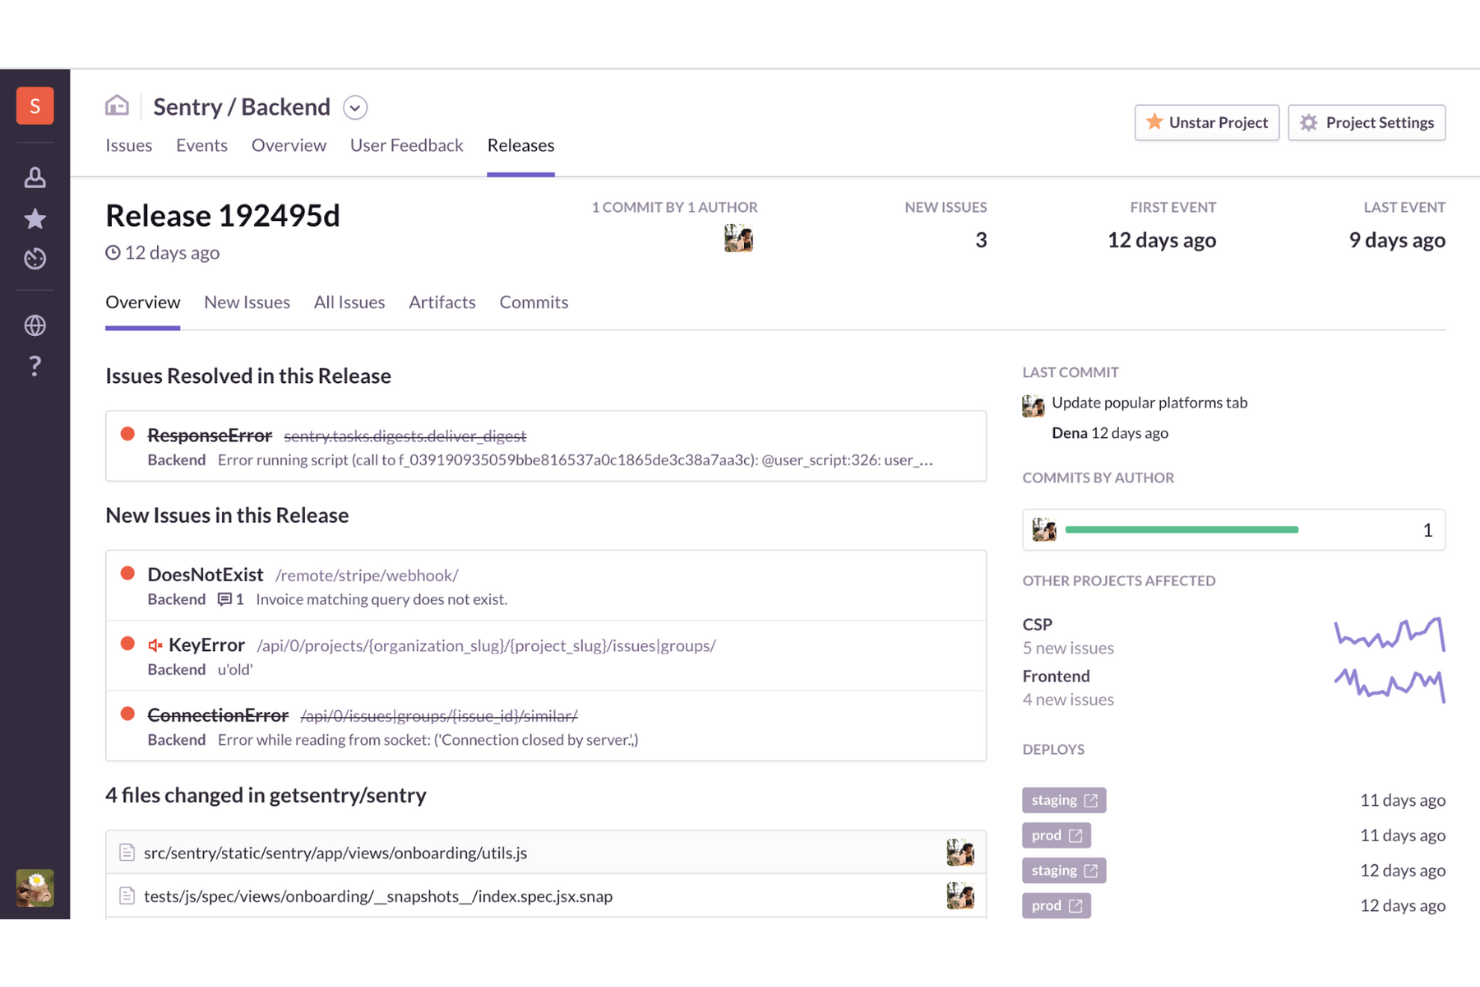
Sentry ist ein Tool für Anwendungsleistungsüberwachung (APM) und Fehlerverfolgung, das von Entwicklern und IT-Teams eingesetzt wird. Es hilft dabei, Anwendungsprobleme zu erkennen und zu beheben, um eine reibungslose Performance und ein hochwertiges Benutzererlebnis sicherzustellen.
Warum es eine gute Dynatrace-Alternative ist: Sentry konzentriert sich auf Echtzeit-Fehlerverfolgung und bietet sofortige Benachrichtigungen, wenn Probleme auftreten. KI-gestützte Debugging-Tools liefern Einblicke in die Ursachen von Fehlern. Damit ist Sentry ideal für Teams, die sofortige Fehlererkenntnisse und schnelle Lösungen benötigen.
Herausragende Funktionen und Integrationen:
Funktionen umfassen Sitzungswiedergaben, mit denen Sie Benutzerinteraktionen bis zum Auftreten eines Fehlers nachvollziehen können. Verteiltes Tracing hilft Ihnen dabei, den Ablauf von Anfragen im gesamten System zu überwachen und Probleme zu identifizieren. Die KI-Codeprüfung bietet automatisierte Vorschläge zur Codeverbesserung.
Integrationen umfassen GitHub, Slack, Jira, Bitbucket, GitLab, Trello, Asana, PagerDuty, Microsoft Teams, Linear und viele mehr.
Pros and Cons
Pros:
- Echtzeit-Fehlerverfolgung
- Benutzerfreundliches Interface
- Intuitives Debugging
Cons:
- Begrenzte erweiterte Analysen
- Weniger effektives Benachrichtigungssystem
New Product Updates from Sentry

Sentry Adds Log Export in CSV and JSONL
Sentry now supports exporting up to 10,000 log lines from Explore → Logs in CSV or JSON Lines, with downloads available in-browser or as background downloads and email. For more information, visit Sentry's official site.
 .
.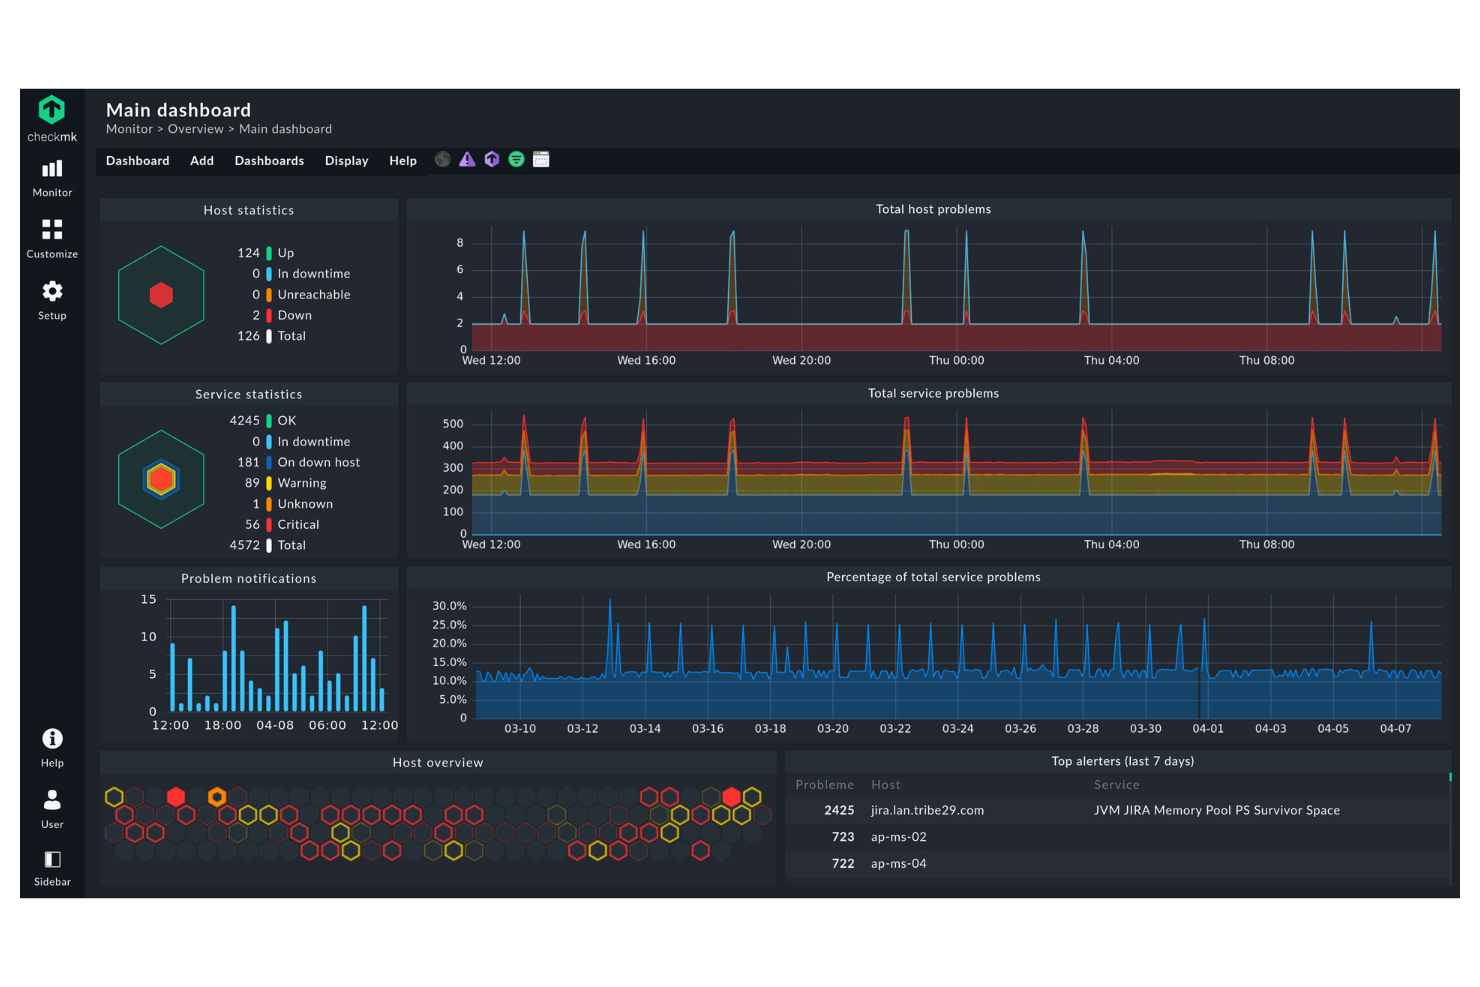
Checkmk ist ein IT-Überwachungstool, das für Systemadministratoren und IT-Betriebsteams entwickelt wurde. Es bietet tiefgehende Einblicke in die IT-Infrastruktur und hilft Ihnen bei der Verwaltung von Servern, Netzwerken und Anwendungen.
Warum es eine gute Dynatrace-Alternative ist: Checkmk überzeugt durch ausgezeichnetes hybrides IT-Monitoring, wodurch Sie sowohl lokale als auch Cloud-Umgebungen überwachen können. Mit anpassbaren Dashboards lässt sich die Anzeige der Informationen genau auf Ihre Anforderungen zuschneiden. Das Tool bietet zudem detaillierte Berichte, die Ihnen helfen, Leistungskennzahlen und Trends nachzuverfolgen.
Herausragende Funktionen und Integrationen:
Funktionen umfassen anpassbare Schwellenwerte, mit denen Sie spezifische Leistungsgrenzen für Warnmeldungen festlegen können. Das Tool bietet ein flexibles Benachrichtigungssystem, sodass Sie zu den wichtigsten Problemen informiert werden. Die Auto-Discovery-Funktion erkennt Netzwerkgeräte und Dienste automatisch, was die Einrichtung für Ihr Team erleichtert. Zudem wird verteiltes Monitoring unterstützt, wodurch sich mehrere Standorte zentral verwalten lassen.
Integrationen umfassen Nagios, Prometheus, Grafana, InfluxDB, VMware, AWS, Microsoft Azure, Docker und mehr.
Pros and Cons
Pros:
- Hybride Monitoring-Funktionen
- Automatische Erkennung von Geräten
- Anpassbare Dashboards
Cons:
- Mobile App benötigt erhebliche Verbesserungen
- Komplexität bei regelbasierter Konfiguration
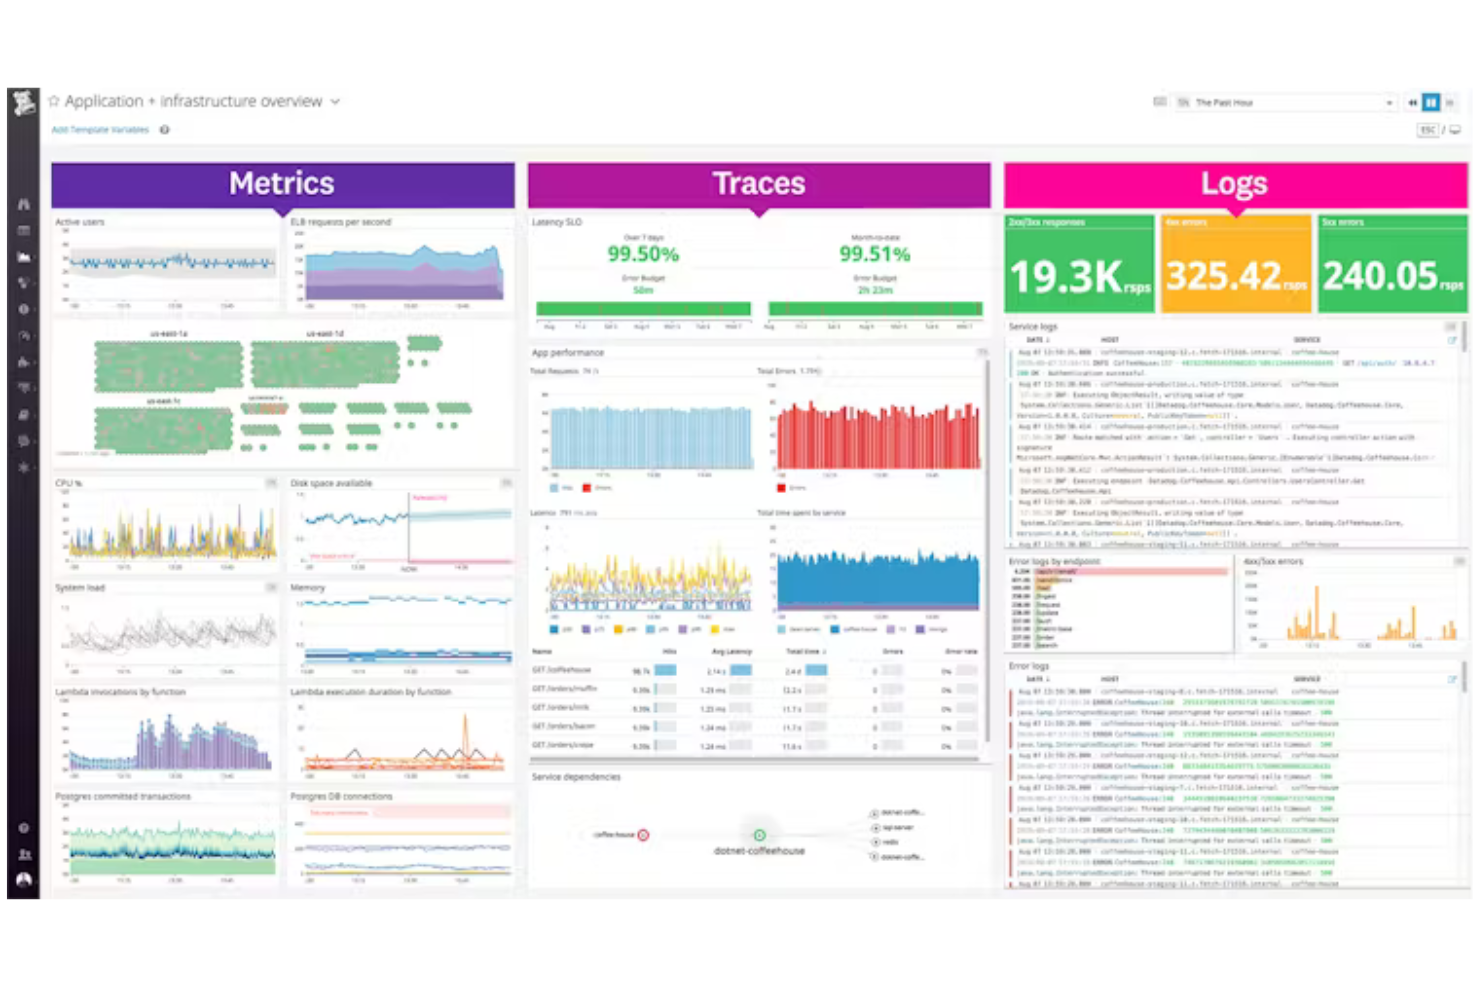
Datadog ist eine führende SaaS-basierte Observabilitäts- und Sicherheitsplattform für Cloud-native Anwendungen, die vor allem von DevOps-Teams und IT-Profis genutzt wird. Sie bietet umfassende Einblicke in die Anwendungsleistung, den Zustand der Infrastruktur und die Benutzererfahrung, einschließlich Monitoring für verteilte Systeme und API-Performance.
Warum es eine gute Dynatrace-Alternative ist: Datadog glänzt im Bereich Cloud-native Observabilität und bietet spezialisierte Werkzeuge zur Überwachung von Cloud-Umgebungen. Die Echtzeit-Dashboards liefern Einblicke in Infrastrukturmetriken, sodass Sie Ihre Systeme im Blick behalten können. Die Anomalie-Erkennungsfunktion der Plattform benachrichtigt Ihr Team bei ungewöhnlichen Mustern, um eine proaktive Problemlösung zu ermöglichen. Dank anpassbarer Benachrichtigungen können Sie die Warnmeldungen auf die Bedürfnisse Ihres Teams zuschneiden.
Herausragende Funktionen und Integrationen:
Funktionen umfassen Log-Management, mit dem Sie Protokolle aus verschiedenen Quellen sammeln und analysieren können, um tiefergehende Einblicke zu erhalten. Die Plattform bietet APM-Tools zur Verfolgung wichtiger Kennzahlen und zur Verbesserung der Anwendungsqualität. Mit der Netzwerkleistungsüberwachung können Sie außerdem Zuverlässigkeit und Performance Ihres Netzwerks sicherstellen.
Integrationen umfassen AWS, Microsoft Azure, Google Cloud Platform, Kubernetes, Docker, Slack, GitHub und mehr.
Pros and Cons
Pros:
- Starker Fokus auf Cloud-nativ
- Echtzeit-Dashboards
- Effektive Anomalieerkennung
Cons:
- Kann für Einsteiger überwältigend sein
- Hohe Datenmengen können die Kosten erhöhen
Am besten für agentenloses Datenbank-Monitoring
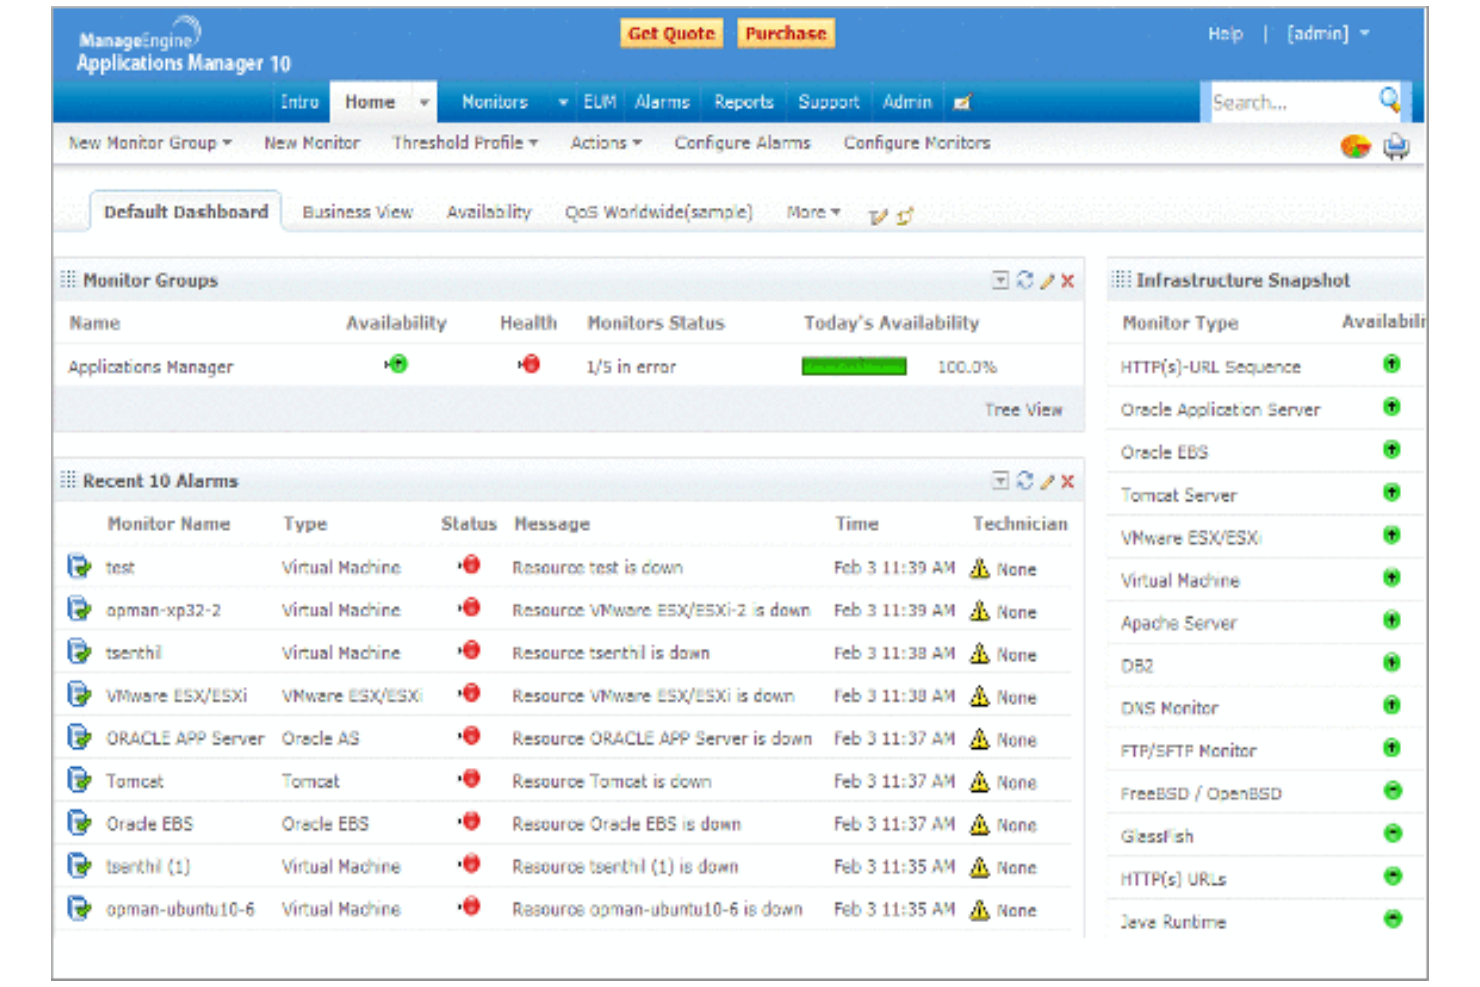
ManageEngine Applications Manager ist ein Tool, das für IT-Betriebs- und DevOps-Teams entwickelt wurde, um die Anwendungsleistung zu überwachen, die Ressourcennutzung zu verfolgen und das optimale Funktionieren von IT-Umgebungen sicherzustellen.
Warum es eine gute Alternative zu Dynatrace ist: ManageEngine Applications Manager bietet agentenloses Datenbank-Monitoring, was es zu einer praktischeren und kosteneffizienteren Wahl als Dynatrace macht. Diese Funktion ermöglicht es, Datenbanken ohne Installation von Agents zu überwachen, was den Aufwand reduziert und die Einrichtung vereinfacht. Das Tool liefert Echtzeiteinblicke in die Anwendungsleistung und hilft dabei, Probleme schnell zu erkennen. Es unterstützt außerdem eine Vielzahl von Anwendungen und Infrastrukturkomponenten, wodurch es vielseitig für verschiedene IT-Anforderungen einsetzbar ist.
Herausragende Funktionen und Integrationen:
Funktionen umfassen anpassbare Dashboards, mit denen Sie Leistungsdaten so visualisieren können, wie es Ihrem Team am besten passt. Automatisierte Benachrichtigungen stellen sicher, dass Sie sofort über auftretende Probleme informiert werden. Die Analyse historischer Daten hilft Ihnen dabei, Trends zu erkennen und die Ressourcenzuteilung zu planen.
Integrationen umfassen Microsoft Azure, AWS, VMware, Oracle, Microsoft SQL, PostgreSQL und mehr.
Pros and Cons
Pros:
- Agentenlose Überwachungslösung
- Benutzerfreundlichkeit
- Anpassbare Dashboards
Cons:
- Hoher Ressourcenverbrauch auf gehosteten Servern
- Veraltete und unübersichtliche Benutzeroberfläche
New Product Updates from ManageEngine Applications Manager
Oracle Cloud Application Monitoring Now Available in ManageEngine Applications Manager
ManageEngine Applications Manager introduces Oracle Cloud Application Monitoring, Oracle Cloud Function Monitoring, and Oracle Cloud NAT Gateway Monitoring. These new capabilities help teams monitor Oracle Cloud applications, serverless workloads, and network resources from a single platform. For more information, visit ManageEngine Applications Manager's official site.
 .
.Weitere Dynatrace-Alternativen
Hier sind einige weitere Dynatrace-Konkurrenten, die es nicht auf meine Kurzliste geschafft haben, aber dennoch einen Blick wert sind:rn


Auswahlkriterien für Dynatrace-Alternativen
Bei der Auswahl der besten Dynatrace-Alternativen für diese Liste habe ich gängige Bedürfnisse und Schmerzpunkte von Käufern in Bezug auf Datenbeobachtungsplattformen berücksichtigt, wie Skalierbarkeit und Integrationsmöglichkeiten. Außerden habe ich folgendes Framework genutzt, um meine Bewertung strukturiert und objektiv zu halten:
Kernfunktionalität (25% der Gesamtbewertung)
Um in diese Liste aufgenommen zu werden, musste jede Lösung folgende typische Anwendungsfälle abdecken:
- Anwendungsleistung überwachen
- Infrastrukturgesundheit nachverfolgen
- Echtzeit-Benachrichtigungen bereitstellen
- Log-Management anbieten
- Distributed Tracing unterstützen
Zusätzliche herausragende Funktionen (25% der Gesamtbewertung)
Um die Auswahl weiter zu verfeinern, habe ich zudem nach besonderen Merkmalen gesucht, wie:
- KI-gestützte Einblicke
- Anpassbare Dashboards
- Anomalieerkennung
- Erweiterte Analysen
- Automatisierte Ursachenanalyse
Benutzerfreundlichkeit (10% der Gesamtbewertung)
Um einen Eindruck von der Benutzerfreundlichkeit der einzelnen Systeme zu erhalten, habe ich Folgendes berücksichtigt:
- Leichte Navigation
- Intuitive Benutzeroberfläche
- Lernkurve
- Individualisierungsmöglichkeiten
- Zugänglichkeit über verschiedene Geräte hinweg
Onboarding (10% der Gesamtbewertung)
Um die Onboarding-Erfahrung der jeweiligen Plattform zu bewerten, habe ich Folgendes berücksichtigt:
- Verfügbarkeit von Trainingsvideos
- Interaktive Produkttouren
- Zugang zu Vorlagen
- Webinare und Live-Sitzungen
- Unterstützende Chatbots
Kundensupport (10% der Gesamtbewertung)
Um die Kundenserviceleistungen der Software-Anbieter zu prüfen, habe ich Folgendes berücksichtigt:
- Verfügbarkeit von Live-Chat
- Reaktionszeit bei Anfragen
- Zugang zu einer Wissensdatenbank
- Qualität der Support-Dokumentation
- Verfügbarkeit von 24/7-Support
Preis-Leistungs-Verhältnis (10% der Gesamtbewertung)
Um das Preis-Leistungs-Verhältnis der verschiedenen Plattformen zu beurteilen, habe ich Folgendes berücksichtigt:
- Transparenz der Preisgestaltung
- Verhältnis zwischen Funktionen und Kosten
- Verfügbarkeit von kostenlosen Testphasen
- Flexible Preismodelle
- Skalierbarkeit der Preise
Kundenbewertungen (10% der Gesamtbewertung)
Um einen Gesamteindruck der Kundenzufriedenheit zu gewinnen, habe ich beim Lesen der Kundenbewertungen Folgendes berücksichtigt:
- Bewertungen zur Zuverlässigkeit
- Kommentare zum Kundenservice
- Benutzerzufriedenheitsbewertungen
- Häufig gemeldete Probleme
- Allgemeine Empfehlungen der Nutzer
Warum nach einer Dynatrace-Alternative suchen?
Obwohl Dynatrace eine gute Wahl für Daten-Observability-Plattformen darstellt, gibt es eine Reihe von Gründen, warum manche Nutzer nach alternativen Lösungen suchen. Vielleicht suchen Sie eine Dynatrace-Alternative, weil…
- Sie sich wegen hoher Kosten Sorgen machen
- Ihrem Team ein einfacheres Onboarding benötigt
- Sie bessere Integrationsmöglichkeiten benötigen
- Sie ein flexibleres Preismodell suchen
- Sie Unterstützung für Nicht-Cloud-Umgebungen brauchen
- Sie mit Problemen bezüglich der geografischen Verfügbarkeit konfrontiert sind
Wenn einer dieser Punkte auf Sie zutrifft, sind Sie hier genau richtig. Meine Liste enthält mehrere Daten-Observability-Plattformen, die für Teams, die genau diese Herausforderungen mit Dynatrace haben, besser geeignet sind und nach alternativen Lösungen suchen.
Funktionen
Hier sind einige der wichtigsten Funktionen von Dynatrace, um Ihnen den Vergleich mit alternativen Lösungen zu erleichtern:
- OneAgent: Wird einmalig bereitgestellt, um Metriken über die gesamte Anwendungslieferkette zu sammeln und so die Datenerfassung zu vereinfachen.
- PurePath: Bietet eine detaillierte Analyse von Zeitabläufen und Code-Kontext für verteilte Traces und hilft, Leistungsdaten vom Nutzerklick bis zu den Backend-Diensten nachzuvollziehen.
- Skalierbare Datenaufnahme: Unterstützt verschiedene Datentypen wie Traces, Metriken, Logs und Schwachstellen und sorgt für eine umfassende Datenabdeckung.
- KI-gesteuerte Einblicke: Nutzt KI, um Probleme vorherzusagen, zu verhindern und bei deren Identifizierung zu unterstützen, wodurch die Effizienz Ihres Teams gesteigert wird.
- Automatisierte Prozesse: Vereinfachen das Entdecken, Analysieren und die tägliche Geschäftsabwicklung, wodurch manuelle Arbeit reduziert wird.
- Kontextuelle Analyse: Ermöglicht Ihrem Team, Datenzusammenhänge besser zu verstehen und dadurch bessere Entscheidungen zu treffen.
- Kollaborationstools: Fördern die Teamarbeit durch Integration mit verschiedenen Tools und Datenquellen.
- Sicherheitsfunktionen: Gewährleisten Datenschutz und Compliance auf Unternehmensebene zum Schutz der Unternehmensinformationen.
- Anpassbare Dashboards: Ermöglichen die Visualisierung von Daten in einem für Ihr Team passenden Format.
- Skalierbarkeit: Verarbeitet große Mengen an Daten aus unterschiedlichsten Quellen und wächst mit den Anforderungen Ihres Unternehmens.
Wie geht es weiter:
Wenn Sie gerade dabei sind, Data-Observability-Plattformen zu recherchieren, verbinden Sie sich mit einem SoftwareSelect-Berater für kostenlose Empfehlungen.
Sie füllen ein Formular aus und führen ein kurzes Gespräch, in dem Ihre spezifischen Anforderungen erfasst werden. Im Anschluss erhalten Sie eine Shortlist an Software-Lösungen zur Überprüfung. Die Berater begleiten Sie sogar durch den gesamten Kaufprozess, einschließlich Preisverhandlungen.