10 beste Tools zur Überwachung digitaler Erlebnisse für 2026

10 Die besten Tools zur Überwachung der digitalen Nutzererfahrung


Tools zur Überwachung der digitalen Nutzererfahrung (Digital Experience Monitoring, DEM) helfen Ihnen dabei, in Echtzeit nachzuverfolgen und zu optimieren, wie Nutzer mit Ihren digitalen Kanälen interagieren. Wenn Sie mit Leistungsproblemen, Kundenverlusten oder mangelnder Transparenz bei digitalen Nutzungswegen zu tun haben, können DEM-Tools Sie dabei unterstützen, Probleme schneller zu erkennen und ein reibungsloseres, zuverlässigeres Nutzererlebnis zu bieten.
In diesem Artikel greife ich auf meine Erfahrungen aus der Recherche und dem Test führender CX-Software zurück, um die besten Tools zur Überwachung der digitalen Nutzererfahrung zu bewerten, mit denen Sie die Zufriedenheit Ihrer Nutzer und die digitale Zuverlässigkeit optimieren können.
Warum Sie unseren Software-Bewertungen vertrauen können
Wir testen und bewerten seit 2020 Software. Als CX-Experten wissen wir, wie entscheidend – und schwierig – es ist, bei der Auswahl der passenden Software die richtige Entscheidung zu treffen. Wir investieren viel Zeit in gründliche Recherche, um unseren Lesern zu besseren Kaufentscheidungen zu verhelfen. Wir haben über 2.000 Tools für verschiedene CX-Anwendungsfälle getestet und mehr als 1.000 umfassende Software-Bewertungen verfasst. Erfahren Sie mehr darüber, wie wir transparent bleiben & unsere Software-Bewertungsmethodik.
Die 20 besten Tools zur Überwachung der digitalen Nutzererfahrung: Preisvergleich
Diese Vergleichstabelle fasst die wichtigsten Informationen zu jeder meiner Top-Auswahl an Software für die Überwachung digitaler Nutzererfahrungen zusammen. Sie können Preisdetails sowie Informationen zu kostenlosen Testversionen oder Demos auf einen Blick vergleichen, um das beste Tool für Ihr Budget und Ihre geschäftlichen Anforderungen zu finden.
| Tool | Best For | Trial Info | Price | ||
|---|---|---|---|---|---|
| 1 | Am besten für Echtzeit-Website-Monitoring | Kostenlose Testversion + Demo verfügbar | Ab $9/Monat (jährliche Abrechnung) | Website | |
| 2 | Am besten geeignet für gezielte Umfragen basierend auf spezifischen Auslösern | 14-tägige kostenlose Testphase + kostenloser Tarif + kostenlose Demo verfügbar | Ab $25/Monat (jährliche Abrechnung) | Website | |
| 3 | Am besten geeignet für Echtzeit-Einblicke in das Nutzerverhalten | Kostenlose Demo verfügbar | Preise auf Anfrage | Website | |
| 4 | Am besten geeignet für Betriebszeit- und Leistungsüberwachung von Webanwendungen | 30-tägige kostenlose Testversion + Demo verfügbar | Ab $10/Monat | Website | |
| 5 | Am besten für Echtzeit-Session-Replay | Kostenlose Demo verfügbar | Preise auf Anfrage | Website | |
| 6 | Am besten für Application Performance Management geeignet | Kostenlose Testversion verfügbar | Preis auf Anfrage | Website | |
| 7 | Am besten geeignet für Software-Analysen | Kostenloser Tarif + kostenlose Demo verfügbar | Preise auf Anfrage | Website | |
| 8 | Am besten geeignet für End-to-End-Diagnostik von Code bis zur Benutzersitzung | 14-tägige kostenlose Testphase + Demo verfügbar | Ab $40/100.000 Fehler/Monat (jährliche Abrechnung) | Website | |
| 9 | Am besten für das Customer Success Management geeignet | Kostenlose Demo verfügbar | Preis auf Anfrage | Website | |
| 10 | Am besten geeignet zur Beobachtung echter Endnutzer-Schritte, Erlebnisse und Engpässe | Kostenlose Demo + kostenlose Testphase verfügbar | Preis auf Anfrage | Website |
-

SupportYourApp
Visit WebsiteThis is an aggregated rating for this tool including ratings from Crozdesk users and ratings from other sites.4.7 -
Tidio
Visit WebsiteThis is an aggregated rating for this tool including ratings from Crozdesk users and ratings from other sites.4.7 -
Freshdesk
Visit WebsiteThis is an aggregated rating for this tool including ratings from Crozdesk users and ratings from other sites.4.4


Übersichten der 20 besten Tools zur Überwachung der digitalen Nutzererfahrung
Um Ihnen bei der Auswahl des passenden Überwachungstools zu helfen, habe ich detaillierte Zusammenfassungen meiner 20 Favoriten erstellt und erläutere, warum ich jede Option aufgenommen habe. Außerdem hebe ich ihre bemerkenswerten Funktionen, Stärken & Schwächen sowie beste Anwendungsfälle hervor, damit Sie die beste Wahl für Ihren Bedarf treffen können.
Zusätzlich finden Sie unten weitere Alternativen, falls Sie noch mehr Tools in Betracht ziehen möchten.
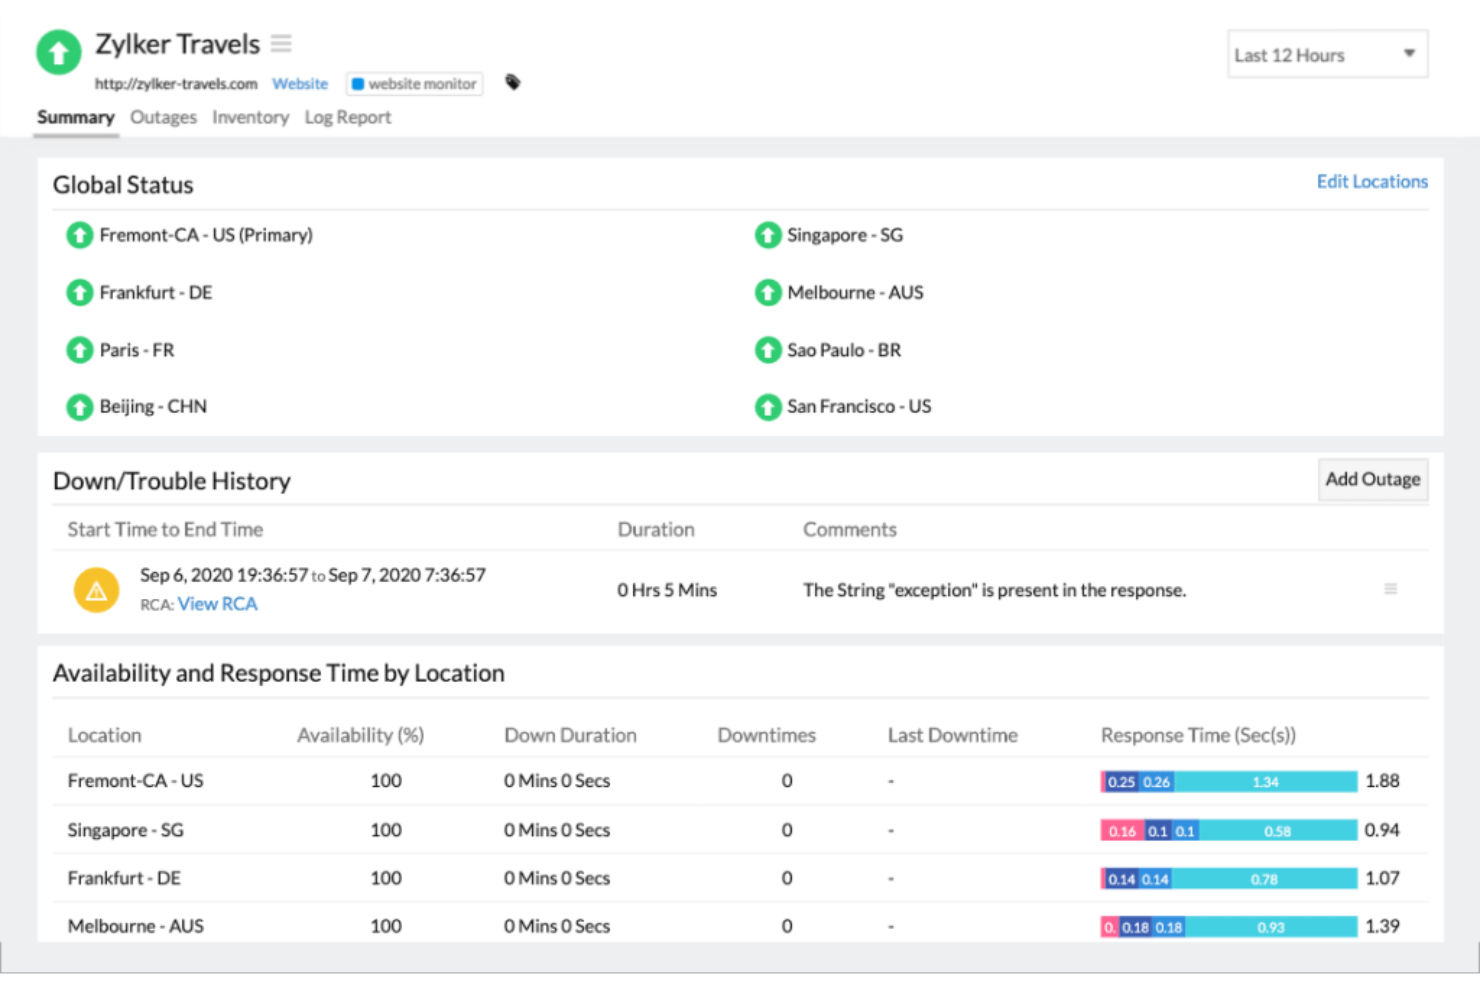
Site24x7 bietet eine dynamische Lösung, die speziell für Unternehmen entwickelt wurde, die Benutzerinteraktionen und Anwendungsleistung optimieren möchten. Dieses Tool liefert Echtzeit-Einblicke durch synthetisches und echtes Benutzer-Monitoring, adressiert Performance-Herausforderungen und sorgt für nahtlose digitale Abläufe. Dank umfassender Integrationsmöglichkeiten und dem Fokus auf Nutzerzufriedenheit hebt sich Site24x7 als vielseitige Wahl für IT-Teams hervor, die digitale Umgebungen proaktiv managen und verbessern möchten.
Warum ich Site24x7 gewählt habe
Ich habe Site24x7 aufgrund seiner unerreichten Echtzeit-Website-Monitoring-Fähigkeiten gewählt, die für Unternehmen, die optimale digitale Erlebnisse sicherstellen möchten, entscheidend sind. Die Funktion des synthetischen Monitorings ermöglicht es, Benutzerinteraktionen zu simulieren und Transaktionsabläufe zu überwachen, wodurch detaillierte Einblicke in Leistungsengpässe gewonnen werden. Darüber hinaus bietet das Echtzeit-Benutzer-Monitoring (RUM) eine umfassende Sicht auf die tatsächlichen Nutzererfahrungen auf Web- und Mobilplattformen, sodass Sie Probleme, die die Kundenzufriedenheit beeinträchtigen, gezielt beheben können. Mit dem globalen Monitoring von über 130 Standorten stellt Site24x7 sicher, dass die Verfügbarkeit und Leistung Ihrer Website kontinuierlich überwacht werden – ein unverzichtbares Werkzeug für alle, die ihre digitale Präsenz stärken möchten.
Site24x7 Hauptfunktionen
Zusätzlich zu den Echtzeit-Website-Monitoring-Fähigkeiten bietet Site24x7 eine Reihe von Funktionen, die das Monitoring des digitalen Erlebnisses verbessern.
- Log-Management: Zentralisiert die Protokollerfassung und -analyse und bietet einen effizienten Ansatz zur Fehlerbehebung und Identifizierung von Problemen innerhalb Ihrer digitalen Infrastruktur.
- Netzwerküberwachung: Bietet eine umfassende Überwachung der Netzwerkleistung, einschließlich Konfigurations- und IP-Management, sodass Ihr Netzwerk gesund und effizient bleibt.
- Application Performance Monitoring (APM): Liefert Einblicke in die Anwendungsintegrität und Benutzerpfade und unterstützt Sie dabei, Nutzererfahrungen auf verschiedenen Plattformen zu verstehen und zu verbessern.
- AIOps: Nutzt künstliche Intelligenz zur Anomalieerkennung und IT-Automatisierung, damit Ihr Team potenzielle Probleme proaktiv angehen kann, bevor sie sich auf das Nutzererlebnis auswirken.
Site24x7 Integrationen
Integration unter anderem mit ServiceNow, PagerDuty, Jira, Slack, Microsoft Teams, Zoho Flow, Zapier, Opsgenie, ManageEngine und Freshdesk.
Pros and Cons
Pros:
- All-in-One-Plattform für vielfältige Monitoring-Funktionen
- Benutzerfreundliche Oberfläche erleichtert Navigation und Dateninterpretation
- KI-gestützte Anomalieerkennung verbessert die proaktive Problemerkennung
Cons:
- Eingeschränkter Offline-Zugriff auf Monitoringdaten beeinträchtigt die Flexibilität
- Komplexe Datenaufbereitung kann für Nicht-Techniker herausfordernd sein
New Product Updates from Site24x7
Site24x7 Adds Synchronization Statuses for MSPs
Site24x7 now provides MSPs enhanced alerts and synchronization statuses in a centralized notification center to spot configuration sync issues sooner and accelerate incident response. For more information, visit Site24x7's official site.

Hotjar
Am besten geeignet für gezielte Umfragen basierend auf spezifischen Auslösern
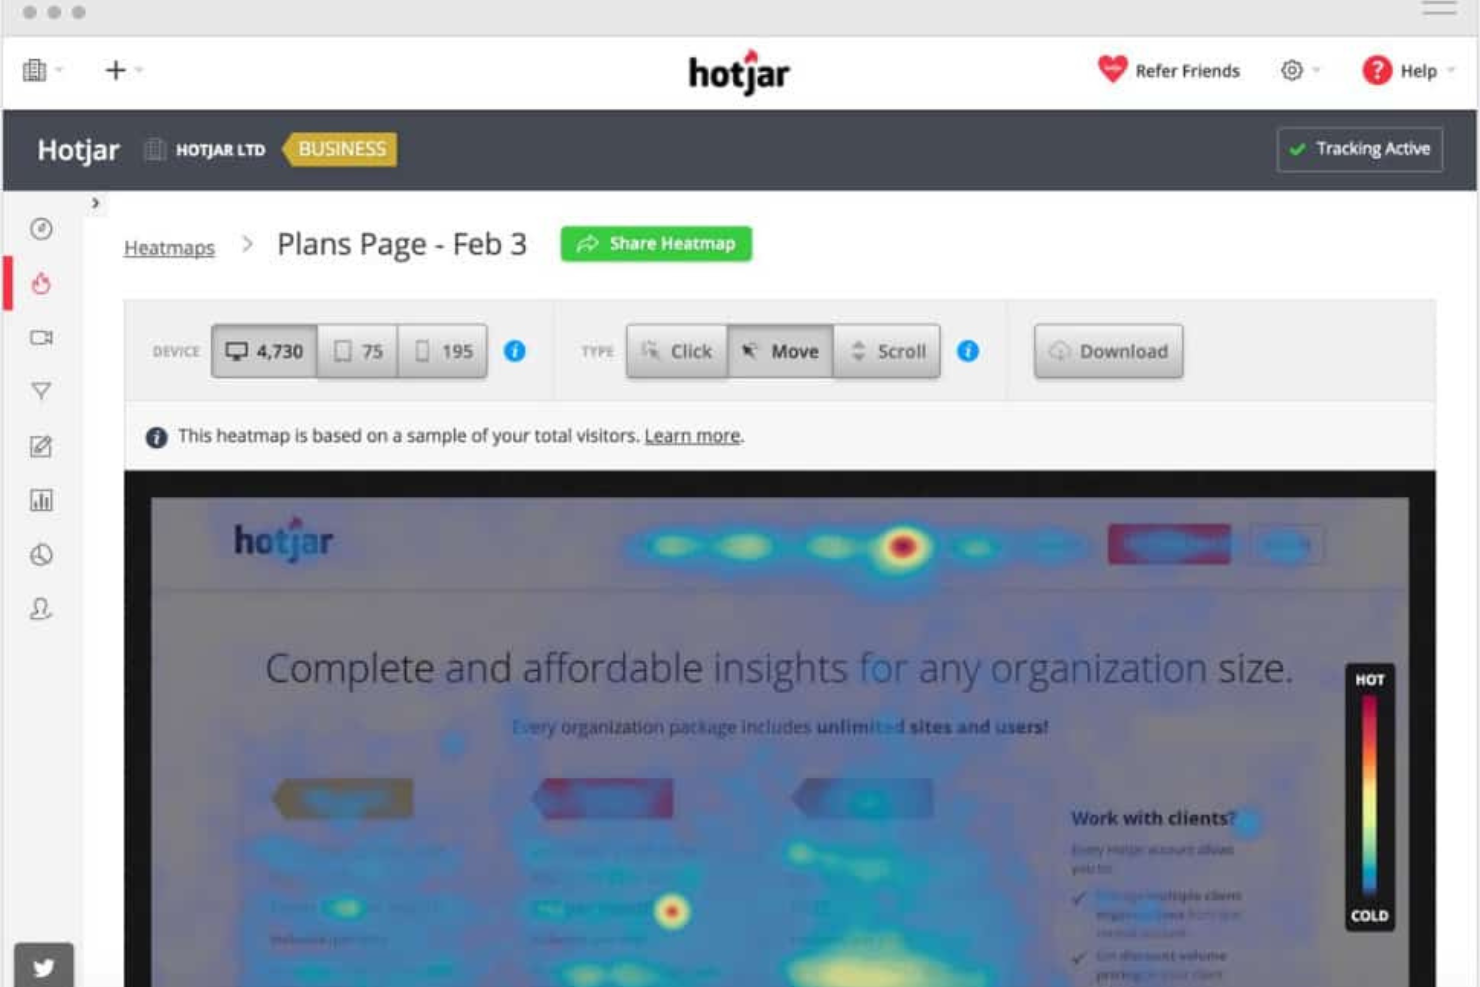
Mouseflow ist ein Tool zur Verhaltensanalyse, das Unternehmen dabei hilft, Nutzungstrends zu erkennen und auszuwerten. Durch die Erfassung detaillierter Nutzerdaten ermöglicht Mouseflow Einblicke, wie Nutzer mit Websites und Anwendungen interagieren. Es bietet eine Vielzahl von Funktionen, einschließlich Session Replay, Heatmaps, Trichteranalysen, Formularanalysen und Tools für Nutzerfeedback.
Warum ich Mouseflow gewählt habe: Das Nutzerfeedback-Tool ist darauf ausgelegt, in Echtzeit Rückmeldungen von Benutzern über gezielte Umfragen und Befragungen einzuholen. Mit dieser Funktion können Unternehmen wertvolle Einblicke direkt von ihrer Zielgruppe sammeln, was das Verständnis für die Bedürfnisse und Vorlieben der Benutzer erleichtert. Die intuitive Benutzeroberfläche von Mouseflow ermöglicht die Erstellung verschiedener Umfragearten, darunter Multiple-Choice-Fragen, Bewertungsskalen und offene Fragen.
Mir gefällt außerdem, dass das Nutzerfeedback-Tool von Mouseflow Umfragen basierend auf dem Nutzerverhalten auslösen kann. Das bedeutet, dass Unternehmen Umfragen so einrichten können, dass sie zu bestimmten Momenten während der Nutzerreise erscheinen — etwa nach dem Abschluss eines Kaufs oder wenn ein Warenkorb abgebrochen wird.
Was gibt es kostenlos? Mouseflow bietet einen kostenlosen Tarif, der viele der Kernfunktionen enthält. Darüber hinaus gibt es eine 14-tägige Testphase, die sowohl Basis- als auch erweiterte Funktionen umfasst, wie 500 Sitzungen, 1 Website-Projekt und Zugriff auf Heatmaps, Trichter, Formulare und Feedback.
Herausragende Funktionen & Integrationen:
Funktionen umfassen Session Replay, Heatmaps, Trichteranalysen, Formular-Analysen, Seiten-zu-Seiten-Tracking, Fehlerverfolgung, Mapping der Nutzerreise, Feedback-Widgets, Klick- und Scroll-Tracking, erweiterte Filterfunktionen, Echtzeitüberwachung und Optionen zum Datenexport.
Integrationen umfassen Omniconvert, Adobe Target, AB Tasty, Convert Experiences, BigCommerce, WooCommerce, Shopify, Intercom, HubSpot, Google Analytics, Google Tag Manager, Zendesk, WordPress, Wix, Kissmetrics und weitere.
Pros and Cons
Pros:
- Gute Sitzungsaufzeichnung und Heatmap-Funktionen
- Aussagekräftige Formularanalysen
- Möglichkeit, das Verhalten über die gesamte Nutzerreise hinweg zu verfolgen
Cons:
- Fehlende A/B-Testfunktionen
- Könnte mehr Anpassungsmöglichkeiten bieten
Am besten geeignet für Echtzeit-Einblicke in das Nutzerverhalten
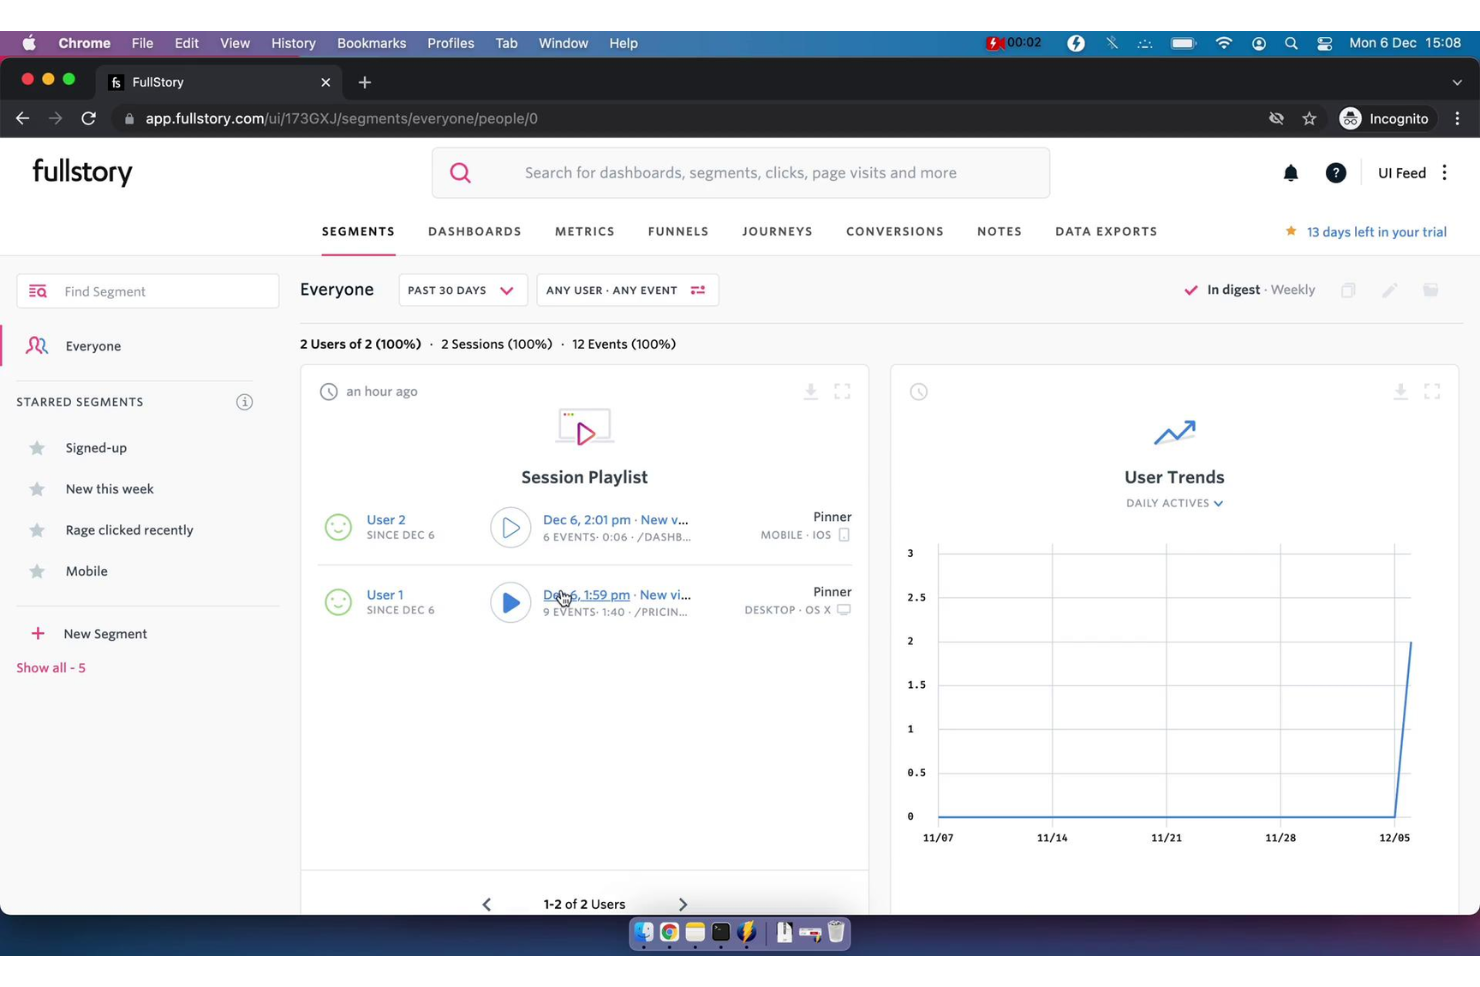
FullStory ist eine Plattform zur Analyse von Verhaltensdaten, die Unternehmen Einblicke in Nutzerinteraktionen und -stimmungen durch Echtzeit-Datenvisualisierung bietet. Sie hilft Technologieverantwortlichen, bessere, fundiertere und kundenorientierte Entscheidungen zu treffen, indem sie digitale Verhaltensdaten in den Analytics-Stack integriert und qualitativ hochwertige Verhaltensdaten in großem Umfang bereitstellt.
Warum ich FullStory gewählt habe: Meiner Meinung nach sticht FullStory durch sein fortschrittliches Funktionspaket hervor, das darauf ausgelegt ist, das Benutzererlebnis zu verbessern und umsetzbare Erkenntnisse zu liefern. Eines der wichtigsten Merkmale ist die Produktanalyse, die es Unternehmen ermöglicht, mithilfe intuitiver Dashboards und Funnel-Analysen tief in Nutzerinteraktionen einzutauchen. Indem jeder digitale Besuch in verwertbare Erkenntnisse umgewandelt wird, ermöglicht es Unternehmen, näher an ihre Kunden heranzurücken und Verhaltensweisen wie Betrug oder die Aktivitäten von umsatzstarken Kunden effektiver zu erkennen.
Eine weitere herausragende Lösung ist die Verhaltensanalyse. Diese Funktion bietet eine Überwachung der Nutzerinteraktionen in Echtzeit und einen detaillierten Einblick, wie Nutzer sich durch digitale Produkte bewegen und damit interagieren. Solche Erkenntnisse sind entscheidend, um Nutzerfrustrationen zu erkennen und zu beheben, was wiederum zu höheren Konversionsraten und einer verbesserten Kundenzufriedenheit führen kann.
Hervorstechende Funktionen & Integrationen:
Funktionen umfassen Produktanalysen, Mobile Analytics, Verhaltensanalysen, Sitzungswiedergabe, Heatmaps, Funnels und Konversionen, Journey Mapping und direkten Datenzugriff.
Integrationen umfassen Slack, HubSpot, Google Sheets, Intercom, Jira, CopperCRM, Notion, monday.com und Pipedrive.
Pros and Cons
Pros:
- Fortgeschrittene Sitzungswiedergabe
- Datenanalysen und Berichte
- Effektive Unterstützung für Produktteams
Cons:
- Ungenaue Einschätzung von Funktionspotenzialen
- Schwierigkeiten bei der Sitzungsfindung
- Begrenzter Datentransfer
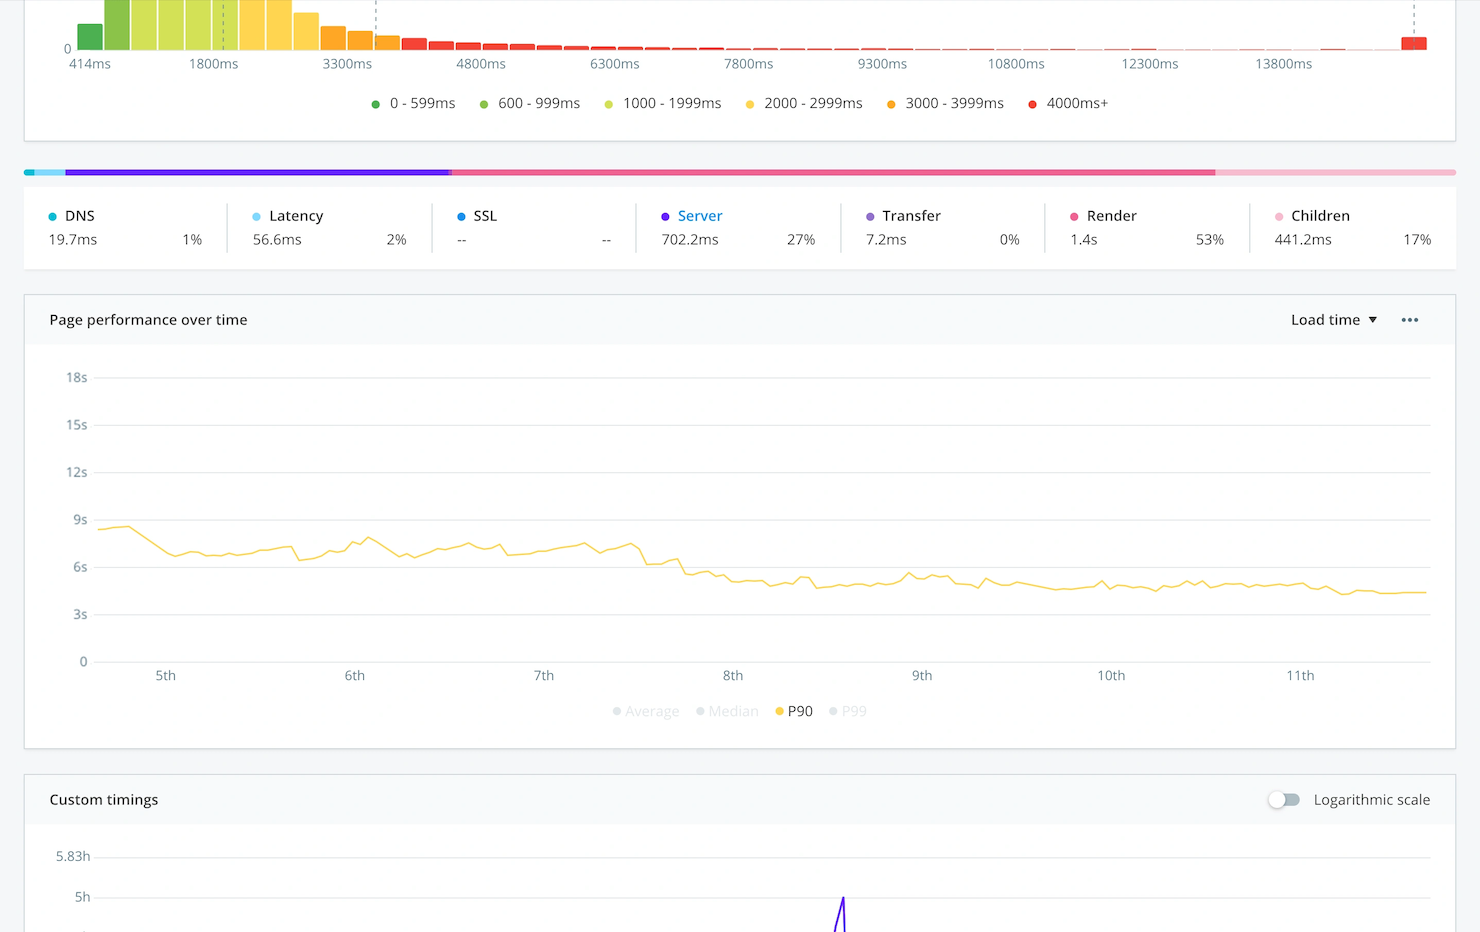
Pingdom
Am besten geeignet für Betriebszeit- und Leistungsüberwachung von Webanwendungen
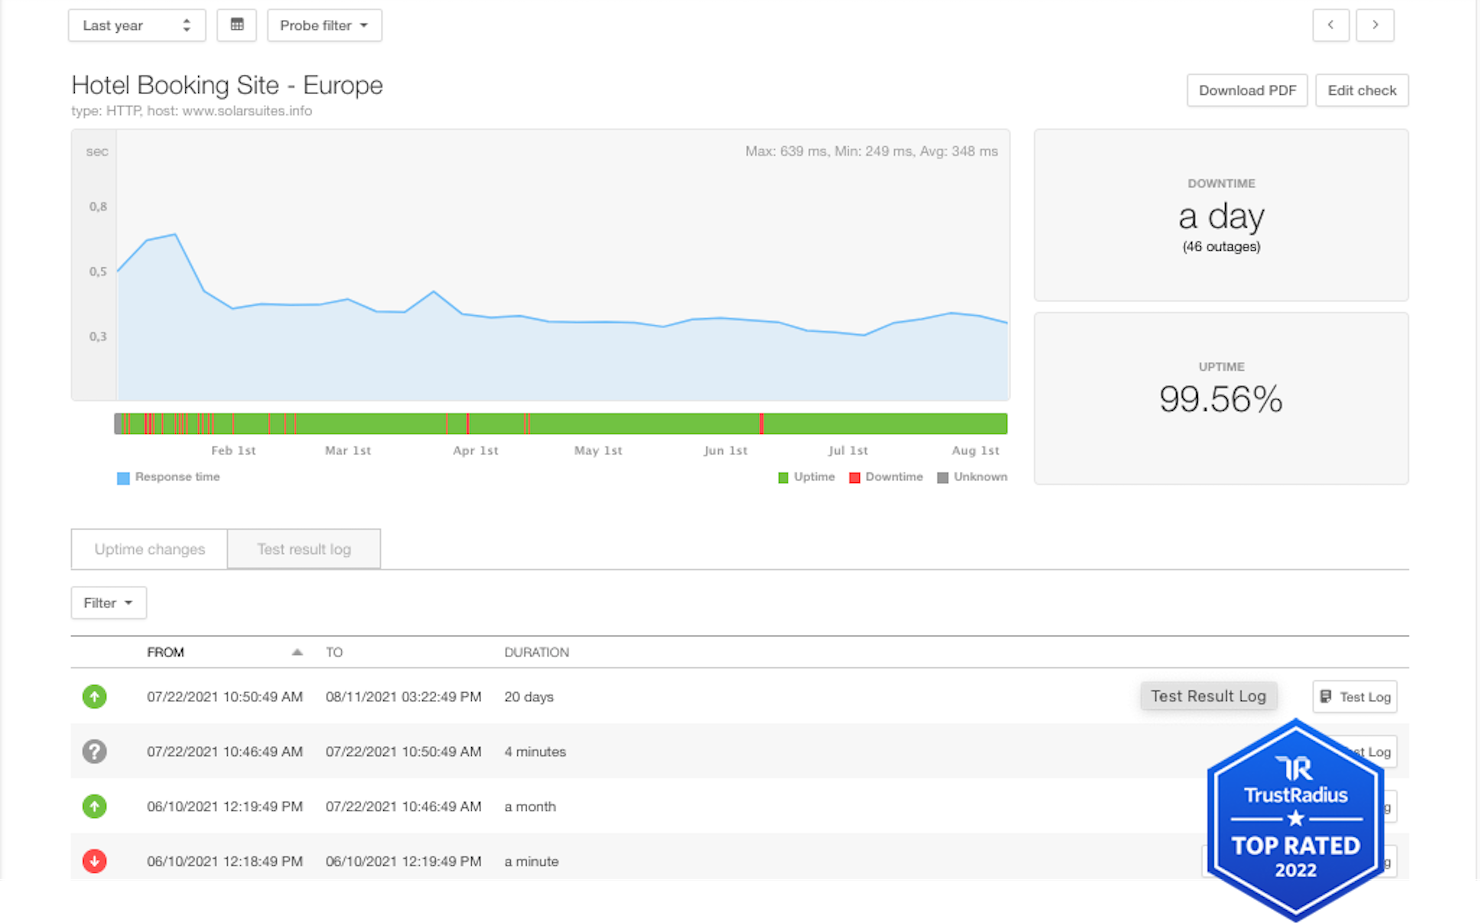
Pingdom verschafft Ihrem Team Einblick in die Verfügbarkeit und Leistung von Webanwendungen, Servern und Endpunkten weltweit. Es hilft dabei, Ausfallzeiten zu erkennen, die Seitenladeleistung zu messen und zu benachrichtigen, wenn die Benutzererfahrung leidet.
Warum ich Pingdom gewählt habe: Ich habe Pingdom ausgewählt, weil Betriebszeit und Reaktionszeit grundlegend für das digitale Erlebnis sind und dieses Tool eine praxisnahe Leistungsüberwachung von mehreren globalen Standorten aus bietet. Wenn Ihre Website oder Web-App das Eingangstor für Kunden ist, ist es entscheidend, sofort zu wissen, wenn sie langsamer wird oder ausfällt.
Herausragende Funktionen & Integrationen
Funktionen beinhalten synthetische Prüfungen von Webseiten in kurzen Intervallen, Real-User-Monitoring (RUM) der Seitenladegeschwindigkeit, globale Benachrichtigungen zur Information von Teams über Verfügbarkeitsprobleme und Performance-Trend-Dashboards, die Verlangsamungen mit Regionen oder Geräten verknüpfen.
Integrationen umfassen Slack, PagerDuty, E-Mail/SMS-Benachrichtigungen, API-Zugriff und die Anbindung an SolarWinds Log-Management.
Pros and Cons
Pros:
- Synthetische Prüfungen erkennen Ausfallzeiten und Verlangsamungen
- Einfach einstellbare Alarm-Schwellenwerte zur Benachrichtigung der zuständigen Teams
- Real-User-Monitoring liefert tatsächlichen Leistungskontext
Cons:
- Tiefgehende Code-Level-Diagnostik (APM) ist nicht enthalten
- Individuelle Dashboards und Visualisierungsoptionen können einfach wirken
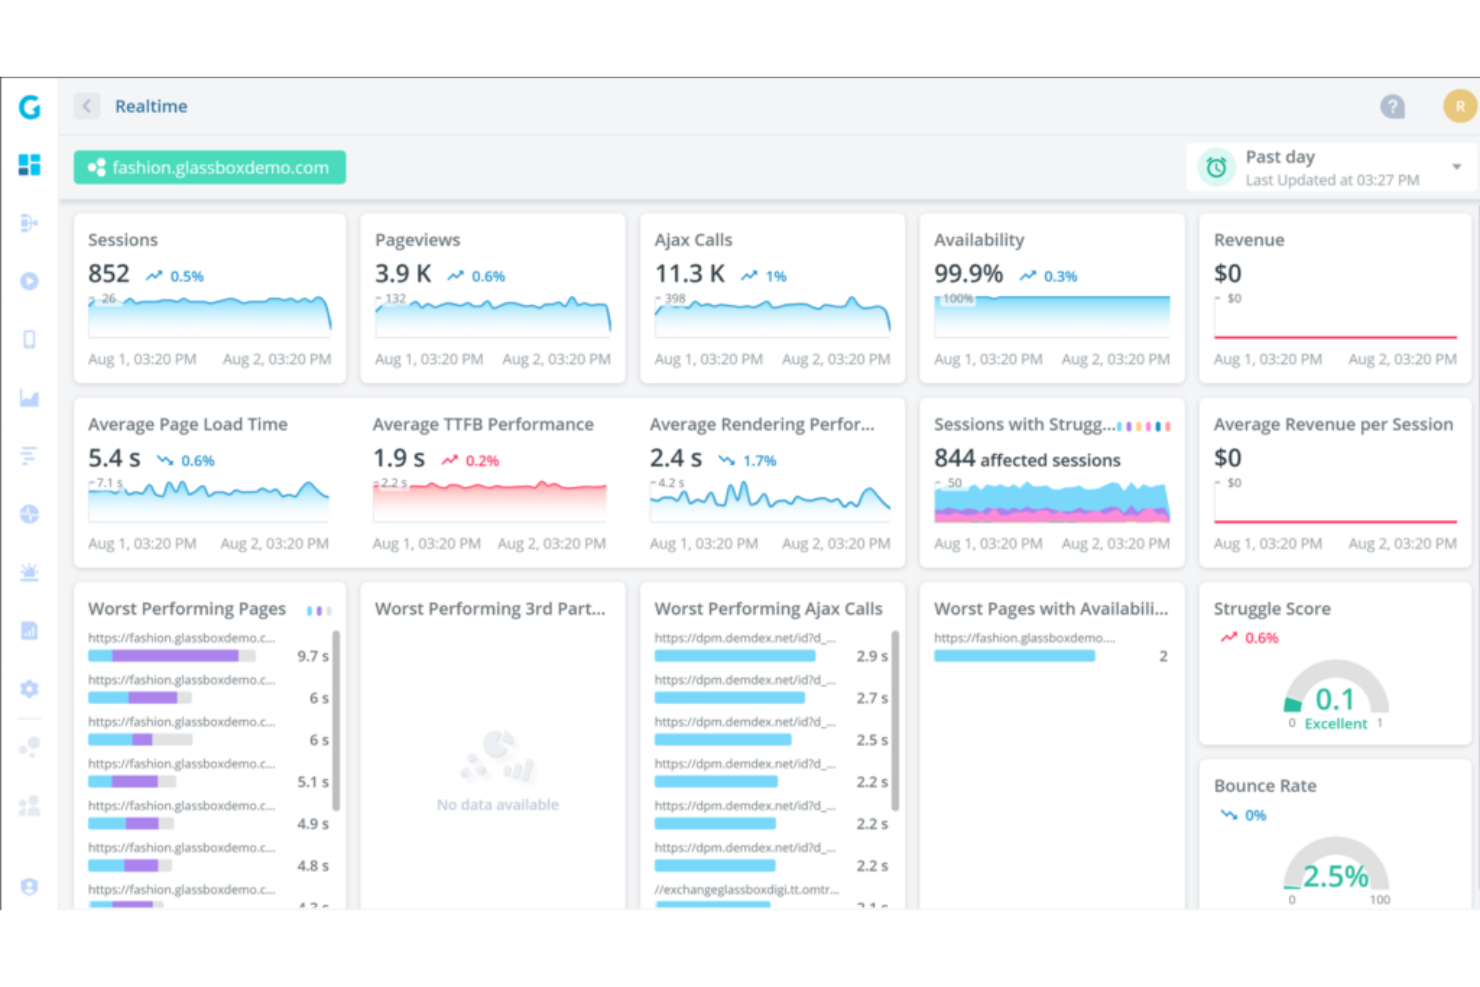
Glassbox ist eine Plattform zur Analyse digitaler Nutzererlebnisse, die Echtzeit-Aufzeichnungen von Sitzungen bereitstellt, um Unternehmen beim Verstehen des Nutzerverhaltens zu unterstützen. Die Fähigkeit, detaillierte Einblicke in Kundeninteraktionen auf Apps und Websites zu bieten, macht sie zu einem unverzichtbaren Tool für Unternehmen, die den Fokus auf die Optimierung der Kundenerfahrung legen.
Warum ich Glassbox gewählt habe: Ich habe Glassbox aufgrund seiner starken Möglichkeiten ausgewählt, Nutzersitzungen beim Interagieren mit einer Website oder mobilen App aufzuzeichnen. Die Session-Replay-Funktion ermöglicht es Unternehmen anschließend, diese Sitzungen optisch nachzuvollziehen – mit einer pixelgenauen Wiedergabe der Benutzeraktionen, einschließlich Mausbewegungen, Klicks, Formulareingaben und Scrollverhalten.
Session-Replay ist außerdem in Echtzeit verfügbar, sodass Unternehmen die Nutzer-Sessions verfolgen können, während sie stattfinden. Durch das Beobachten, wie Nutzer in Echtzeit mit einer Website oder App interagieren, können Unternehmen wertvolle Informationen über Engagement, Interessen und die Interaktion mit bestimmten Elementen oder Funktionen sammeln. Diese Fähigkeit zur Aufdeckung von Verhaltensmustern hebt Glassbox von vielen anderen Werkzeugen am Markt ab.
Herausragende Funktionen & Integrationen:
Funktionen umfassen User-Journey-Mapping, Kollaborations- und Sharing-Funktionen, Analyse von Conversion-Funnels sowie Identifikation und Behebung von Problemen. Glassbox sorgt zudem für Datenschutz und Compliance, indem Unternehmen sensible Informationen während der Sitzungswiedergabe ausblenden oder ausschließen können.
Integrationen beinhalten Adobe Analytics, Google Analytics, GetFeedback, SurveyMonkey, Qualtrics, Medallia, Jira, Slack, Adobe Target und Optimizely.
Pros and Cons
Pros:
- Funnels sind durchsuchbar und einfach zu bedienen
- Business-Flow-Funktion hilft bei der Verfolgung von KPIs
- Bietet leistungsstarke Analysen
Cons:
- Keine transparente Preisstruktur
- Möglicherweise nicht für kleinere Unternehmen skalierbar
- Erfordert eine gewisse Einarbeitung zur vollständigen Nutzung aller Funktionen
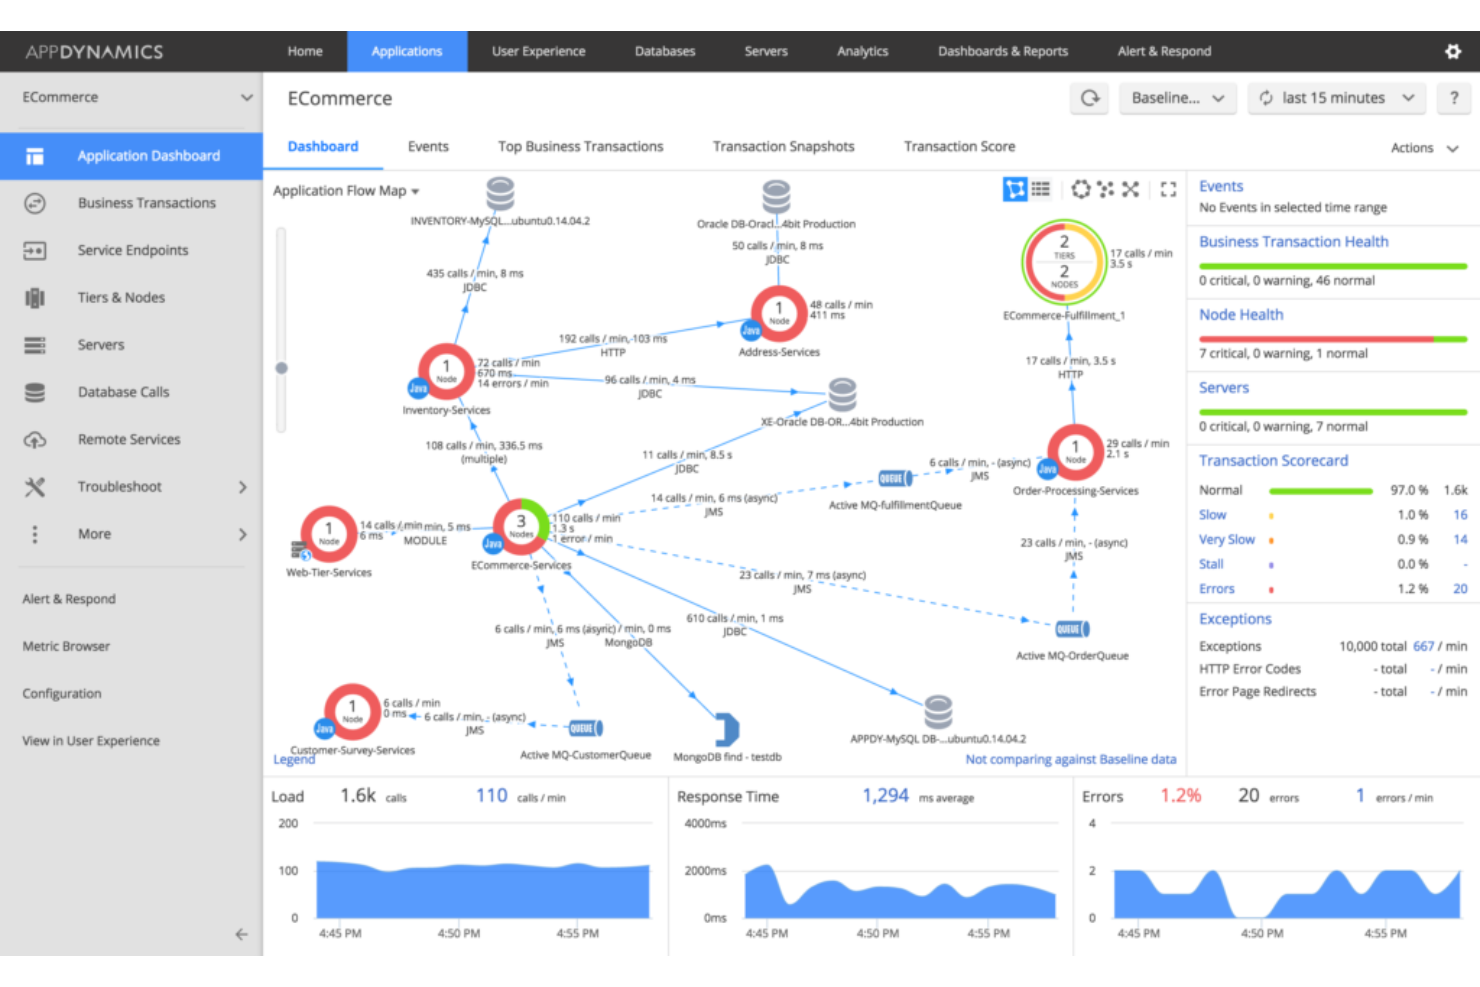
AppDynamics, ein Teil von Cisco, ist ein DEM-Lösungsanbieter, der sich auf die Überwachung von Endbenutzern (EUM) und die Nachverfolgung von Geschäftsprozessen konzentriert. Außerdem bietet es ein umfassendes Application Performance Management (APM), um Unternehmen dabei zu unterstützen, die optimale Anwendungsleistung sicherzustellen.
Warum ich AppDynamics gewählt habe: AppDynamics steht auf meiner Liste wegen seines umfassenden Schwerpunkts auf Application Performance Management (APM) und seinem klaren Fokus auf die Endbenutzererfahrung sowie Trendanalysen. AppDynamics bietet beispielsweise Echtzeit-Einblicke in Anwendungsleistungsmetriken, Transaktionsverfolgung, Diagnosen auf Code-Ebene und Datenbanküberwachung. Dadurch können Organisationen Leistungsengpässe, ineffizienten Code und datenbankbezogene Probleme identifizieren, die die Anwendungsleistung beeinflussen.
AppDynamics ist außerdem dafür ausgelegt, groß angelegte, verteilte Umgebungen zu verwalten. Es kann Anwendungen server-, container- und cloudübergreifend überwachen, einschließlich Web-, Mobil- und Desktopplattformen. Das verschafft Einblick in die Leistung verteilter Komponenten und ermöglicht Unternehmen, die Leistung in komplexen und dynamischen Architekturen zu optimieren.
Hauptfunktionen & Integrationen:
Funktionen umfassen Ende-zu-Ende-Transaktionsverfolgung, Benachrichtigungen und proaktive Problemidentifikation, Cloud- und Microservice-Überwachung sowie dynamische Baseline-Bildung. AppDynamics ermöglicht außerdem die Überwachung und Nachverfolgung wichtiger Geschäftsprozesse innerhalb von Anwendungen. Es kann Einblicke in den Transaktionsfluss, Antwortzeiten und Leistungsmetriken liefern.
Integrationen umfassen Medallia, Moogsoft Platform, Contentsquare, Zenduty, SquaredUp, ThousandEyes, Sainapse, Squadcase, Atlassian und Slack.
Pros and Cons
Pros:
- Einfache, übersichtliche Benutzeroberfläche
- Bietet anpassbare Alarm-Schwellenwerte
- Stellt leicht verständliche Grafiken und visuelle Daten bereit
Cons:
- Kann für Einsteiger komplex sein
- Die Nachverfolgung von Geschäftsprozessen kann langsam sein
- Fortgeschrittene Funktionen erfordern eine steile Lernkurve
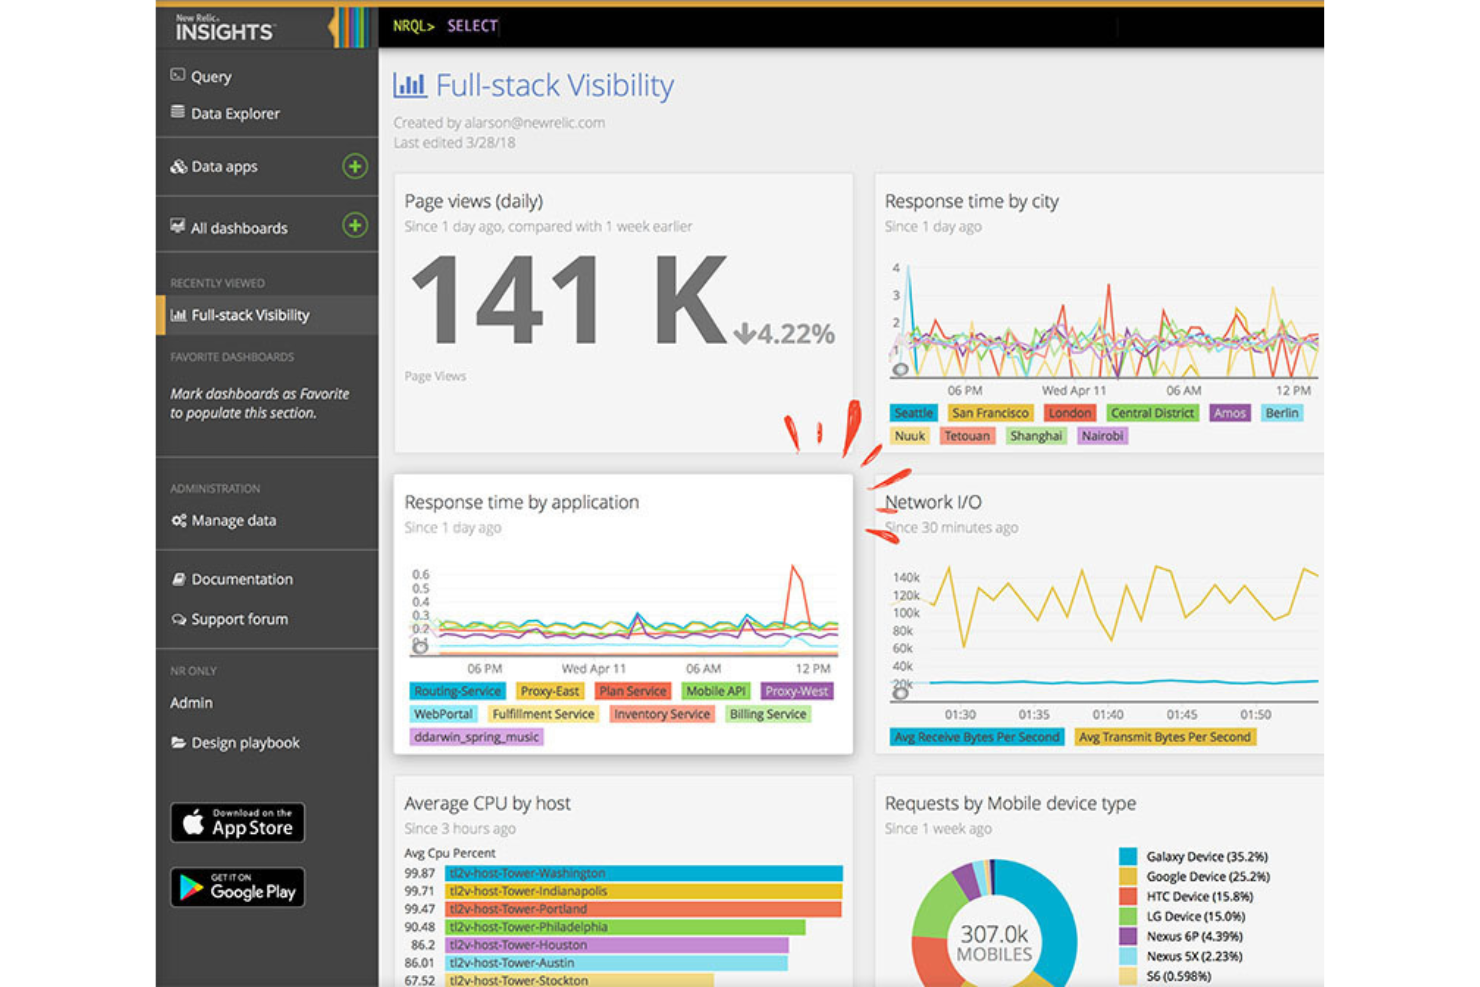
New Relic ist eine Observability-Plattform, die vollständige Transparenz über den gesamten Stack und umfassende Software-Analysen ermöglicht. Mit einem datengesteuerten Ansatz hilft sie Unternehmen, die Leistung ihrer Software zu verstehen und zu verbessern. Aufgrund ihrer tiefgreifenden Analysefähigkeiten ist New Relic ideal für alle, die Einblicke in ihre Softwaresysteme suchen.
Warum ich New Relic ausgewählt habe: New Relic steht auf dieser Liste wegen seiner umfassenden Fähigkeit, Softwaredaten zu erfassen, zu analysieren und zu interpretieren. Besonders hervorzuheben ist der 360-Grad-Blick auf die Softwareleistung, der entscheidend ist, um Probleme zu identifizieren und das Nutzererlebnis zu verstehen. Beispielsweise ermöglicht die verteilte Tracing-Funktion von New Relic, Anfragen nachzuverfolgen, während sie verschiedene Dienste und Komponenten in einem verteilten System durchlaufen. Das bietet vollständige Transparenz über Anfragepfade, Latenzzeiten und Abhängigkeiten.
New Relic bietet außerdem Überwachungsfunktionen für mobile Anwendungen, mit denen Sie die Leistung und das Nutzererlebnis Ihrer mobilen Apps auf verschiedenen Plattformen und Geräten überwachen können. Sie können Metriken wie App-Abstürze, Reaktionszeiten und Nutzerinteraktionen verfolgen, um die Performance und Benutzerfreundlichkeit Ihrer mobilen Anwendungen zu optimieren.
Herausragende Funktionen & Integrationen:
Funktionen beinhalten Echtzeit-Analysen, End-to-End-Transaktions-Tracking, synthetische Überwachung, Infrastrukturüberwachung, Application Performance Monitoring (APM) sowie anpassbare Dashboards. Es gibt zudem Funktionen für Softwarediagnose wie Fehlerverfolgung, Performance-Insights und Datenvisualisierung.
Integrationen gibt es unter anderem für AWS, Microsoft Azure, Google Cloud Platform (GCP), Kubernetes, Prometheus, Cassandra, Elasticsearch, HiveMQ, Kafka und Linux.
Pros and Cons
Pros:
- Workload-Funktionen helfen, Dienste effizient zu gruppieren
- Bietet Echtzeitdaten für sofortige Einblicke
- Skalierbar für kleine Teams und große Unternehmen
Cons:
- Offizielle Dokumentation ist begrenzt
- Erfordert gewisse technische Kenntnisse für die optimale Nutzung
- Die Benutzeroberfläche kann für Einsteiger komplex sein
Raygun
Am besten geeignet für End-to-End-Diagnostik von Code bis zur Benutzersitzung
Raygun hilft Ihrem Team, Softwareleistungsprobleme in Anwendungen, Services und Benutzersitzungen zu erkennen, zu diagnostizieren und zu beheben. Es hebt Fehler, Verlangsamungen und Abstürze in Echtzeit hervor, sodass Sie die Ursachen nachvollziehen und die Benutzererfahrung verbessern können.
Warum ich Raygun gewählt habe: Ich habe Raygun gewählt, weil es Application Performance Monitoring (APM) und Fehlerverfolgung in einem Tool vereint – ideal, wenn Entwicklungs- und Betriebsteams gemeinsam für die Nutzererfahrung verantwortlich sind. Es bietet Diagnostik über den gesamten Lebenszyklus hinweg – von Codefehlern, Sitzungsverfolgung bis zur Release-Überwachung – und ermöglicht so eine schnellere Problemlösung.
Herausragende Funktionen & Integrationen:
Funktionen beinhalten plattformübergreifendes Crash- und Fehlerreporting, Sitzungsverfolgung, mit der sich die Nutzerreise bis zum Fehler nachvollziehen lässt, Erfassung von Leistungsmetriken (wie langsame Anfragen oder Speichernutzung) und Release-/Deployment-Tracking, sodass Sie wissen, wann Probleme anfingen.
Integrationen umfassen GitHub, GitLab, Jira, Slack, Azure DevOps, AWS, SAML SSO, Webhooks und REST API.
Pros and Cons
Pros:
- Erfasst Fehler auf Code-Ebene und Kontext von Benutzersitzungen
- Spürt Leistungsprobleme über Backend, Browser und Mobilgeräte hinweg auf
- Integriert sich eng in Entwicklungstools und Benachrichtigungsabläufe
Cons:
- UX- und Dashboard-Design wirken eher entwicklerorientiert und weniger benutzerfreundlich
- Erweiterte Einrichtung und Feinabstimmung können Entwicklerressourcen erfordern
Totango ist eine Customer Success Plattform, die darauf ausgelegt ist, Echtzeit-Einblicke in das Kundenverhalten zu liefern. Sie unterstützt Unternehmen beim Customer Success Management, indem sie die Kundenbindung fördert, die Abwanderung reduziert und den Kundenertragswert maximiert.
Warum ich Totango gewählt habe: Ich habe Totango für diese Liste ausgewählt, weil es komplexe Customer Success-Prozesse mit einem proaktiven und zielorientierten Ansatz zur Verwaltung von Kundenbeziehungen vereinfacht. Totango stellt beispielsweise Werkzeuge zur Verfügung, mit denen Unternehmen proaktiv mit Kunden in Kontakt treten können. Dadurch werden personalisierte und automatisierte Kommunikationsmöglichkeiten wie In-App-Nachrichten, E-Mails und Benachrichtigungen ermöglicht, um Kundenbeziehungen zu pflegen, Support zu leisten und gewünschte Handlungen zu fördern.
Totango ermöglicht es Unternehmen zudem, die Gesundheit und das Engagement ihrer Kunden zu überwachen. Es verfolgt verschiedene Kennzahlen und Signale, um die Kundenzufriedenheit, die Produktakzeptanz und Nutzungsmuster zu bewerten. Dies hilft Organisationen, gefährdete Kunden zu identifizieren und proaktiv Maßnahmen zu ergreifen, um Abwanderung zu verhindern und Upselling-Möglichkeiten zu nutzen.
Hervorstechende Funktionen & Integrationen:
Funktionen umfassen Kundensegmentierung, rollenspezifische Erfolgsmessungen, Customer Success Workflows und Playbooks, Funktionen für das Management des Kundenlebenszyklus, visuelle Dashboards und benutzerdefinierte Berichte. Totango erleichtert außerdem die Zusammenarbeit von Customer Success Teams durch eine zentrale Plattform zum Teilen von Kundeninformationen, Aufgaben und Notizen.
Integrationen umfassen Salesforce, Microsoft Outlook, Slack, HubSpot, Jira, Monday, Tableau, Stripe, Zoom und Google Analytics.
Pros and Cons
Pros:
- Benutzerfreundliche, intuitive Oberfläche
- Hilft dabei, Kundeninformationen und Aktivitäten im Blick zu behalten
- Automatisierte Prozesse verschaffen dem Team Freiräume für andere Aufgaben
Cons:
- Keine transparente Preisgestaltung
- Hohes Maß an Anpassbarkeit kann zu Komplexität führen
- Kunden-Health-Parameter sind nicht kombinierbar
Germain UX
Am besten geeignet zur Beobachtung echter Endnutzer-Schritte, Erlebnisse und Engpässe

Germain UX (auch bekannt als Germain Apm/UX) konzentriert sich auf die reale Nutzererfahrung (RUX) und Performance-Analytics – es verfolgt User Journeys, Sitzungsaufzeichnungen, Leistungskennzahlen und Experience-Probleme über Anwendungen und Web hinweg.
Warum ich Germain UX gewählt habe: Ich habe Germain UX ausgewählt, weil es die Lücke zwischen herkömmlicher Anwendungsüberwachung und echter Nutzererlebnis-Intelligenz schließt. Wenn Sie verstehen möchten, wie echte Nutzer durch Performance- oder Usability-Probleme beeinträchtigt werden – über Plattformen, Geräte und Regionen hinweg – ist dieses Tool genau dafür gemacht.
Herausragende Funktionen & Integrationen
Funktionen umfassen Sitzungsaufzeichnung und -wiedergabe, Echtzeitüberwachung der Nutzer-Performance und Page-Flows, Technologieüberwachung (Browser-/Geräte-Erkennung, Fehler), automatisierte Benachrichtigungen bei Verschlechterungen des Nutzererlebnisses sowie Journey-basierte Analysen.
Integrationen umfassen Datenexport-APIs, Alarmierungs-/Webhook-Verbindungen, CRM-/Analytikplattform-Links (für Segmentierung) und anpassbare Plugins für große Plattformen.
Pros and Cons
Pros:
- Wiedergaben realer Nutzersitzungen zeigen Nutzerverhalten im Kontext
- Überwacht Performance und Technologie-Stack zusammen mit dem Erlebnisfluss
- Automatisierte Benachrichtigungen bei Verschlechterung des Nutzererlebnisses und konversionsrelevanten Problemen
Cons:
- Einrichtung und Konfiguration können technische Ressourcen erfordern
- Oberfläche und Navigation wirken weniger ausgereift
Weitere Tools zur Überwachung der digitalen Nutzererfahrung
Im Folgenden finden Sie eine Liste zusätzlicher Lösungen zur Überwachung der digitalen Nutzererfahrung, die ich für diese Liste in Betracht gezogen habe. Auch wenn sie es nicht in meine Top 20 geschafft haben, sind sie trotzdem einen Blick wert. Vielleicht ist das passende Tool für Sie dabei!
- Elastic
Am besten geeignet für Protokolldatenanalyse und -visualisierung
- Contentsquare
Am besten für Customer Journey Analytics
- ControlUp
Am besten für das Monitoring von IT-Infrastrukturen geeignet
- eG Innovations
Am besten geeignet für das Nachverfolgen der Endbenutzererfahrung
- Compass
Am besten zur Überwachung der digitalen Adoption geeignet
- LiveAgent
Am besten geeignet für Echtzeit-Besucherüberwachung
- Sentry
Am besten für Fehlerverfolgung in Echtzeit
- Dynatrace
Am besten geeignet für KI-gestützte Einblicke
- Zoho Pagesense
Am besten zur Conversion-Optimierung geeignet
- Apica
Am besten geeignet zum Testen und Überwachen der Leistung von Webanwendungen
- BMC TrueSight
Am besten geeignet für AIOps-gesteuerte Automatisierung und Kostenprognose
- Riverbed SteelCentral
Am besten geeignet für durchgängige Transparenz bei Netzwerk- und Anwendungsleistung
- Splunk APM
Am besten geeignet für die Analyse und Visualisierung von Anwendungsleistungsdaten


So bewerte ich Tools für das Monitoring digitaler Erlebnisse
Tools für das Monitoring digitaler Erlebnisse sind das Mittel der Wahl für SRE-Teams, wenn ein Anstieg bei Warenkorbabbrüchen auf langsame API-Aufrufe zurückgeführt werden muss oder wenn IT-Teams nachweisen müssen, dass Verzögerungen bei Zoom-Anrufen eines Mitarbeiters im Homeoffice auf ein Netzproblem am letzten Übergabepunkt und nicht auf eine VPN-Fehlkonfiguration zurückzuführen sind. Bei der Bewertung von Tools in diesem Bereich unterscheide ich zwischen zwei Ebenen: den grundlegenden Fähigkeiten, die jedes Tool abdecken muss, um in diese Liste aufgenommen zu werden, und den Alleinstellungsmerkmalen, die die Tools voneinander unterscheiden.
Kernfunktionen (Grundvoraussetzungen für diese Liste)
Für Tools im Bereich Monitoring digitaler Erlebnisse prüfe und bewerte ich insbesondere folgende Kernfunktionen:
- Reales Nutzer-Monitoring: Ich überprüfe, ob das Tool tatsächliche Sitzungsdaten wie Seitenladezeiten, Interaktionsverzögerungen und Abstürze sowohl über Web- als auch Mobilkanäle erfasst.
- Synthetisches Monitoring: Skriptgesteuerte Transaktionsprüfungen aus verteilten Standorten sind wichtig. Ich bewerte, wie gut ein Tool mehrstufige Abläufe wie Anmeldungen oder Bezahlvorgänge simuliert, bevor Nutzer davon betroffen sind.
- Analyse des Netzwerkpfads: Wenn App-Verzögerungen bei Remote-Mitarbeitern zum Beispiel durch DNS, ISP oder VPN verursacht werden könnten, muss das Tool jeden Hop nachverfolgen können. Ich achte auf Transparenz bis zur letzten Meile der Konnektivität.
- Visualisierung durchgängiger Nutzerreisen: Ich prüfe, ob das Tool die Anfrage eines Nutzers vom Browser über CDN, API und Microservices in einer konsistenten Ansicht abbilden kann.
- Erlebnis-Scoring: Rohe Metriken reichen nicht aus. Ich suche nach zusammengesetzten Scores wie Apdex, die Backend-Verzögerungen mit Frontend-Auswirkungen wie steigenden Absprungraten korrelieren.
- Alarmierung und Anomalie-Erkennung: Ich achte auf Alarmsysteme, die relative Veränderungen der User Experience im Vergleich zu normalen Mustern erkennen und nicht nur auf statische Grenzwert-Benachrichtigungen.
- Multi-Channel-Abdeckung: Ein Tool, das nur Webseiten überwacht, führt zu blinden Flecken. Ich prüfe, ob mindestens mobile Apps, SaaS-Plattformen und API-Endpunkte unterstützt werden.
Ein Tool muss die meisten dieser Funktionen abdecken, um auf diese Liste zu kommen. Anschließend betrachte ich die Besonderheiten der einzelnen Tools.
Herausragende Merkmale (Was die Tools unterscheidet)
KI-gestützte Ursachenanalyse sticht hervor – insbesondere bei Tools, die Anomalien über Microservices- oder Netzwerkschichten hinweg mit einem wahrscheinlichen einzelnen Auslöser verknüpfen können. Integrationen mit ITSM-Systemen und CI/CD-Pipelines sind für mich unverzichtbar, wenn Teams geschlossene Incident-Workflows oder die direkte Zuordnung von Experience-Änderungen zu Deployments wünschen. Fortschrittlicher Support für die Employee Experience – etwa durch Endgeräte-Analysen bei SaaS und VDI – schafft zusätzlichen Nutzen für IT-Teams bei der Fehlersuche bei internen Produktivitätsproblemen.
Was ich über die Funktionen hinaus berücksichtige
Das Preismodell spielt hier eine größere Rolle als in den meisten anderen Kategorien. Ich prüfe, ob ein Anbieter pro Host, pro Session oder pro GB Telemetrie abrechnet, weil Teams mit hohem Traffic bei nutzungsbasierten Preismodellen unerwartete Kosten treffen können. Die Flexibilität bei der Bereitstellung ist ebenfalls entscheidend – regulierte Branchen wie das Gesundheitswesen oder der Finanzsektor benötigen oft On-Premises- oder regional beschränkte Datenhaltung, deshalb prüfe ich, ob nur SaaS bereitgestellt wird. Ich achte außerdem darauf, ob das Tool sowohl für die Überwachung von Kundenerlebnissen als auch für die Employee Experience geeignet ist, da dies bestimmt, welche Teammitglieder tatsächlichen Nutzen daraus ziehen.
Wie Sie das passende Tool zur Überwachung der digitalen Nutzererfahrung auswählen
Es ist leicht, sich in langen Funktionslisten und komplexen Preisstrukturen zu verlieren. Damit Sie während Ihres individuellen Auswahlprozesses den Überblick behalten, habe ich eine Checkliste mit wichtigen Kriterien für Sie zusammengestellt:
| Faktor | Worauf achten? |
|---|---|
| Skalierbarkeit | Kann das Tool mit Ihrem Unternehmen wachsen? Berücksichtigen Sie zukünftiges Wachstum, Nutzerlimits und Datenverarbeitungskapazitäten. Achten Sie auf Lösungen, die sich problemlos skalieren lassen. |
| Integrationen | Lässt sich das Tool in Ihre bestehenden Systeme einbinden? Stellen Sie sicher, dass es sich nahtlos mit Ihren aktuellen Tools verbindet, um Arbeitsabläufe nicht zu stören. |
| Anpassbarkeit | Können Sie das Tool auf Ihre Anforderungen zuschneiden? Suchen Sie nach Einstellmöglichkeiten für Dashboards, Berichte und Benachrichtigungen, damit es zum Workflow Ihres Teams passt. |
| Benutzerfreundlichkeit | Ist die Oberfläche intuitiv? Wählen Sie Tools, die nur minimale Einarbeitung erfordern, damit Ihr Team sich auf die Überwachung statt auf das Erlernen des Systems konzentrieren kann. |
| Implementierung und Onboarding | Wie lange dauert die Einrichtung? Prüfen Sie den Aufwand und die Ressourcen, die zum effektiven Betrieb des Tools nötig sind. Suchen Sie nach optimierten Prozessen. |
| Kosten | Passt das Tool zu Ihrem Budget? Bewerten Sie Anschaffungskosten, Abonnementgebühren und versteckte Kosten. Vergleichen Sie den Nutzen mit dem Preis. |
| Sicherheitsmaßnahmen | Sind Ihre Daten und Abläufe geschützt? Achten Sie auf Verschlüsselung, Compliance-Standards und zurückliegende Sicherheitsvorfälle. |
| Support-Verfügbarkeit | Ist Hilfe jederzeit verfügbar? Achten Sie auf guten Support – zum Beispiel rund um die Uhr oder durch einen festen Ansprechpartner – um bei Problemen schnell Unterstützung zu bekommen. |
Was ist ein Tool zur Überwachung der digitalen Nutzererfahrung?
Tools zur Überwachung der digitalen Nutzererfahrung sind Plattformen, die in Echtzeit nachverfolgen und analysieren, wie Nutzer mit digitalen Diensten interagieren. Sie helfen dabei, Leistungsprobleme zu identifizieren, das Nutzerverhalten zu messen und das Nutzererlebnis über Websites, Apps und Backend-Systeme hinweg zu optimieren.
Funktionen von Digital Experience Monitoring Tools
Beim Auswählen von Tools zur Überwachung digitaler Erlebnisse sollten Sie auf die folgenden Schlüsselfunktionen achten:
- Echtzeitüberwachung: Erhalten Sie sofortige Einblicke in die Interaktionen und Erfahrungen Ihrer Nutzer, während sie passieren, damit Sie Probleme erkennen können, bevor sie zu Kopfschmerzen werden. Diese Funktion hilft Ihnen, Verlangsamungen oder Ausfälle rasch zu identifizieren und proaktiv zu reagieren.
- Analyse der Endnutzerleistung: Sehen Sie, wie echte Menschen Ihre digitalen Plattformen erleben – bis hin zu Ladezeiten, Fehlern und Navigationsproblemen. Das ermöglicht gezielte Verbesserungen, die tatsächlich Ihre Nutzer beeinflussen.
- Synthetische Transaktionsüberwachung: Simulieren Sie rund um die Uhr das Verhalten von Nutzern, indem Sie skriptgesteuerte Aktionen wie Logins oder Käufe durchführen, um Leistungsengpässe zu erkennen – auch wenn alle anderen schlafen.
- Multikanal-Tracking: Verfolgen Sie Nutzererlebnisse über Web-, Mobil- und Desktop-Plattformen hinweg und erhalten Sie einen ganzheitlichen Blick auf jeden Berührungspunkt. Es ist Ihre Komplettlösung, um die gesamte digitale Journey im Blick zu behalten.
- Benachrichtigungen und Alarme: Erhalten Sie zeitnahe Warnmeldungen, wenn Nutzererlebnisse unter Ihre Benchmarks fallen. Das hält Sie einen Schritt voraus, sodass Sie Probleme lösen können, bevor Ihre Nutzer sie überhaupt bemerken.
- Ursachenanalyse: Analysieren Sie Probleme schnell im Detail, um genau herauszufinden, wo es hakt – sei es ein Serverproblem oder ein instabiles Netzwerk.
- Anpassbare Dashboards: Erstellen Sie eigene Ansichten mit den für Sie relevanten Kennzahlen. Erkennen Sie Trends, verfolgen Sie KPIs und teilen Sie Ergebnisse im Team – alles in einem leicht verständlichen Dashboard.
Gemeinsame KI-Funktionen bei Digital Experience Monitoring Tools
Über die oben aufgeführten Standardfunktionen hinaus integrieren viele dieser Lösungen KI mit Funktionen wie:
- Anomalieerkennung: Erkennen Sie automatisch ungewöhnliche Muster im Nutzerverhalten oder in Leistungskennzahlen, damit Sie Probleme aufspüren, die mit herkömmlicher Überwachung leicht übersehen werden könnten.
- Prädiktive Analysen: Sagen Sie zukünftige Leistungsprobleme oder Ausfallzeiten voraus, bevor sie Ihre Nutzer betreffen, indem KI Trends und Nutzungsmuster auswertet.
- Automatisierte Priorisierung von Problemen: Lassen Sie KI die Dringlichkeit und wahrscheinliche Ursache von Problemen bewerten, damit Sie Korrekturen nach Geschäftsauswirkungen priorisieren können, anstatt zu raten.
- Intelligente Nutzererlebnis-Bewertung: KI analysiert Nutzersitzungen und vergibt Erlebniswerte, sodass Sie sich auf die Bereiche Ihrer digitalen Präsenz konzentrieren, die am meisten Verbesserung benötigen.
- Proaktive Empfehlungen: Erhalten Sie KI-gestützte Vorschläge zur Optimierung Ihrer digitalen Plattformen, vom Beschleunigen langsamer Seiten bis zum Überarbeiten verwirrender Navigationspfade.
Vorteile von Digital Experience Monitoring Tools
Die Implementierung von Digital Experience Monitoring Tools bietet zahlreiche Vorteile für Ihr Team und Ihr Unternehmen. Hier sind einige, auf die Sie sich freuen können:
- Verbessertes Nutzererlebnis: Durch das Sammeln von Echtzeitdaten über Nutzerinteraktionen helfen diese Tools dabei, Probleme zu identifizieren und zu beheben, die Nutzer erleben – und verbessern so das Gesamterlebnis.
- Datenbasierte Entscheidungsfindung: Diese Tools liefern Einsichten und Analysen, die strategische Entscheidungen unterstützen, sodass Sie Verbesserungen nach dem tatsächlichen Nutzerverhalten und Bedarf priorisieren können.
- Verbesserte Zusammenarbeit: Durch Funktionen, die Teamarbeit fördern, ermöglichen Digital Experience Monitoring Tools mehreren Nutzern, zur Problemlösung und Planung beizutragen, wodurch vielfältige Sichtweisen einfließen.
- Skalierbarkeit und Flexibilität: Mit wachsender Organisation können diese Tools mitwachsen und bleiben wirksam, auch bei zunehmender Nutzerzahl und komplexeren Umgebungen.
- Integration mit bestehenden Systemen: Durch die Anbindung an andere Plattformen wie CRMs oder Projektmanagement-Tools sorgen sie für reibungslosen Datenfluss und gute Zugänglichkeit und somit für Konsistenz über die Systeme hinweg.
- Nutzerzentriertes Design: Mit Fokus auf das Verständnis der Nutzerbedürfnisse unterstützen diese Tools das Einholen von Feedback und fundierte Entscheidungen, die an Kundenerwartungen ausgerichtet sind.
- Proaktive Problemlösung: Sie ermöglichen Teams, potenzielle Probleme frühzeitig zu erkennen und zu beheben, bevor sie Nutzer beeinträchtigen, und sorgen so für weniger Ausfallzeiten und höhere Zuverlässigkeit.
Kosten und Preise für Digital Experience Monitoring Tools
Die Auswahl von Digital Experience Monitoring Tools setzt ein Verständnis der verschiedenen Preismodelle und -pläne voraus. Die Kosten variieren je nach Funktionsumfang, Teamgröße, Erweiterungen und mehr. Die folgende Tabelle fasst gängige Pläne, ihre Durchschnittspreise und typische enthaltene Funktionen von Digital Experience Monitoring Tools zusammen:
Tarifvergleichstabelle für Digital Experience Monitoring Tools
| Tarifart | Durchschnittlicher Preis | Gemeinsame Funktionen |
|---|---|---|
| Gratis-Tarif | $0 | Grundlegende Überwachung, begrenzte Datenspeicherung und Community-Support. |
| Persönlicher Tarif | $5-$15/user/Monat | Erweiterte Überwachung, anpassbare Warnmeldungen und E-Mail-Support. |
| Business-Tarif | $20-$50/user/Monat | Erweiterte Analysen, Tools für Teamzusammenarbeit und telefonischer Support. |
| Enterprise-Tarif | $100-$300/user/Monat | Komplette Anpassbarkeit, persönlicher Kundenbetreuer und 24/7-Support. |
Digital Experience Monitoring: Häufig gestellte Fragen
Digital Experience Monitoring kann eine große Aufgabe sein und umfasst riesige Datenmengen, Diagramme und Erkenntnisse. Wenn Sie noch Hilfe bei den Grundlagen brauchen – das ist völlig in Ordnung! Hier finden Sie einige häufig gestellte Fragen zu Digital Experience Monitoring und zu entsprechenden Tools, die Ihnen den Einstieg erleichtern.
Worauf sollte ich bei der Auswahl eines Digital Experience Monitoring Tools für mein Unternehmen achten?
Bei der Bewertung von Digital Experience Monitoring Tools sollten Sie zunächst prüfen, ob die Plattform alle Ihre entscheidenden digitalen Kanäle abdeckt – wie Websites, mobile Apps und Cloud-Dienste. Achten Sie auf Echtzeitüberwachung, Analysen zur Nutzerreise und klare Visualisierungsfunktionen für schnelle Einblicke. Eine starke Integration mit bestehenden CX-, IT- und Analysesystemen ist essenziell, um Datensilos zu vermeiden. Bewerten Sie auch die Benutzerfreundlichkeit; eine komplizierte Oberfläche kann Ihr Team ausbremsen. Schließlich sollten Sie Tools priorisieren, die verlässlichen Support, umfangreiche Anpassungsmöglichkeiten und Skalierbarkeit bieten, sodass sie mit den Anforderungen Ihres Unternehmens wachsen können.
Wie können Tools für Digital Experience Monitoring dazu beitragen, die Kundenabwanderung zu verringern?
Digital Experience Monitoring Tools ermöglichen es Ihnen, Probleme, auf die Kunden stoßen – wie langsame Ladezeiten oder nicht funktionierende Funktionen – zu erkennen, bevor sie größere Teile Ihres Publikums betreffen. Wenn Sie frühzeitig auf diese Probleme aufmerksam gemacht werden, können Sie Beschwerden schnell lösen und die Kundenzufriedenheit insgesamt verbessern. Viele Tools bieten Berichte, die Muster hinter wiederkehrenden Problemen aufdecken, sodass Sie proaktiv Hemmnisse beseitigen können. Durch die kontinuierliche Bereitstellung eines reibungslosen digitalen Erlebnisses erhöhen Sie die Loyalität und reduzieren die Wahrscheinlichkeit, dass Kunden zur Konkurrenz wechseln.
Gibt es kostenlose Tools für Digital Experience Monitoring?
Ja, einige Anbieter bieten kostenlose Tarife oder Testphasen an. Zum Beispiel stellt New Relic einen Gratis-Tarif mit begrenzten Funktionen zur Verfügung, während Tools wie Dynatrace eine zeitlich begrenzte kostenlose Testversion anbieten. Diese Optionen eignen sich gut, um die Software zu testen und festzustellen, ob sie zu Ihren Anforderungen passt, bevor Sie ein kostenpflichtiges Paket wählen.
Können Digital Experience Monitoring Tools mit bestehenden CX- und Analyseplattformen integriert werden?
Ja, die meisten renommierten Digital Experience Monitoring Lösungen sind darauf ausgelegt, sich nahtlos in bestehende CX-, Analyse- und IT-Service-Management-Plattformen zu integrieren. Viele bieten vorgefertigte Schnittstellen für gängige Tools wie Salesforce, Google Analytics und Slack oder stellen offene APIs für individuelle Integrationen bereit. So können Sie Nutzerdaten mit übergeordneten Geschäftsdaten verknüpfen und erhalten eine einheitliche Sicht für alle Beteiligten. Bevor Sie sich für ein Tool entscheiden, stellen Sie sicher, dass die benötigten Integrationen unterstützt werden, und fragen Sie nach zusätzlichen Kosten oder technischen Anforderungen.
Wie schnell kann mein Team Probleme mit Digital Monitoring Tools erkennen und beheben?
Ein gutes Digital Monitoring Tool wird die Zeit Ihres Teams zur Erkennung und Behebung von Problemen drastisch verkürzen. Echtzeit-Dashboards, Aufzeichnungen von Nutzersitzungen und automatische Warnmeldungen informieren Ihr Team sofort, wenn die Performance sinkt oder Fehler auftreten. So können Sie oft schon reagieren, bevor die meisten Kunden überhaupt etwas bemerken. Fortgeschrittene Plattformen helfen Ihnen zudem bei der Identifikation von Ursachen, beschleunigen die Fehlersuche und reduzieren Ausfallzeiten. Im Lauf der Zeit erlauben die gesammelten Daten eine Optimierung der digitalen Touchpoints und beugen künftigen Problemen vor.
Welche typischen Herausforderungen gibt es bei der Einführung von Digital Experience Monitoring Software?
Bei der Einführung können Herausforderungen auftreten, wie die Anbindung an Altsysteme, das Erfassen komplexer Nutzerreisen oder die vollständige Einhaltung von Datenschutzanforderungen. Auch das Schulen von Teammitgliedern auf neue Arbeitsweisen kann ressourcenintensiv sein. Es kommt häufig vor, dass das Einsammeln von Daten aus allen relevanten Quellen (Webseiten, Mobil, APIs) eine spezielle Konfiguration erfordert.
Um den Prozess zu erleichtern, arbeiten Sie eng mit Ihrem Anbieter beim Onboarding zusammen und nutzen Sie geführte Tutorials oder die Ressourcen des Customer Success Teams. Klare Zielsetzungen sowie das frühzeitige Einbinden von IT, CX und Fachbereichen sorgen für eine erfolgreiche Einführung.
Weitere Digital Experience Software Bewertungen
Das Management der digitalen Kundenerfahrung umfasst viele verschiedene Aspekte. Wenn Sie weitere oder andere Tools benötigen, um die digitalen Erlebnisse Ihrer Kunden zu verwalten – oder wenn Sie einfach sehen möchten, was es sonst noch gibt – werfen Sie gerne einen Blick auf einige unserer weiteren Artikel zu diesem Thema:
- Plattformen für digitale Erlebnisse
- Software für Customer Experience Management
- Usability-Testing-Tools für UX
- UX-Testsoftware
- Session-Recording-Software
Fazit
Nach der Lektüre dieses Artikels hoffe ich, dass Sie verstehen, dass der Markt für Tools zur Überwachung digitaler Erfahrungen eine äußerst vielfältige Auswahl bietet, jedes mit eigenen Stärken – sei es in Form von tiefgehender Analytik, KI-gestützten Einblicken oder detailreicher Protokollanalyse. Daher sollte der erste Schritt bei Ihrer Suche nach einem entsprechenden Tool darin bestehen, genau festzulegen, was Sie wirklich benötigen.
Suchen Sie weitere Bewertungen von Customer Experience Tools, Tipps und Tricks oder Expertenrat? Abonnieren Sie unseren Newsletter und erhalten Sie Zugang zu aktuellen Brancheneinblicken.