10 Migliori Alternative a Mixpanel per 2026

Shortlist delle alternative a Mixpanel


Una valida alternativa a Mixpanel offre al tuo team un monitoraggio flessibile degli eventi, un'analisi chiara del percorso utente e report affidabili—senza legarti ai modelli di prezzo o di dati di Mixpanel. Se stai cercando le migliori alternative a Mixpanel, probabilmente stai valutando strumenti che propongono funzionalità di analisi prodotto simili, ma con diverse modalità di implementazione, privacy o possibilità di integrazione.
Questa lista ti aiuterà a confrontare i principali strumenti fianco a fianco, così potrai trovare la soluzione più adatta alle tue esigenze di analisi, requisiti di governance dei dati e obiettivi di business.
Che cos’è Mixpanel?
Mixpanel è una piattaforma di analisi prodotto che aiuta i team a monitorare il comportamento degli utenti e analizzare le interazioni dei clienti su applicazioni web e mobile. Si concentra sull’analisi comportamentale, permettendo ai team di capire come gli utenti interagiscono con le funzionalità, attraversano i flussi di lavoro e utilizzano i prodotti digitali. Grazie agli strumenti per la raccolta dei dati e l’analisi del customer journey, Mixpanel consente di trasformare i dati grezzi di utilizzo in insight che migliorano l’esperienza prodotto. È ampiamente usato da chi vuole ridurre il churn, comprendere meglio i nuovi utenti e analizzare dati fra team tecnici spesso separati.
Riepilogo delle migliori alternative a Mixpanel
Questa tabella comparativa riassume i dettagli sui prezzi delle mie principali alternative a Mixpanel per aiutarti a trovare quella più adatta al tuo budget e ai tuoi obiettivi di business.
| Tool | Best For | Trial Info | Price | ||
|---|---|---|---|---|---|
| 1 | Best for website traffic analysis | Free plan available | Pricing upon request | Website | |
| 2 | Best for real-time user journey monitoring | Free demo available | Pricing upon request | Website | |
| 3 | Best for mobile app engagement insights | 30-day free trial + free demo available | From $75/month | Website | |
| 4 | Best for session replay visualization | Free demo available | Pricing upon request | Website | |
| 5 | Best for automatic event tracking | Free plan + free trial + free demo available | Pricing upon request | Website | |
| 6 | Best for funnel performance tracking | 7-day free trial + free demo available | From $99/month | Website | |
| 7 | Best with self-hosted deployment options | Free plan + free demo available | From $0.00005/event | Website | |
| 8 | Best with advanced attribution modeling | Free demo available | Pricing upon request | Website | |
| 9 | Best for digital experience mapping | 15-day free trial + free plan + free demo available | From $39/month (billed annually) | Website | |
| 10 | Best for behavioral cohort analysis | Free plan available | Pricing upon request | Website |
Perché Fidarti delle Nostre Recensioni
Testiamo e recensiamo software dal 2020. Come leader CX, sappiamo quanto sia fondamentale e difficile prendere la decisione giusta nella scelta di un software. Investiamo in ricerche approfondite per aiutare il nostro pubblico a fare scelte migliori sui software. Abbiamo testato oltre 2.000 strumenti per diversi casi d’uso CX e pubblicato più di 1.000 recensioni dettagliate. Scopri come rimaniamo trasparenti & la nostra metodologia di valutazione del software.
-

SupportYourApp
Visit WebsiteThis is an aggregated rating for this tool including ratings from Crozdesk users and ratings from other sites.4.7 -
Tidio
Visit WebsiteThis is an aggregated rating for this tool including ratings from Crozdesk users and ratings from other sites.4.7 -
Freshdesk
Visit WebsiteThis is an aggregated rating for this tool including ratings from Crozdesk users and ratings from other sites.4.4


Recensioni delle alternative a Mixpanel
Qui sotto trovi le mie sintesi dettagliate delle migliori alternative a Mixpanel selezionate nella mia shortlist. Le mie recensioni offrono una panoramica dettagliata sulle caratteristiche, casi d’uso e integrazioni di ciascuna piattaforma per aiutarti a trovare la soluzione migliore per te.
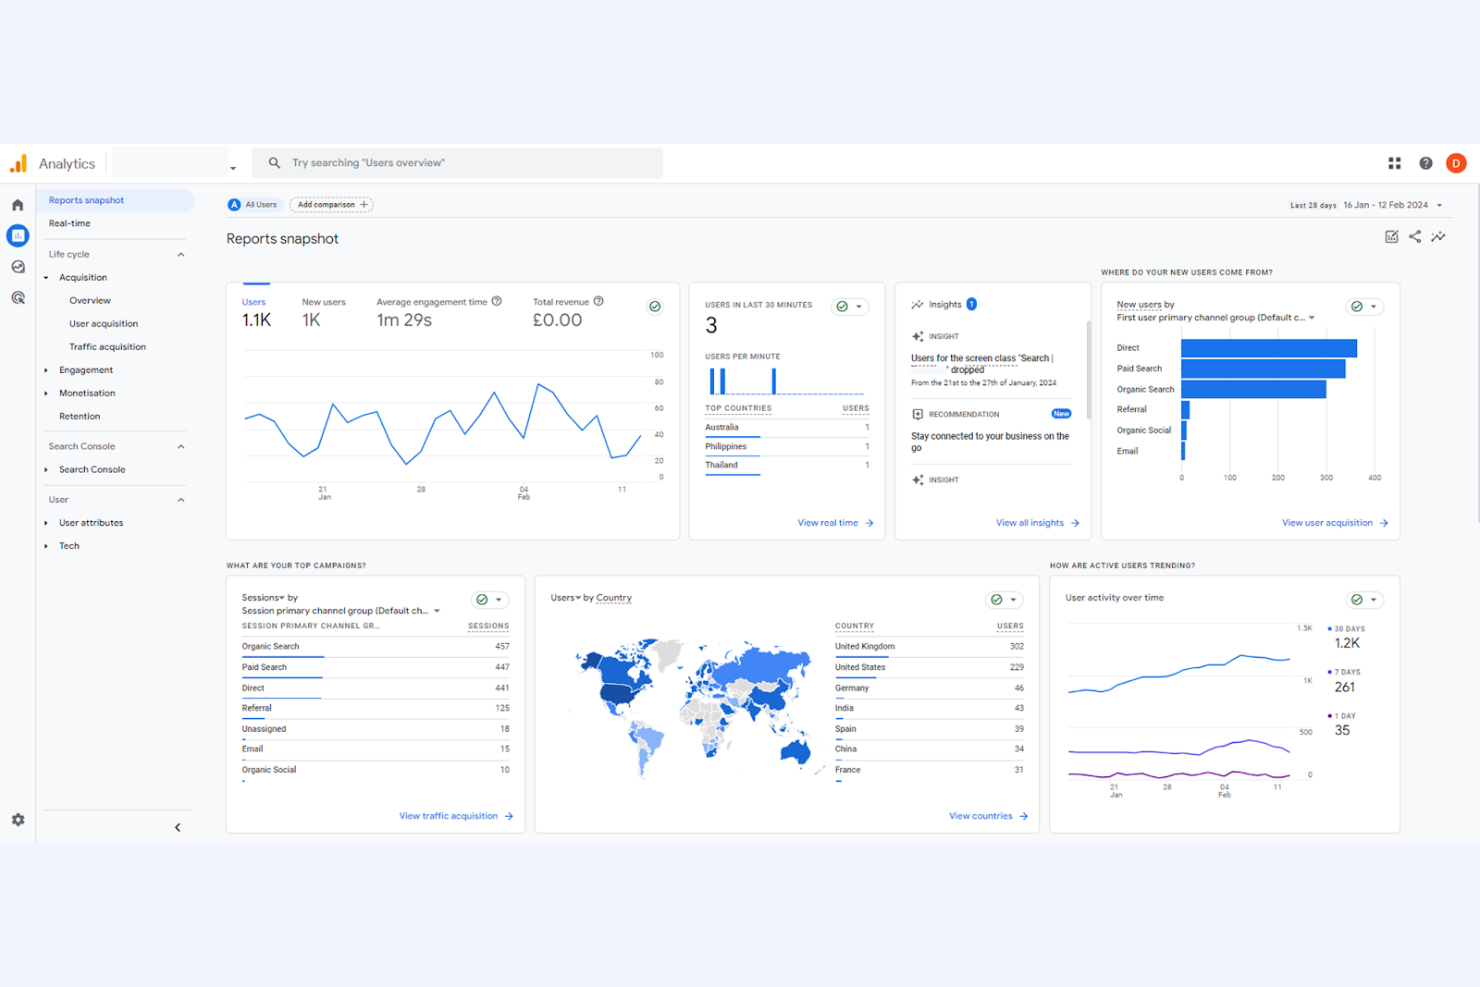
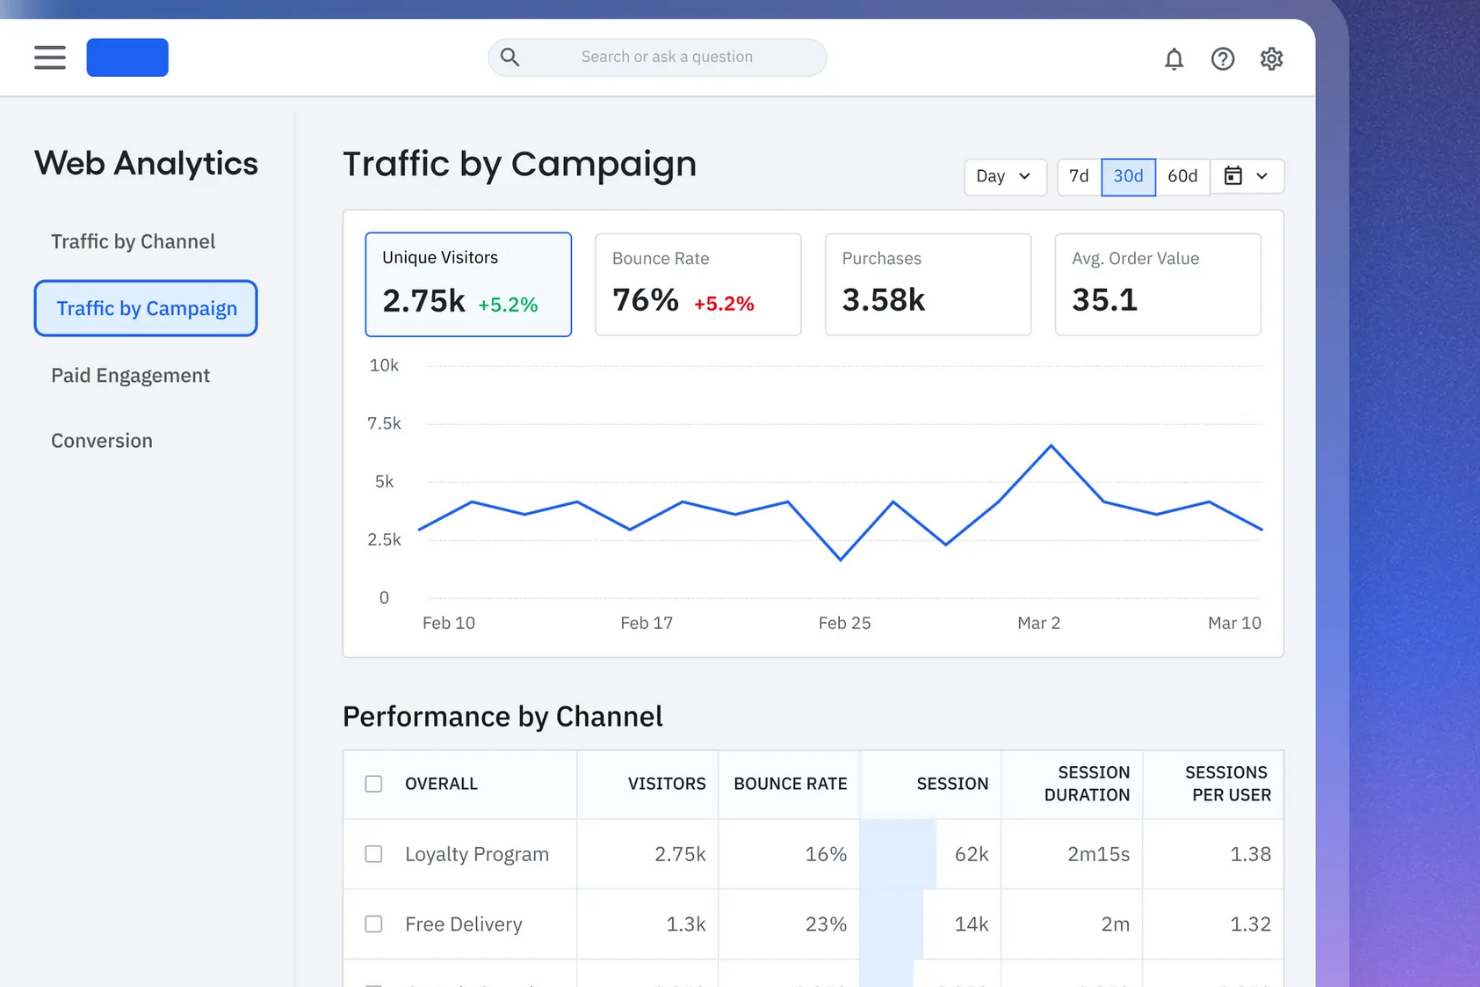
For teams focused on understanding website visitor behavior, Google Analytics offers detailed traffic analysis and reporting. This platform is especially useful for digital marketers, ecommerce managers, and content teams who need to track site performance and user journeys. Unlike Mixpanel, Google Analytics specializes in granular website data, making it a go-to choice for optimizing web traffic and conversion funnels.
Why Google Analytics Is a Good Mixpanel Alternative
If your main goal is to analyze website traffic in depth, Google Analytics is a strong alternative to Mixpanel. I picked Google Analytics because it offers detailed real-time and historical reporting on site visits, user flows, and traffic sources. You can segment audiences, track conversion events, and visualize user journeys across your website. These features make it especially valuable for teams focused on optimizing web performance and understanding how visitors interact with site content.
Google Analytics Key Features
Some other features in Google Analytics help teams get a broader view of digital performance:
- Custom Dashboards: Build personalized dashboards to monitor the metrics that matter most to your team.
- Event Tracking: Set up and track specific user actions like downloads, video plays, or form submissions.
- Ecommerce Reporting: Analyze product performance, sales funnels, and transaction data for online stores.
- Attribution Modeling: Compare different attribution models to understand which channels drive conversions.
Google Analytics Integrations
Integrations include Google Ads, Google Tag Manager, Google Search Console, Google Data Studio, Google Optimize, Google AdSense, Firebase, BigQuery, Display & Video 360, and Search Ads 360.
Pros and Cons
Pros:
- Event tracking enables custom measurement of interactions
- Real-time reporting provides immediate visibility into activity
- Detailed traffic analysis supports website performance tracking
Cons:
- Data sampling can impact reporting accuracy
- Limited product analytics depth for user-level insights
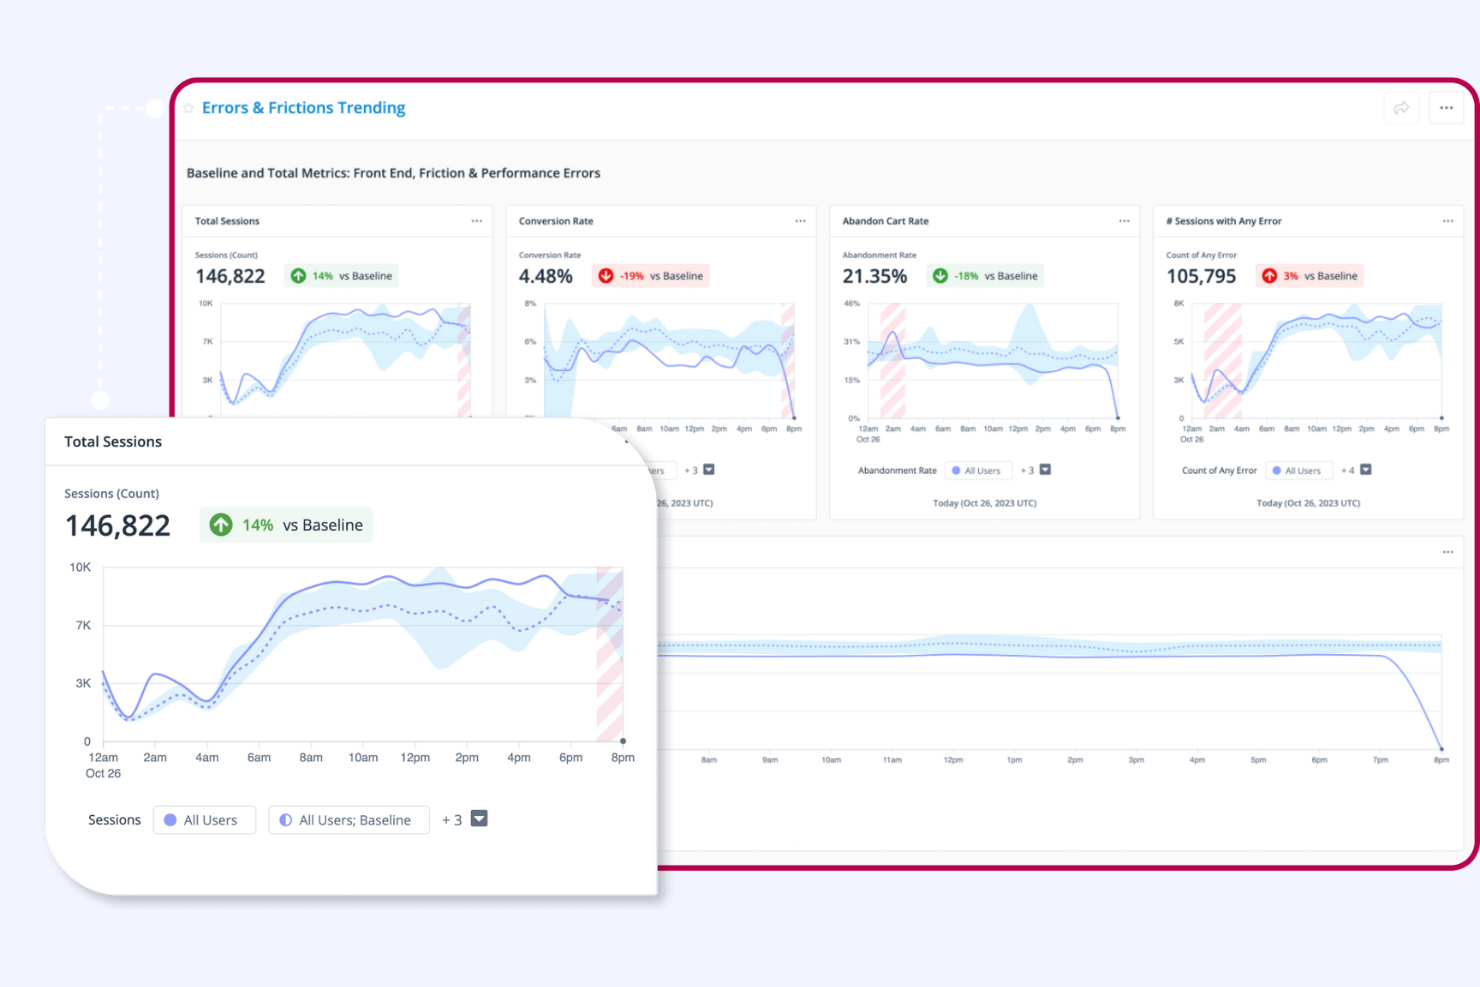
When you need to monitor user journeys as they happen, Quantum Metric delivers real-time analytics and session intelligence. Digital product teams and CX leaders use Quantum Metric to spot friction, diagnose issues, and respond to user behavior instantly across web and mobile. Its live monitoring and anomaly detection set it apart from Mixpanel and other event-based analytics platforms.
Why Quantum Metric Is a Good Mixpanel Alternative
Unlike platforms that focus on historical event data, Quantum Metric gives you real-time visibility into user journeys as they unfold. I picked Quantum Metric because its live session monitoring and instant anomaly detection help teams catch and address issues the moment they appear.
The platform’s continuous product design approach lets you see user struggles and friction points without waiting for batch reports. For teams that need to react quickly to user behavior, Quantum Metric offers a level of immediacy that Mixpanel doesn’t provide.
Quantum Metric Key Features
Some other features in Quantum Metric help teams dig deeper into user experience and product performance:
- Session Replay: Watch full recordings of user sessions to understand specific behaviors and pain points.
- Heatmaps: Visualize aggregate user interactions with clicks, scrolls, and taps across your site or app.
- Impact Quantification: Measure the business impact of user experience issues with built-in analytics.
- Form Analytics: Track and analyze user interactions with forms to identify where users abandon or struggle.
Quantum Metric Integrations
Integrations include AB Tasty, Split, Botcopy, ServiceNow, Qualtrics, Salesforce Service Cloud, Looker, Slack, Optimizely, and Tealium.
Pros and Cons
Pros:
- Impact analysis links issues to business outcomes
- Session replay adds context to user interactions
- Real-time monitoring detects issues as they occur
Cons:
- Reporting customization is somewhat limited
- Feature depth can feel overwhelming for smaller teams
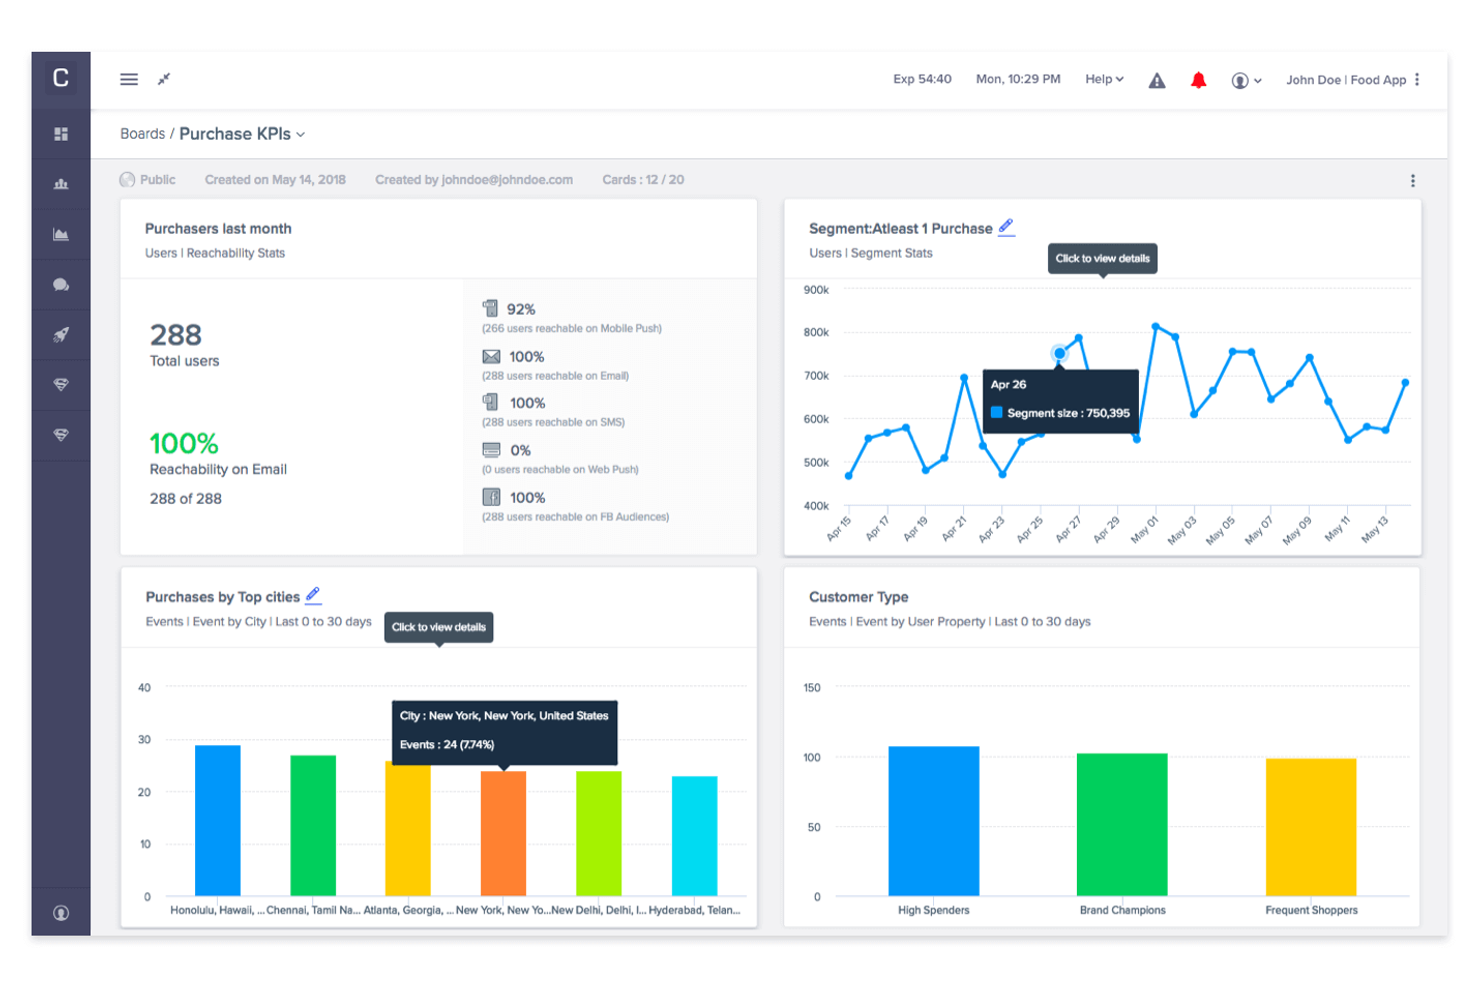
If you’re focused on driving engagement and retention in mobile apps, CleverTap offers analytics tailored for mobile-first businesses. The platform stands out with its real-time segmentation and personalized messaging features, helping product and marketing teams understand and influence user behavior. CleverTap is especially useful for teams that need to connect analytics with targeted in-app campaigns and push notifications.
Why CleverTap Is a Good Mixpanel Alternative
CleverTap stands out for teams that need deep insights into mobile app engagement, which is why I picked it as a Mixpanel alternative. Its event-based analytics let you track user actions in real time and segment audiences based on behavior, location, or device.
I appreciate how CleverTap connects analytics with automated messaging, so you can trigger push notifications or in-app messages based on user activity. This makes it a strong choice for businesses that want to turn analytics into targeted engagement strategies.
CleverTap Key Features
Some other features in CleverTap help teams get more from their product analytics platform:
- A/B Testing: Run experiments on messaging and app features to see what drives user engagement.
- User Lifecycle Management: Visualize and analyze user journeys from onboarding through retention and re-engagement.
- Funnels and Drop-off Analysis: Build funnels to track conversion steps and identify where users exit the process.
- Live User Activity Streams: Monitor real-time user actions within your app to spot trends and issues as they happen.
CleverTap Integrations
Integrations include Salesforce, Google Analytics, Shopify, HubSpot, Mixpanel, Slack, Segment, Zendesk, Mailchimp, Firebase, and more.
Pros and Cons
Pros:
- A/B testing supports optimization of campaigns and features
- Automated messaging connects insights to engagement actions
- Real-time segmentation enables precise audience targeting
Cons:
- Customization options for reports can feel restrictive
- Limited support for web-focused analytics use cases
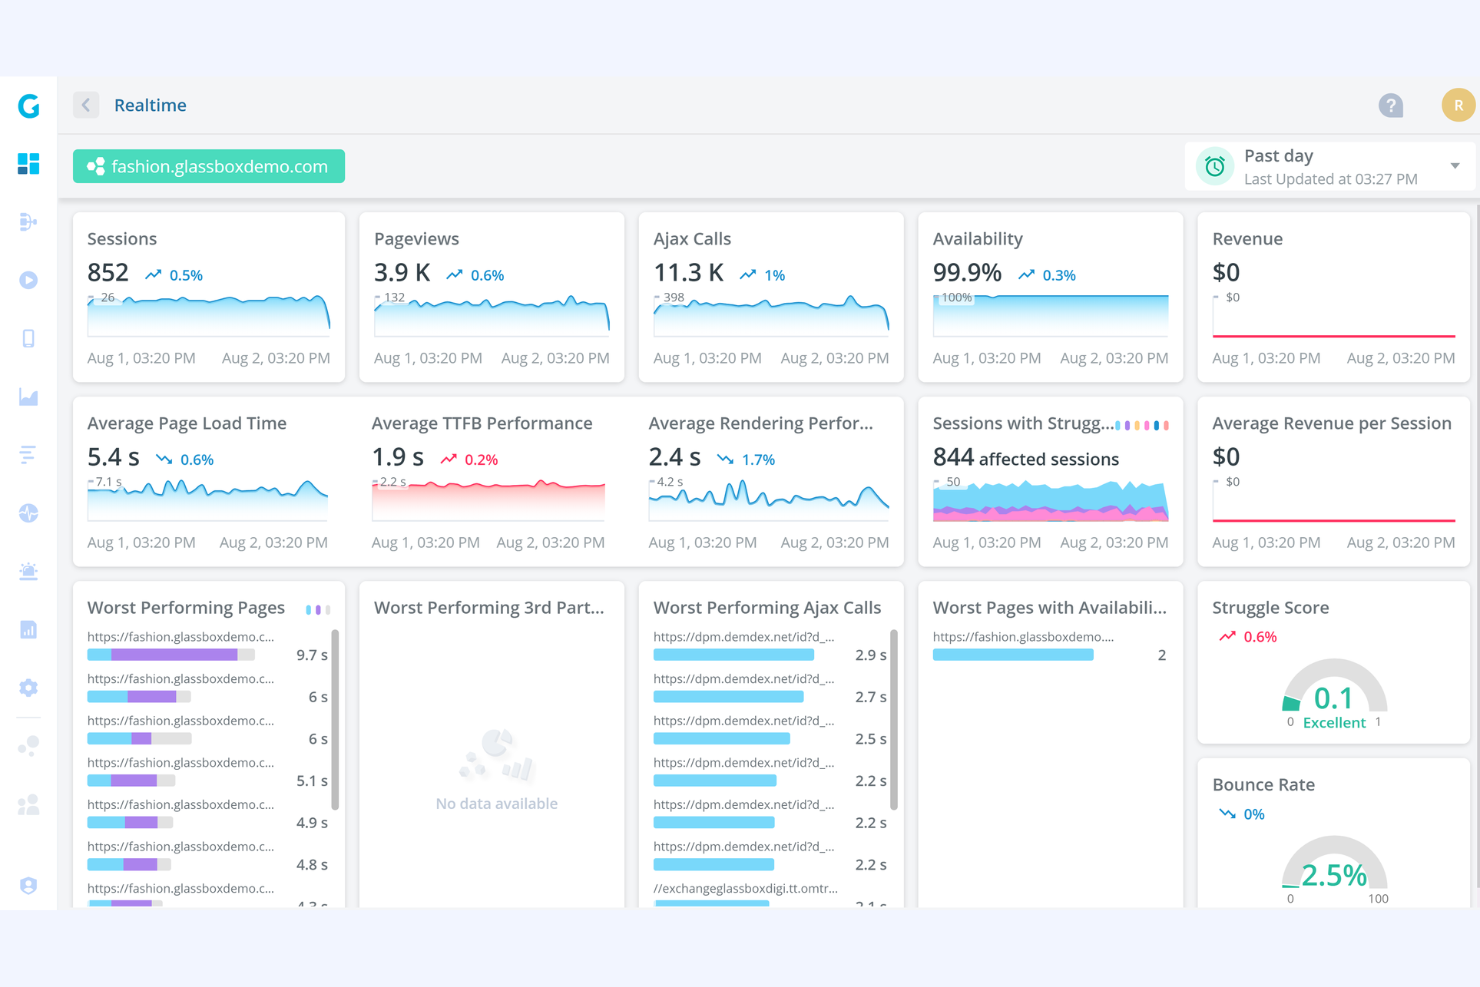
When you need to see exactly how users interact with your digital products, Glassbox offers detailed session replay visualization that goes beyond standard event tracking. Product managers and UX teams often turn to Glassbox to uncover friction points and optimize user journeys with visual evidence. Its ability to capture and replay every user session sets it apart from Mixpanel and other analytics platforms focused mainly on quantitative data.
Why Glassbox Is a Good Mixpanel Alternative
Unlike Mixpanel, Glassbox specializes in session replay visualization, letting you watch real user journeys as they happen. I picked Glassbox because it records every click, scroll, and interaction, so you can pinpoint exactly where users struggle or drop off.
Its heatmaps and journey mapping tools add visual context to user behavior, making it easier to identify friction points. For teams focused on understanding the “why” behind user actions, Glassbox offers a level of insight that event-based analytics alone can’t provide.
Glassbox Key Features
Some other features in Glassbox help teams get a fuller picture of user experience:
- Crash Analytics: Track and analyze app or site crashes to identify technical issues affecting users.
- Tagless Data Capture: Collect user interaction data without manual tagging or code changes.
- Voice of Customer Integration: Combine session data with direct customer feedback for deeper insights.
- Compliance Monitoring: Monitor and audit user sessions to support regulatory and privacy requirements.
Glassbox Integrations
Integrations include Google Analytics, Adobe Analytics, Blue Triangle, Google Tag Manager, Survey Monkey, Qualtrics, and more.
Pros and Cons
Pros:
- Crash analytics highlights technical issues affecting users
- Tagless tracking reduces manual setup effort
- Session replay provides clear visibility into user behavior
Cons:
- Setup may require technical involvement
- Reporting flexibility can feel limited for advanced use cases
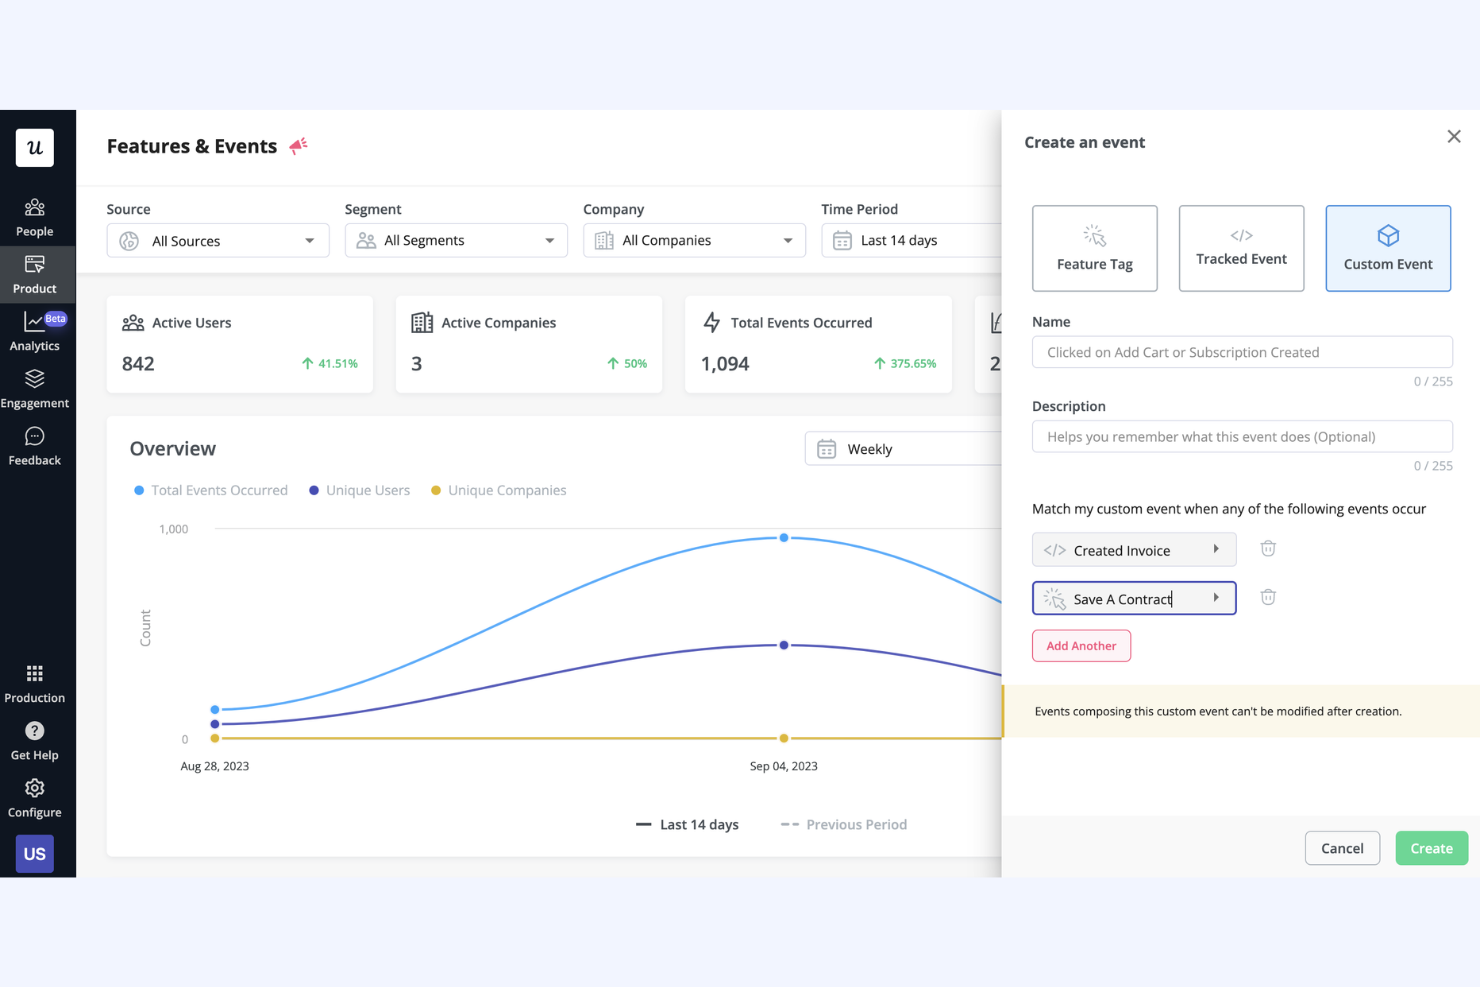
For teams that want to capture every user interaction without manual setup, Heap offers automatic event tracking across web and mobile products. This platform appeals to product managers and analysts who need retroactive data and flexible analysis without relying on developer resources. Heap is especially useful if you want to answer new product questions quickly, even when you didn’t plan to track specific events.
Why Heap Is a Good Mixpanel Alternative
Unlike most analytics platforms, Heap automatically captures every user interaction without requiring manual event tagging. I picked Heap as a Mixpanel alternative because its automatic event tracking means you never miss important data, even if you didn’t anticipate what you’d need to measure.
You can retroactively analyze user behavior, create new events on the fly, and answer product questions as they come up. This approach is especially valuable for teams that want flexibility and speed in their analytics process.
Heap Key Features
Some other features in Heap help teams get more from their analytics platform:
- Session Replay: Watch recordings of real user sessions to see exactly how people interact with your product.
- Data Enrichment: Combine user data from multiple sources to build richer user profiles and context.
- Retroactive Funnels: Build and adjust funnels at any time to analyze conversion paths without predefining steps.
- User-Level Analysis: Drill down to individual user journeys and behaviors for more granular insights.
Heap Integrations
Integrations include Salesforce, Marketo, Intercom, Iterable, Shopify, Snowflake, Amazon Web Services, WalkMe, Klaviyo, and Segment.
Pros and Cons
Pros:
- Session replay adds visual context to user behavior
- Retroactive analysis allows flexible data exploration
- Automatic event tracking captures user actions without setup
Cons:
- Performance can slow with large datasets
- Complex data structures can require technical expertise and high learning curve
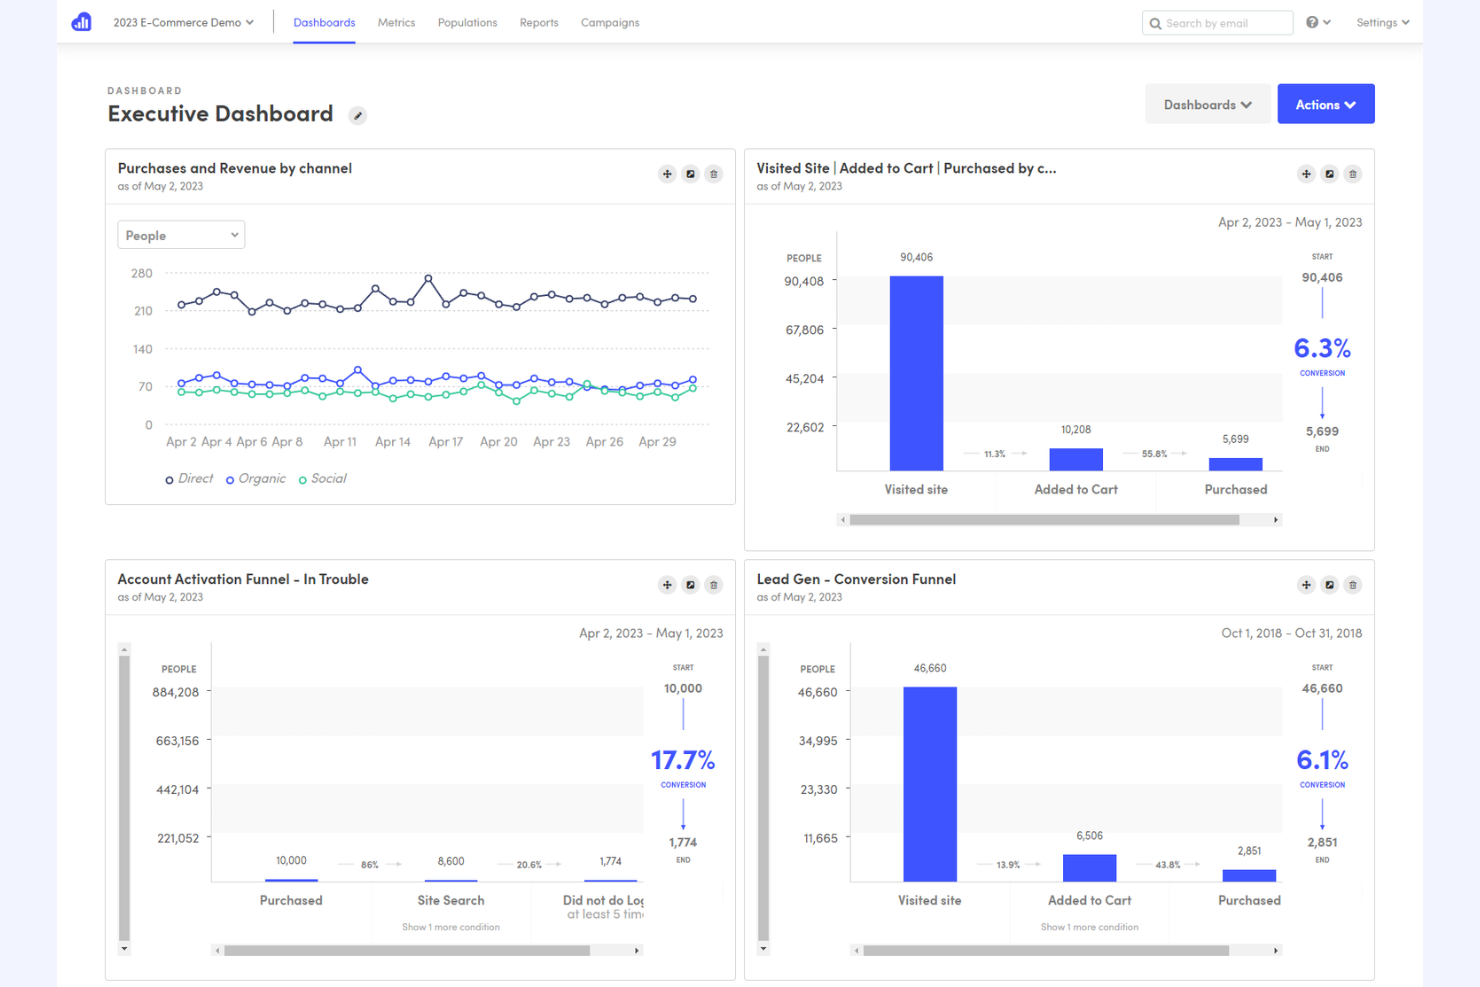
For teams focused on understanding and improving funnel performance, Kissmetrics offers detailed tracking and analysis of user flows. Growth marketers and product managers use Kissmetrics to pinpoint where users drop off and optimize conversion paths across web and mobile. Its event-based funnel reporting and cohort analysis give you a clear view of how changes impact each stage, setting it apart from Mixpanel’s broader analytics approach.
Why Kissmetrics Is a Good Mixpanel Alternative
If you need to track and optimize funnel performance in detail, Kissmetrics is built for that purpose. I picked Kissmetrics because its funnel analysis tools let you visualize each step of the user journey and quickly spot where users drop off. The platform’s cohort analysis helps you compare how different user groups move through funnels over time. For teams that want to focus on conversion optimization, Kissmetrics offers a more targeted approach than Mixpanel’s broader analytics toolkit.
Kissmetrics Key Features
Some other features in Kissmetrics help teams get a more complete view of user behavior and product performance:
- Revenue Reporting: Track revenue metrics tied directly to user actions and segments.
- A/B Test Tracking: Monitor the impact of experiments on user behavior and conversions.
- Email Campaign Analytics: Measure how email campaigns influence user activity and funnel progression.
- Multi-Device Tracking: Follow individual users across devices for a unified behavioral profile.
Kissmetrics Integrations
Integrations include Salesforce, Shopify, WordPress, HubSpot, Google Analytics, Segment, Marketo, Optimizely, Zapier, Mailchimp, and more.
Pros and Cons
Pros:
- Revenue tracking connects usage to outcomes
- Cohort tracking shows behavior changes over time
- Funnel analysis highlights conversion drop-off points
Cons:
- Dashboard customization is limited
- Event setup may require developer involvement
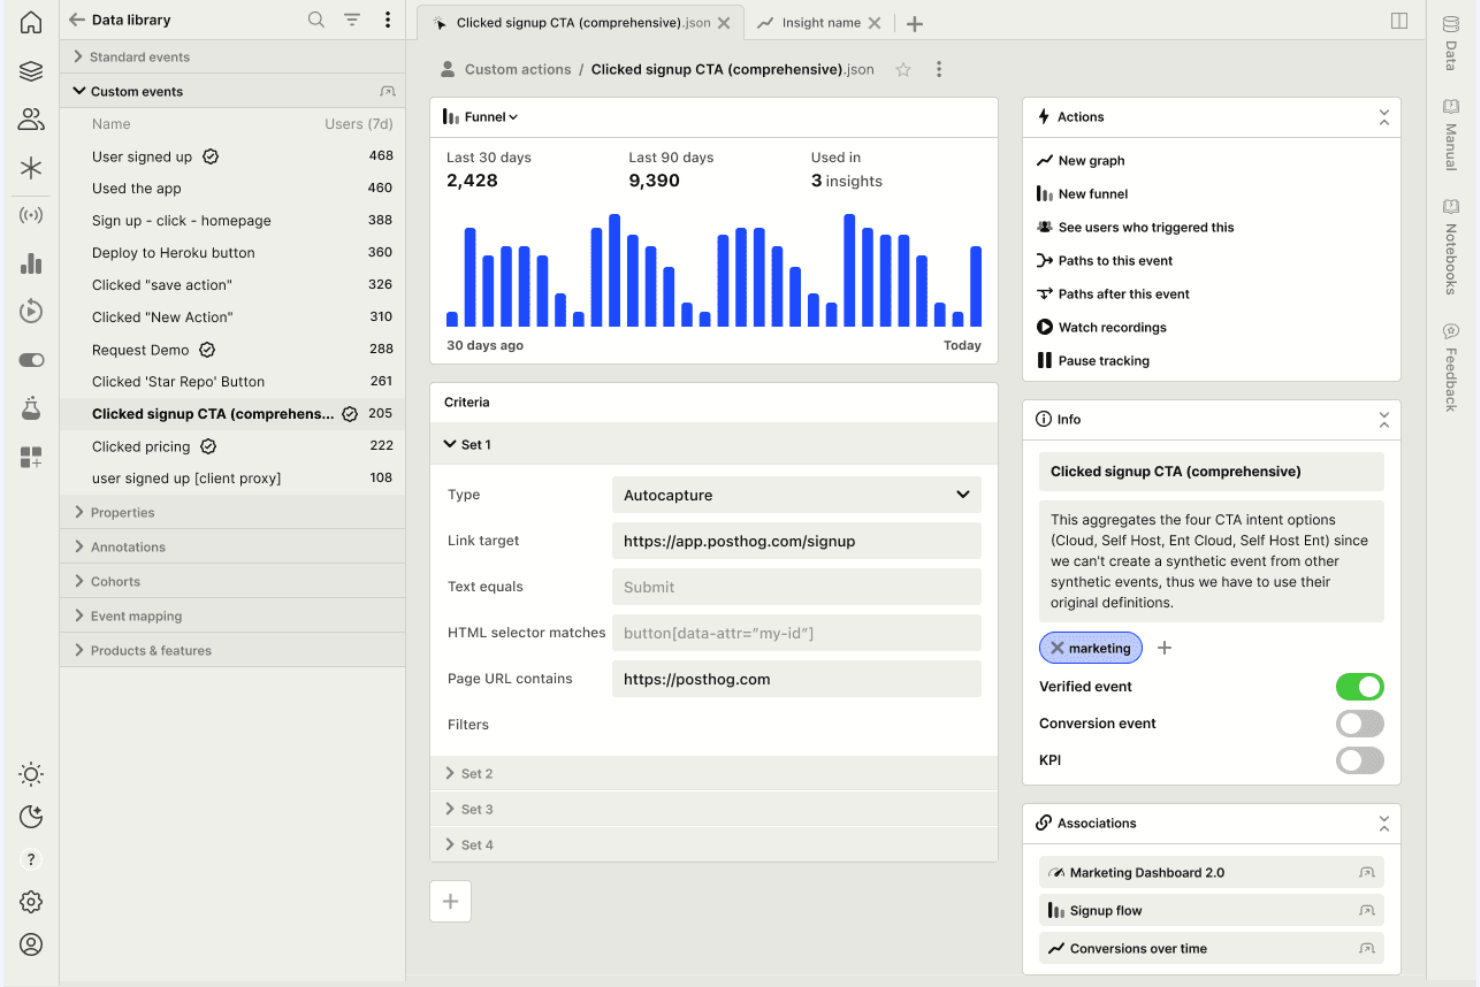
If you need full control over your analytics infrastructure, PostHog offers a self-hosted product analytics platform that puts your data on your own servers. This tool is a strong fit for privacy-conscious organizations, regulated industries, or teams with strict data residency requirements. PostHog stands out for its flexible deployment options and developer-friendly features that let you customize analytics to your exact needs.
Why PostHog Is a Good Mixpanel Alternative
For teams that need to keep analytics data on-premises or within their own cloud, PostHog is a strong alternative to Mixpanel. I picked PostHog because it offers self-hosted deployment, giving you full control over your data and compliance.
You can run the entire analytics stack on your own infrastructure, customize event tracking, and manage user privacy according to your organization’s requirements. This makes PostHog especially appealing for businesses in regulated industries or those with strict data governance needs.
PostHog Key Features
Some other features in PostHog help teams get deeper insights and control:
- Session Recording: Capture and replay user sessions to see exactly how people interact with your product.
- Feature Flags: Roll out new features to specific user segments and control releases without redeploying code.
- A/B Testing: Run experiments directly within the platform to measure the impact of product changes.
- Plugin Marketplace: Extend analytics capabilities with a library of community-built and official plugins.
PostHog Integrations
PostHog integrates with GitHub, GitLab, Linear, and Jira.
Pros and Cons
Pros:
- Session recording provides clear behavioral insights
- Feature flags and experiments built into the platform
- Self-hosted deployment supports strong data control needs
Cons:
- Dashboards and reporting are less advanced
- Setup and maintenance require technical resources
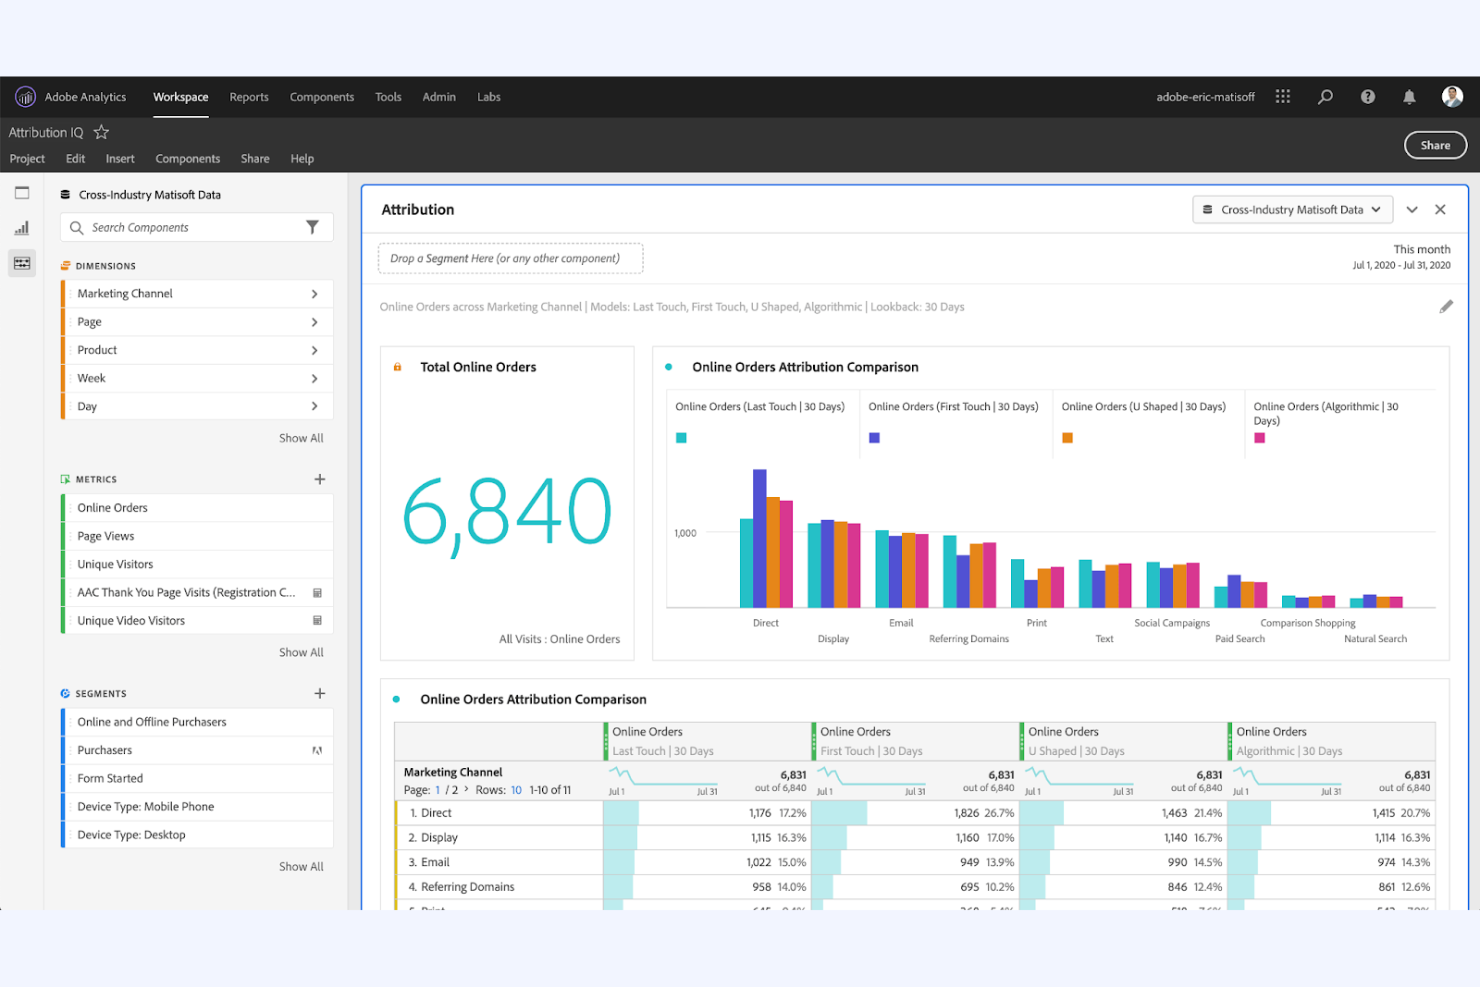
For teams that need to understand the full impact of every customer touchpoint, Adobe Analytics delivers advanced attribution modeling and cross-channel analysis. Enterprise marketers and digital analysts often choose Adobe Analytics to connect data from web, mobile, and offline sources for a unified view of the customer journey. Its flexible attribution models and deep integration with the Adobe Experience Cloud set it apart from Mixpanel and other analytics platforms.
Why Adobe Analytics Is a Good Mixpanel Alternative
If you need to measure the true impact of every marketing channel, Adobe Analytics offers advanced attribution modeling that goes beyond what Mixpanel provides. I picked Adobe Analytics because its customizable attribution models let you assign credit to touchpoints across web, mobile, and offline interactions.
The platform’s data-driven attribution and cross-channel analysis help you understand how each step in the customer journey contributes to conversions. These features make Adobe Analytics a strong choice for teams focused on optimizing multi-channel campaigns and understanding complex user paths.
Adobe Analytics Key Features
Some other features in Adobe Analytics help teams get more from their data:
- Real-Time Data Reporting: Access up-to-the-minute analytics on user activity across channels.
- Segmentation Tools: Create and analyze custom user segments based on detailed behavioral and demographic criteria.
- Anomaly Detection: Automatically surface unusual trends or outliers in your data using machine learning.
- Customizable Dashboards: Build and share dashboards tailored to specific metrics, teams, or business goals.
Adobe Analytics Integrations
Integrations include Adobe Experience Cloud, Adobe Target, Adobe Audience Manager, Adobe Campaign, Google Ads, Microsoft Advertising, Salesforce, Marketo, Tableau, Power BI, and Snowflake.
Pros and Cons
Pros:
- Real-time reporting supports fast decision-making
- Segmentation tools enable detailed audience breakdowns
- Advanced attribution models support multi-channel analysis
Cons:
- Interface can feel complex for non-technical users
- Implementation requires significant technical resources
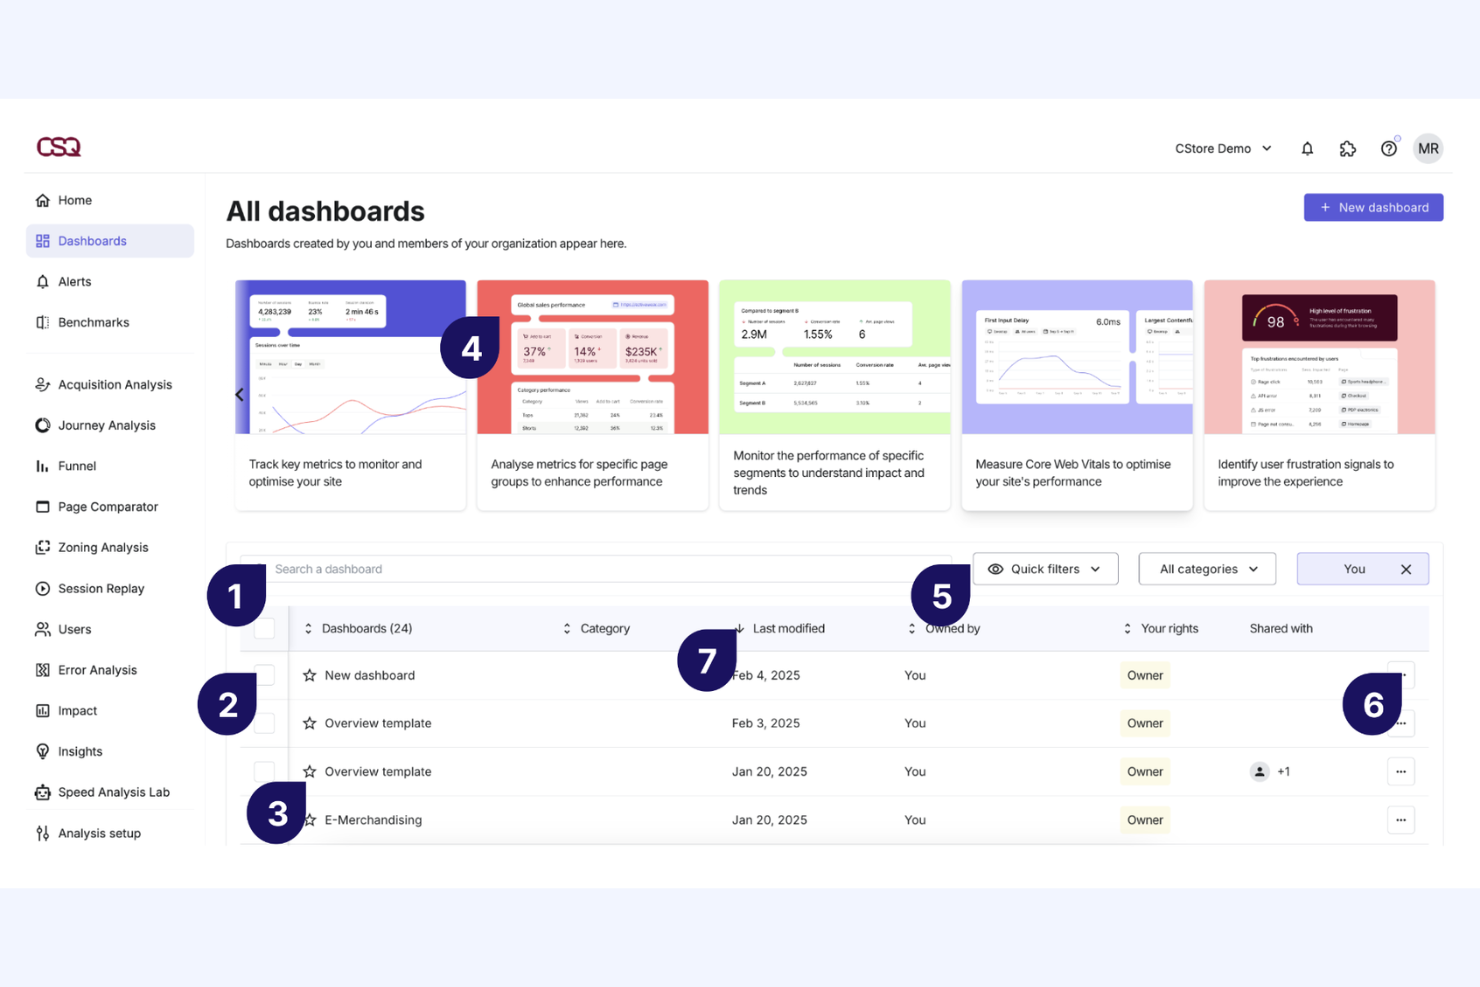
For teams that need a clear, visual map of every digital touchpoint, Contentsquare offers digital experience mapping that goes far beyond basic analytics dashboards. Digital product leaders and CX professionals use Contentsquare to visualize user flows, segment behaviors, and spot friction across web and mobile journeys. Its unique zoning analysis and granular journey mapping set it apart from Mixpanel and other event-based analytics tools.
Why Contentsquare Is a Good Mixpanel Alternative
If you want to visualize the entire digital customer journey, Contentsquare offers digital experience mapping that goes deeper than event-based analytics. I picked Contentsquare because its zoning analysis lets you see exactly how users interact with every element on a page, not just which events they trigger.
The journey mapping feature helps you track user paths across multiple sessions and devices, revealing friction points and drop-offs. For teams focused on optimizing the full experience, Contentsquare provides a level of journey visualization that Mixpanel doesn’t match.
Contentsquare Key Features
Some other features in Contentsquare help teams analyze and optimize digital experiences:
- Session Replay: Watch real user sessions to understand specific behaviors and issues.
- AI-Powered Insights: Surface anomalies and trends automatically using machine learning.
- Form Analysis: Track and analyze user interactions with forms to identify drop-off points.
- Mobile App Analytics: Monitor and assess user journeys within native mobile applications.
Contentsquare Integrations
Integrations include Shopify, AWS, Microsoft Azure, Snowflake, and more.
Pros and Cons
Pros:
- AI insights highlight trends and anomalies
- Zoning analysis shows interaction with page elements
- Journey mapping visualizes full digital experience paths
Cons:
- Data sampling may limit full visibility
- Implementation can require significant setup effort
For teams focused on understanding website visitor behavior, Google Analytics offers detailed traffic analysis and reporting. This platform is especially useful for digital marketers, ecommerce managers, and content teams who need to track site performance and user journeys. Unlike Mixpanel, Google Analytics specializes in granular website data, making it a go-to choice for optimizing web traffic and conversion funnels.
Why Amplitude Is a Good Mixpanel Alternative
Amplitude stands out for teams that need to analyze user behavior at a granular level. I picked Amplitude because its behavioral cohort analysis lets you group users based on specific actions and track how those groups engage over time. The platform’s retention analysis and funnel exploration tools help you pinpoint where users drop off and what drives long-term engagement. These features make Amplitude especially valuable for product teams focused on understanding and improving user retention.
Amplitude Key Features
Some other features in Amplitude help teams get more from their product data:
- User Path Analysis: Visualize the different paths users take through your product to identify common journeys and drop-off points.
- A/B Test Analytics: Measure the impact of experiments and feature releases directly within the analytics platform.
- Data Governance Tools: Manage event tracking, enforce naming conventions, and maintain data quality across teams.
- Custom Dashboards: Build and share dashboards tailored to specific metrics or team needs.
Amplitude Integrations
Integrations include Twilio Segment, Braze, Amazon, HubSpot, Google Search Console, Google Ads, Hotjar, LaunchDarkly, Mailchimp, Marketo, Notion, Salesforce CRM, and more.
Pros and Cons
Pros:
- Scalable cloud platform built for high-growth startups and SaaS teams
- Self-service analytics for business users exploring user journeys
- Advanced product data analysis with behavioral funnel insights
Cons:
- Advanced features may require technical setup and ongoing management
- Visualization options less flexible than traditional BI tools


Criteri di selezione delle alternative a Mixpanel
Nella selezione delle migliori alternative a Mixpanel da includere in questa lista, ho preso in considerazione le esigenze comuni degli acquirenti e le criticità legate a prodotti di piattaforme di analytics, come il monitoraggio del comportamento utente attraverso funnel complessi e la connessione fra utilizzo del prodotto e risultati di business. Ho anche usato questo schema per mantenere la valutazione strutturata ed equa:
Funzionalità di base (25% del punteggio totale)
Per essere inclusa in questa lista, ciascuna soluzione doveva coprire questi casi d’uso comuni:
- Monitorare eventi e azioni degli utenti
- Visualizzare percorsi utente e funnel
- Segmentare gli utenti per comportamento o attributi
- Analizzare l’engagement e le tendenze delle coorti
- Generare report e dashboard personalizzabili
Funzionalità aggiuntive di rilievo (25% del punteggio totale)
Per restringere ulteriormente la selezione, ho valutato anche la presenza di funzionalità distintive, come:
- Analisi dei ricavi integrata
- Tracciamento utenti su più dispositivi
- Analisi avanzata dei test A/B
- Rilevamento automatico delle anomalie
- Strumenti di messaggistica in-app o survey
Usabilità (10% del punteggio totale)
Per capire quanto fosse semplice utilizzare ogni sistema, ho considerato i seguenti aspetti:
- Navigazione intuitiva e layout del cruscotto
- Impostazione e gestione degli eventi chiare
- Accesso rapido a report e approfondimenti chiave
- Minimo numero di clic per completare le attività comuni
- Interfaccia moderna e visivamente attraente
Onboarding (10% del punteggio totale)
Per valutare l’esperienza di onboarding di ciascuna piattaforma, ho considerato i seguenti aspetti:
- Disponibilità di guide all’installazione passo-passo
- Accesso a video formativi e documentazione
- Tour di prodotto o walkthrough interattivi
- Modelli predefiniti per casi d’uso comuni
- Supporto di onboarding reattivo o chatbot
Supporto Clienti (10% del punteggio totale)
Per valutare i servizi di assistenza clienti di ciascun fornitore di software, ho preso in considerazione i seguenti punti:
- Molteplici canali di assistenza come chat, email e telefono
- Tempi di risposta rapidi alle richieste
- Accesso a un centro assistenza ricercabile
- Disponibilità di supporto tecnico e per l’onboarding
- Forum della community o gruppi di utenti
Rapporto Qualità/Prezzo (10% del punteggio totale)
Per valutare il rapporto qualità/prezzo di ciascuna piattaforma, ho preso in esame i seguenti criteri:
- Piani tariffari trasparenti e flessibili
- Funzionalità incluse in ogni livello di prezzo
- Disponibilità di prova gratuita o demo
- Nessun costo nascosto o addebiti a sorpresa
- Scalabilità per team in crescita
Recensioni dei Clienti (10% del punteggio totale)
Per avere un’idea della soddisfazione generale dei clienti, ho considerato i seguenti aspetti leggendo le recensioni:
- Feedback positivo sull’accuratezza delle analisi
- Segnalazioni di prestazioni affidabili della piattaforma
- Commenti sulla reattività del supporto
- Sentimento degli utenti sugli aggiornamenti delle funzionalità
- Soddisfazione generale per il valore e il ROI
Perché cercare un’alternativa a Mixpanel?
Sebbene Mixpanel sia una buona scelta come piattaforma di analisi di prodotto, esistono diversi motivi per cui alcuni utenti cercano soluzioni alternative. Potresti essere alla ricerca di un’alternativa a Mixpanel perché...
- Hai bisogno di opzioni di prezzo più trasparenti o flessibili
- Il tuo team desidera analisi sui funnel o sui ricavi più approfondite
- Richiedi hosting dei dati on-premise o specifico per regione
- Hai bisogno di integrazioni native con strumenti specifici che Mixpanel non supporta
- La tua organizzazione preferisce un’interfaccia più semplice o personalizzabile
Se ti riconosci in una di queste situazioni, sei nel posto giusto. Il mio elenco include diverse alternative di piattaforme di analisi di prodotto più adatte ai team che affrontano queste sfide con Mixpanel e sono alla ricerca di soluzioni diverse.
Funzionalità principali di Mixpanel
Ecco alcune delle principali funzionalità di Mixpanel, per aiutarti a confrontare e comparare con ciò che offrono le soluzioni alternative:
- Monitoraggio basato su eventi per un’analisi dettagliata del comportamento degli utenti
- Analisi dei funnel per individuare i punti di abbandono nei percorsi utente
- Analisi delle coorti per monitorare la retention e l’engagement degli utenti
- Dashboard e report personalizzati per approfondimenti su misura
- Strumenti di A/B testing per misurare l’impatto delle modifiche al prodotto
- Segmentazione degli utenti in base a comportamento e attributi
- Analisi in tempo reale per avere dati sempre aggiornati
- Strumenti di visualizzazione dei dati per insight chiari e azionabili
- Supporto per analisi sia mobile che web
- Avvisi automatici per cambiamenti significativi nell’attività degli utenti