10 Migliori alternative a SolarWinds nel 2026

Lista dei concorrenti di SolarWinds


I migliori concorrenti di SolarWinds offrono un monitoraggio IT completo, con una crescente attenzione all’esperienza digitale e alle prestazioni percepite dagli utenti. Se stai valutando delle alternative, probabilmente cerchi strumenti che non solo controllano lo stato dei sistemi, ma ottimizzano anche l’esperienza degli utenti sui tuoi siti web, applicazioni e servizi.
Scegliere la soluzione giusta è particolarmente importante nella fase di analisi, dove comprendere sia il comportamento dell’infrastruttura sia l’esperienza utente aiuta i team a prendere decisioni più informate.
In questo elenco troverai piattaforme economiche e intuitive, con funzionalità avanzate e componenti aggiuntivi flessibili, pensate per PMI e grandi aziende che desiderano migliorare le prestazioni e offrire migliori esperienze digitali.
Che cos’è SolarWinds?
SolarWinds è una piattaforma per la gestione integrata dell’infrastruttura IT che aiuta i team a monitorare, analizzare e ottimizzare le prestazioni di rete in ambienti complessi. Include funzionalità di network performance monitor (NPM), monitoraggio remoto e visibilità su sistemi critici come router e firewall.
I team IT utilizzano SolarWinds per migliorare le prestazioni di rete, mantenere l’operatività e avere un maggiore controllo su sistemi distribuiti. La trasparenza dei prezzi e l’approccio conveniente lo rendono una scelta pratica sia per piccole aziende che per grandi organizzazioni che vogliono un monitoraggio affidabile senza complessità inutili.
Riepilogo dei migliori concorrenti di SolarWinds
Questa tabella riepilogativa sintetizza i prezzi dei principali concorrenti di SolarWinds da me selezionati, per aiutarti a trovare quello più adatto al tuo budget e alle esigenze della tua azienda.
| Tool | Best For | Trial Info | Price | ||
|---|---|---|---|---|---|
| 1 | Best for AI-powered root cause analysis | Free trial available | From $7/host/month | Website | |
| 2 | Best for hybrid infrastructure observability | Free 15-day trial | From $16/hybrid unit/month | Website | |
| 3 | Best with extensive plugin support | Free plan and free demo available | From $2,595 (perpetual license for 100 nodes) | Website | |
| 4 | Best for open-source network visibility | Free download available | From $325/month (billed annually) | Website | |
| 5 | Best with real-time analytics for digital operations | Free plan available | From $49/user/month | Website | |
| 6 | Best for unified monitoring across cloud environments | 14-day free trial | From $15/host/month (billed annually) | Website | |
| 7 | Best for cloud-native log management | 30-day free trial | Pricing upon request | Website | |
| 8 | Best for multi-cloud service health tracking | Free trial + free demo available | Pricing upon request | Website | |
| 9 | Best with sensor-based infrastructure monitoring | 30-day free trial | From $179/month (billed annually) | Website | |
| 10 | Best for automated network mapping | 14-day free trial + free demo available | Pricing upon request | Website |
Perché Fidarti delle Nostre Recensioni
Testiamo e recensiamo software dal 2020. Come leader CX, sappiamo quanto sia fondamentale e difficile prendere la decisione giusta nella scelta di un software. Investiamo in ricerche approfondite per aiutare il nostro pubblico a fare scelte migliori sui software. Abbiamo testato oltre 2.000 strumenti per diversi casi d’uso CX e pubblicato più di 1.000 recensioni dettagliate. Scopri come rimaniamo trasparenti & la nostra metodologia di valutazione del software.
-

SupportYourApp
Visit WebsiteThis is an aggregated rating for this tool including ratings from Crozdesk users and ratings from other sites.4.7 -
Tidio
Visit WebsiteThis is an aggregated rating for this tool including ratings from Crozdesk users and ratings from other sites.4.7 -
Freshdesk
Visit WebsiteThis is an aggregated rating for this tool including ratings from Crozdesk users and ratings from other sites.4.4


Recensioni dei concorrenti di SolarWinds
Di seguito trovi le mie recensioni dettagliate delle migliori alternative a SolarWinds che sono entrate nella mia shortlist. Le mie analisi offrono uno sguardo approfondito su funzionalità, integrazioni e prezzi di ogni software, per aiutarti a trovare quello giusto per te.
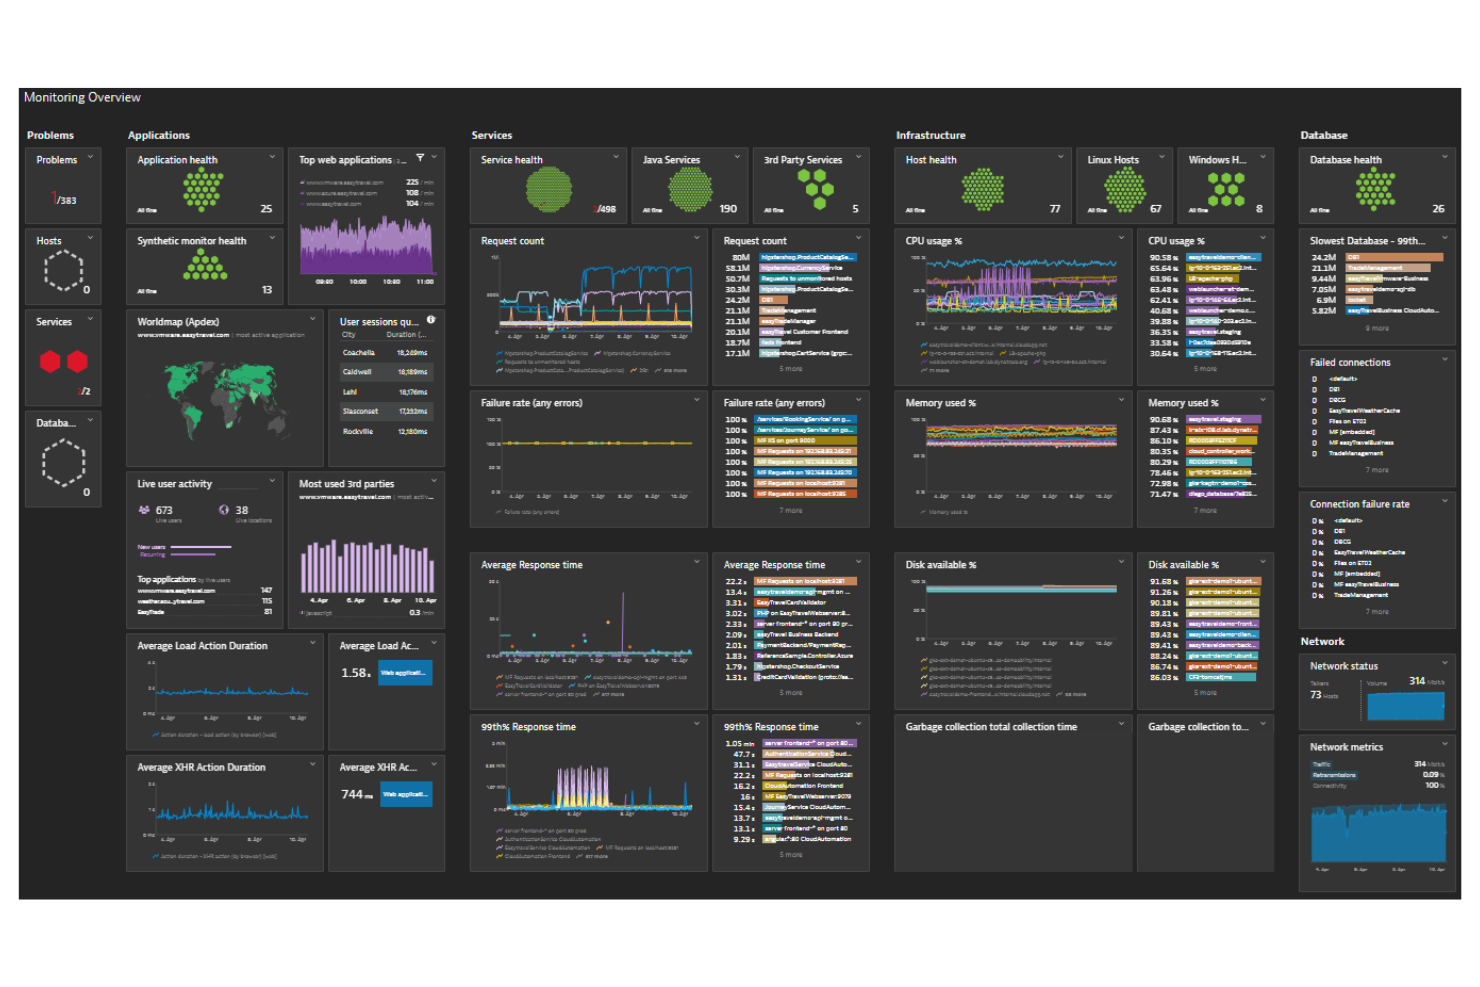
Dynatrace is a digital performance monitoring platform designed for IT teams and service operations leaders who need deep visibility into modern cloud environments. It’s especially useful for organizations that want to focus on the health of their applications and infrastructure.
If you’re looking to reduce incident resolution times and proactively address user issues, Dynatrace brings monitoring, automation, and support insights together in one place.
Who Is Dynatrace Best For?
Dynatrace is a strong choice for IT operations teams and enterprises managing complex, cloud-native environments that require automated monitoring and rapid incident response.
Why Dynatrace Is a Good SolarWinds Competitor
What makes Dynatrace stand out is its AI-powered root cause analysis, which is especially valuable for support teams dealing with complex, multi-layered systems. I picked Dynatrace because its Davis AI engine automatically pinpoints the source of incidents across applications, infrastructure, and user experience data.
This means your team can move from alert to actionable insight without manual correlation or guesswork. For organizations that need to resolve issues quickly and reduce downtime, Dynatrace’s automated problem detection and contextual analysis offer a clear advantage over traditional monitoring tools.
Dynatrace Key Features
Some other features in Dynatrace that help support and IT teams manage digital operations include:
- Full-stack monitoring: Dynatrace tracks performance across applications, infrastructure, and networks in real time.
- Session replay: This feature lets you view user sessions to diagnose issues from the end-user perspective.
- Custom dashboards: Build tailored dashboards to visualize key metrics and monitor service health at a glance.
- Automated deployment monitoring: Dynatrace automatically detects and monitors new deployments without manual configuration.
Dynatrace Integrations
Integrations include AWS, Microsoft Azure, Google Cloud Platform, Kubernetes, Slack, Jira, PagerDuty, GitHub, JetBrains, and ServiceNow.
Pros and Cons
Pros:
- Session replay helps diagnose user experience issues
- Full-stack monitoring across applications and infrastructure
- AI-driven root cause analysis reduces troubleshooting time
Cons:
- Initial setup can be complex for some teams
- Alert tuning may be required to reduce noise
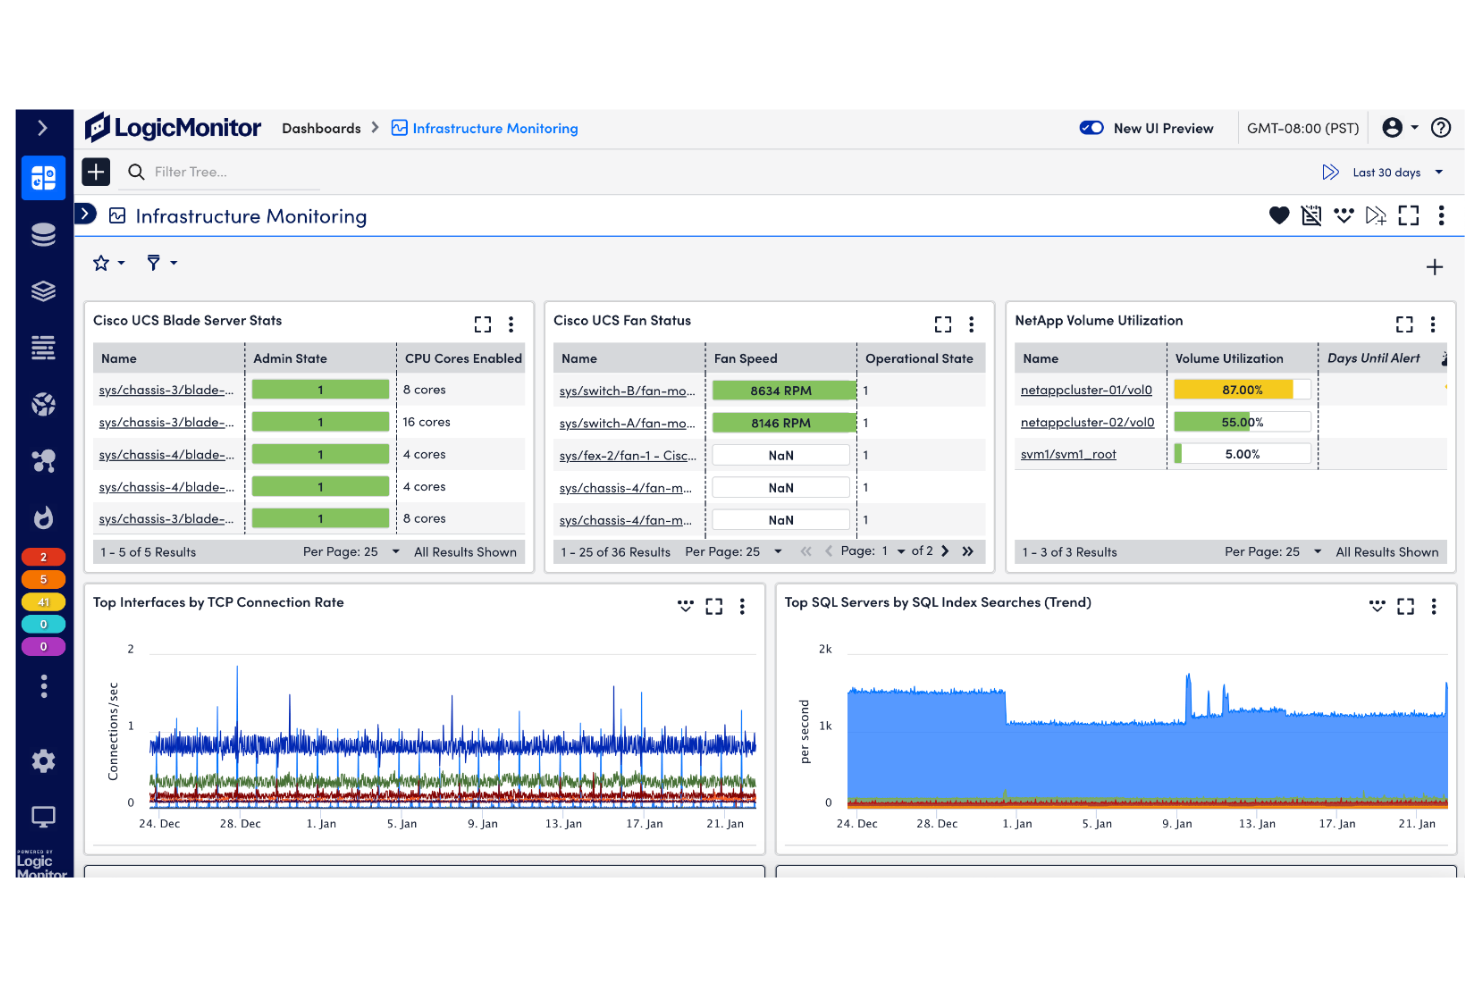
LogicMonitor is a cloud-based monitoring platform designed for IT teams managing complex, distributed environments. It appeals to organizations that need unified visibility across on-premises, cloud, and hybrid infrastructure. If you’re looking for a SolarWinds alternative that emphasizes automated discovery and deep observability, LogicMonitor is worth considering.
Who Is LogicMonitor Best For?
LogicMonitor is a strong fit for mid-sized to large enterprises with IT teams responsible for managing hybrid or multi-cloud infrastructure.
Why LogicMonitor Is a Good SolarWinds Competitor
What makes LogicMonitor a strong SolarWinds competitor is its focus on hybrid infrastructure observability. I picked LogicMonitor because it automatically discovers devices and services across both on-premises and cloud environments, giving IT teams a unified view. Its dynamic topology mapping and AI-driven anomaly detection help teams quickly identify and resolve issues across complex, distributed systems.
For organizations managing a mix of legacy and modern infrastructure, LogicMonitor offers the depth and flexibility needed to keep everything visible and under control.
LogicMonitor Key Features
Some other features in LogicMonitor that help IT teams manage complex environments include:
- Role-based access control: Assign granular permissions to users and groups for secure monitoring and management.
- Customizable dashboards: Build and share visual dashboards to track key metrics and system health in real time.
- Automated alert routing: Route alerts to the right team members based on customizable rules and escalation policies.
- REST API access: Integrate LogicMonitor with other IT systems and automate workflows using its robust API.
LogicMonitor Integrations
Integrations include AWS, Microsoft Azure, Google Cloud Platform, Cisco, VMware, ServiceNow, Slack, PagerDuty, Dell Technologies, and NetApp.
Pros and Cons
Pros:
- Real-time dashboards for infrastructure visibility
- Customizable alerting and escalation workflows
- Automated discovery across hybrid environments
Cons:
- Customer support response can be inconsistent
- Reporting customization options are limited
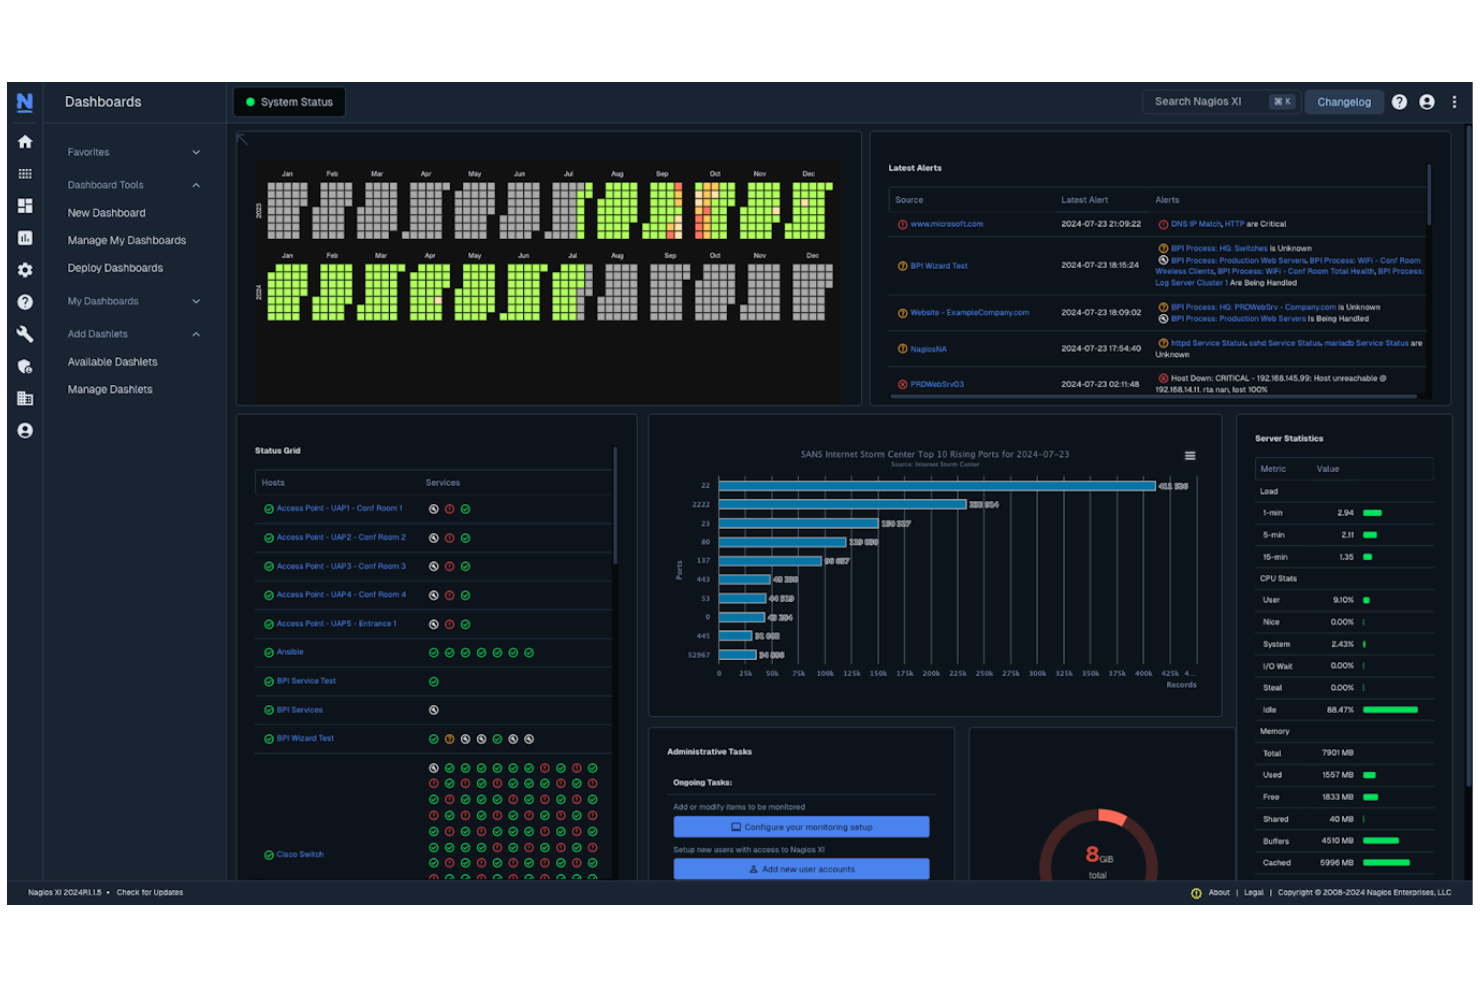
Nagios is a network and infrastructure monitoring platform trusted by IT teams who need deep visibility and control. It’s a strong fit for organizations that want to customize their monitoring environment and integrate with a wide range of systems. If you’re looking for a SolarWinds competitor that offers flexibility and granular monitoring, Nagios is worth considering.
Who Is Nagios Best For?
Nagios is a strong choice for IT administrators and network engineers in mid-sized to large organizations that require customizable infrastructure monitoring.
Why Nagios Is a Good SolarWinds Competitor
What sets Nagios apart from other SolarWinds competitors is its extensive plugin support, which allows teams to tailor monitoring to nearly any device, service, or application. I find that the Nagios Exchange marketplace offers thousands of community-contributed plugins, making it possible to extend monitoring far beyond out-of-the-box capabilities.
This flexibility is especially valuable for help desk teams managing diverse or legacy environments. With Nagios, you can adapt your monitoring setup as your infrastructure evolves, without being limited by vendor constraints.
Nagios Key Features
Some other features in Nagios that help IT and support teams manage infrastructure monitoring include:
- Multi-tenant monitoring: Monitor multiple clients or business units from a single Nagios deployment.
- Custom notification policies: Set up detailed alerting rules based on severity, time, or escalation paths.
- Performance graphing: Visualize historical trends and performance data for monitored devices and services.
- Automated remediation scripts: Trigger scripts to resolve common issues automatically when specific alerts are detected.
Nagios Integrations
Integrations include AWS, Azure, Google Cloud, VMware, Microsoft 365, Slack, ServiceNow, Docker, Ansible, and Chef.
Pros and Cons
Pros:
- Flexible alerting and notification configuration
- Strong community support and resources
- Extensive plugin library for flexible monitoring
Cons:
- Limited built-in reporting capabilities
- Outdated user interface compared to alternatives
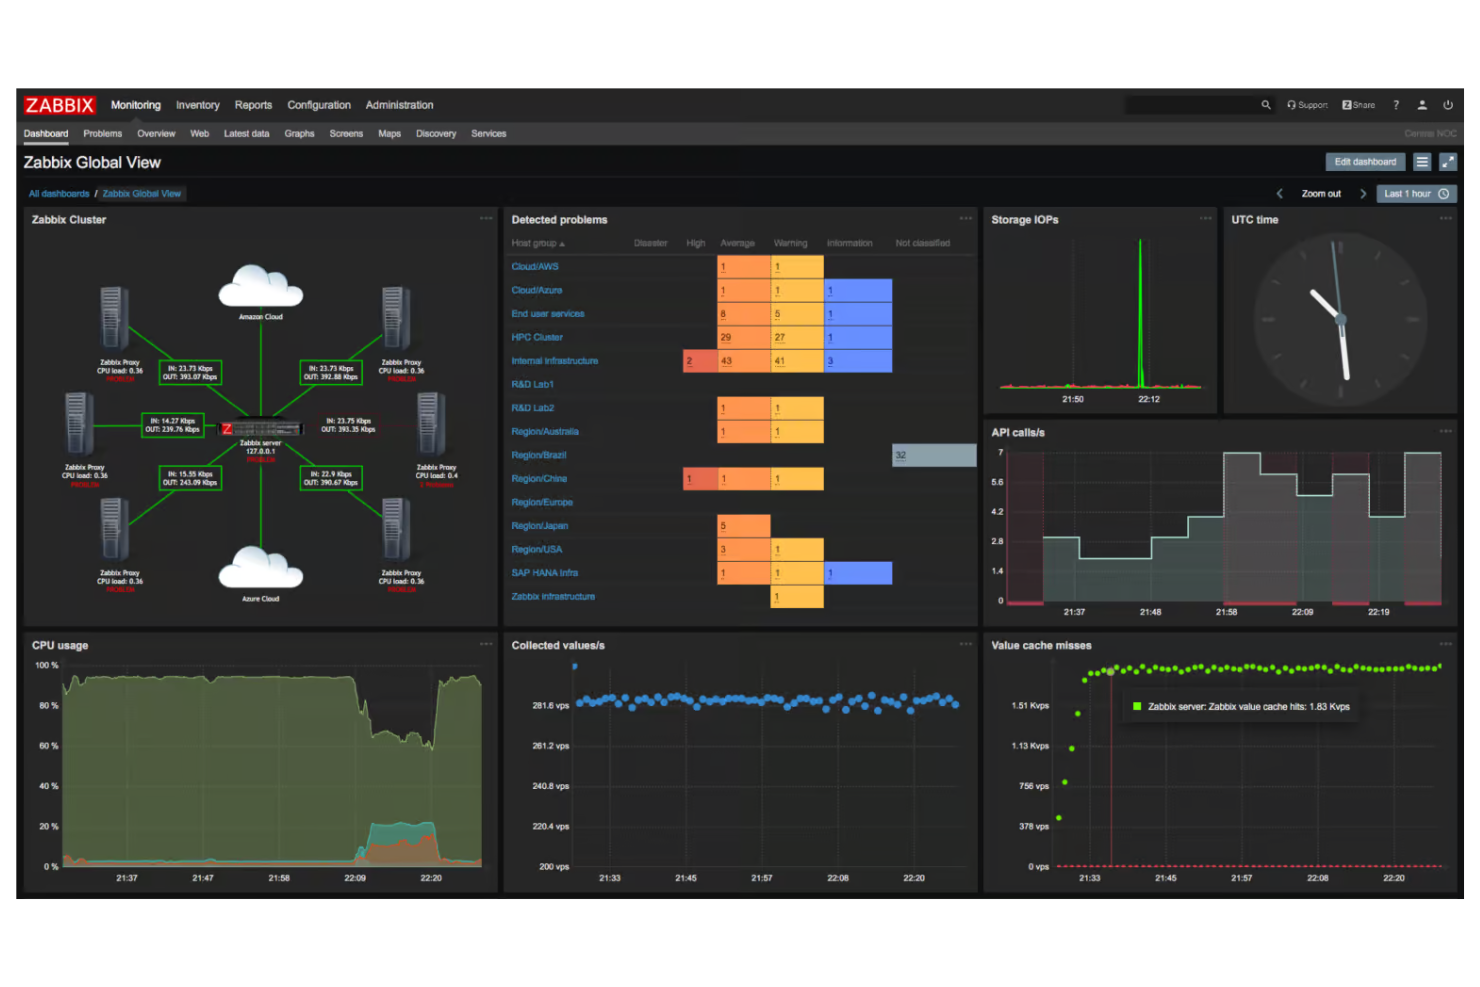
Zabbix is an open-source monitoring platform designed for IT teams that want full control over their network visibility and customization. It’s a strong fit for organizations with technical resources that prefer self-hosted solutions over proprietary alternatives like SolarWinds. If you need deep monitoring capabilities without vendor lock-in, Zabbix offers a flexible approach.
Who Is Zabbix Best For?
Zabbix is a strong choice for IT teams in mid-sized to large enterprises that want open-source, self-hosted network monitoring with extensive customization options.
Why Zabbix Is a Good SolarWinds Competitor
What sets Zabbix apart as a SolarWinds competitor is its open-source approach to network visibility. I picked it because you can deploy Zabbix on your own infrastructure and customize every aspect of monitoring, alerting, and reporting. Its template-driven monitoring lets you track a wide range of devices and services, while the flexible data collection methods support SNMP, IPMI, JMX, and more.
For IT teams that want transparency and control without vendor restrictions, Zabbix offers a compelling alternative.
Zabbix Key Features
Some other features in Zabbix that help IT teams manage complex environments include:
- Role-based access control: Assign granular permissions to users and groups for secure management and data access.
- Customizable dashboards: Build visual dashboards to monitor key metrics and system health in real time.
- Distributed monitoring: Monitor multiple sites and remote locations from a single Zabbix instance.
- Event correlation: Automatically link related alerts to reduce noise and highlight root causes.
Zabbix Integrations
Integrations include AWS, Microsoft Azure, Google Cloud, Cisco, VMware, ServiceNow, Slack, Jira, Grafana, and Oracle.
Pros and Cons
Pros:
- Strong alerting and escalation configuration options
- Supports distributed monitoring across multiple environments
- Highly customizable monitoring with full control
Cons:
- Steep learning curve for new users
- Requires manual setup and ongoing maintenance

New Relic is a cloud-based observability platform designed for IT teams and digital operations leaders who need deep visibility into their systems. It’s a strong choice for organizations that want to correlate performance data with user impact with application and infrastructure performance data.
If you’re looking to troubleshoot incidents faster and understand the root cause of user issues, New Relic brings monitoring and support insights together in one place.
Who Is New Relic Best For?
New Relic is a good fit for IT operations teams and digital businesses that need real-time observability across complex cloud and application environments.
Why New Relic Is a Good SolarWinds Competitor
What sets New Relic apart is its focus on real-time analytics for digital operations, which is especially valuable for support teams managing complex environments. I picked New Relic because it lets you connect application performance with user experience in terms of live application and infrastructure data, so you can quickly pinpoint the root cause of user issues.
Its query builder and customizable dashboards make it easy to visualize and analyze operational data as incidents unfold. For teams that need to respond to problems as they happen, New Relic’s real-time insights offer a clear advantage over more traditional monitoring tools.
New Relic Key Features
Some other features in New Relic that help support and IT teams manage digital operations include:
- Synthetics Monitoring: Simulate user interactions to proactively test application performance and availability.
- Distributed Tracing: Track requests as they move through microservices and infrastructure to identify bottlenecks.
- Error Analytics: Aggregate and analyze error data across applications for faster troubleshooting.
- Service Maps: Visualize dependencies and relationships between services, databases, and infrastructure components.
New Relic Integrations
Integrations include Amazon Web Services, Microsoft Azure, Google Cloud Platform, Kubernetes, Prometheus, SAP, ServiceNow, Pivotal Cloud Foundry, Slack, and GitHub.
Pros and Cons
Pros:
- Custom dashboards for flexible data analysis
- Deep visibility into distributed systems and applications
- Real-time analytics for faster issue detection
Cons:
- Setup complexity for hybrid environments
- Alert noise can require manual adjustment
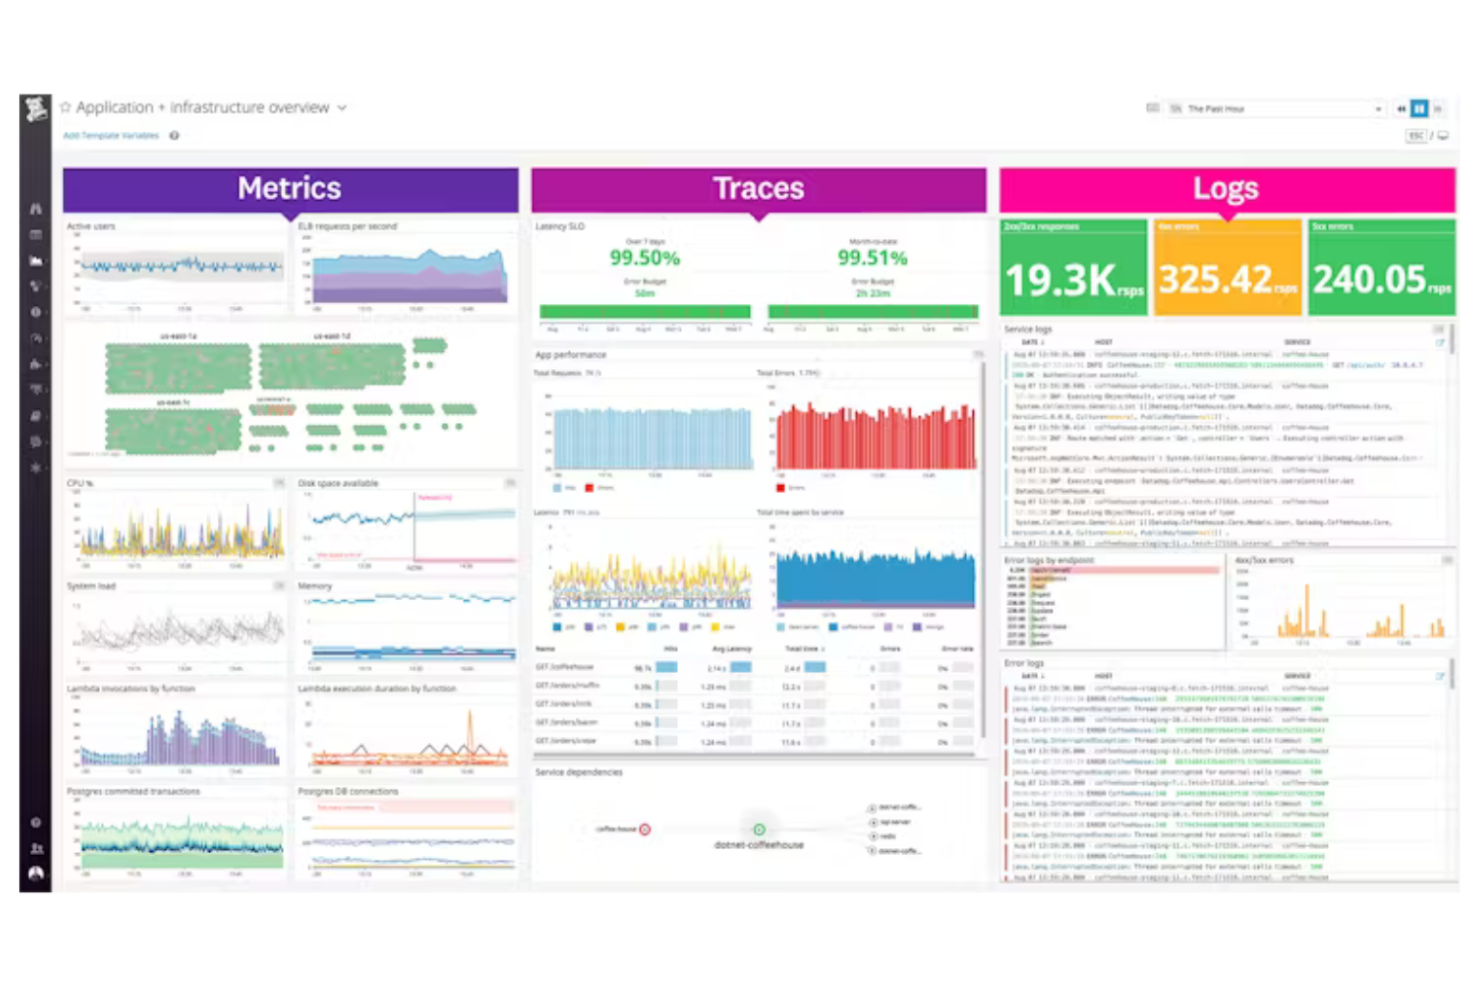
Datadog is a cloud-based monitoring and analytics platform designed for IT teams managing complex environments. It’s a strong fit for organizations that need deep visibility into infrastructure, applications, and logs from a single dashboard.
Who Is Datadog Best For?
Datadog suits IT operations teams in mid-sized to large enterprises that need unified monitoring across cloud and hybrid environments.
Why Datadog Is a Good SolarWinds Competitor
Datadog stands out for teams that need unified monitoring across cloud environments with a strong focus on digital experience and performance visibility. I picked Datadog because it brings infrastructure, application, and log monitoring together in one platform, making it easier to correlate system performance with real user impact.
Its customizable dashboards let you visualize performance data from multiple sources, so you can quickly identify and resolve issues affecting users. For organizations managing distributed or hybrid IT infrastructure, Datadog’s unified view helps reduce blind spots and improve overall system performance.
Datadog Key Features
Some other Datadog features that help IT teams manage support and monitoring together include:
- Incident Management: Create, track, and resolve incidents directly within the platform, linking them to relevant monitoring data.
- Alerting and Notifications: Set up custom alerts and notifications based on specific metrics or thresholds to keep teams informed of critical issues.
- Role-Based Access Control: Assign granular permissions to users, ensuring the right team members have access to the right data and tools.
- API Access: Integrate Datadog with other IT and business systems using robust API endpoints for automation and data sharing.
Datadog Integrations
Integrations include AWS, Azure, Google Cloud Platform, Slack, Jira, PagerDuty, GitHub, GitLab, Docker, and Kubernetes.
Pros and Cons
Pros:
- Automated anomaly detection improves issue identification
- Customizable dashboards for detailed performance visibility
- Real-time monitoring across cloud and hybrid environments
Cons:
- Alert noise may require ongoing tuning
- Initial setup can be complex for hybrid environments
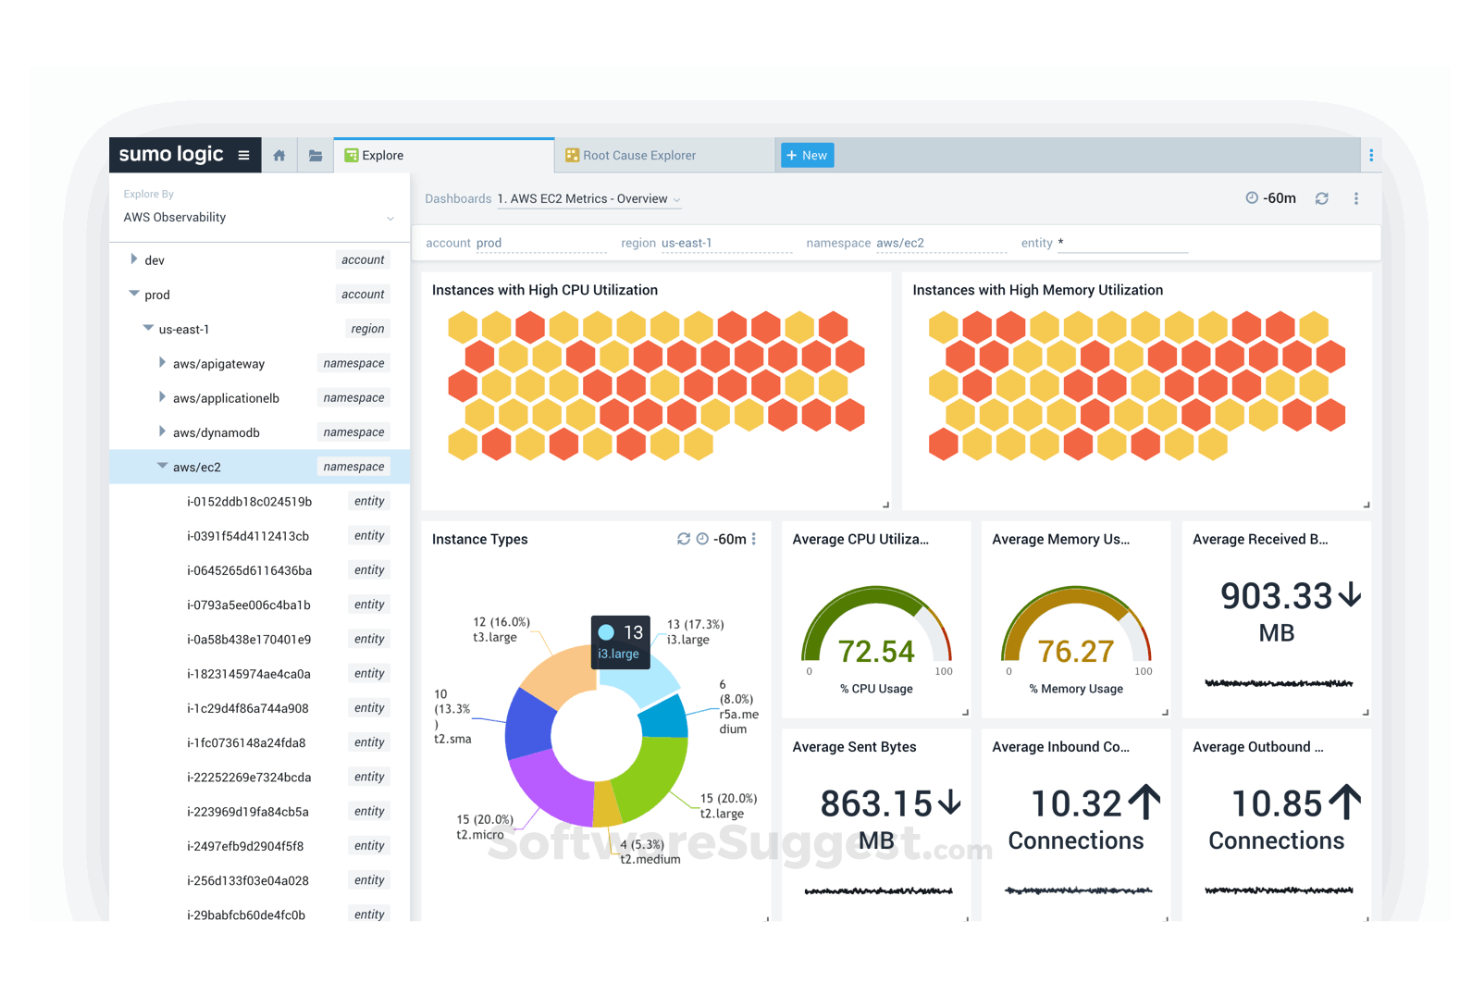
Sumo Logic offers a cloud-native platform for log management and analytics, designed for teams that need real-time visibility into complex IT environments. It’s a strong fit for organizations with distributed systems or hybrid cloud infrastructure that want to centralize monitoring and troubleshooting.
If your team needs to quickly detect, investigate, and resolve incidents across multiple platforms, Sumo Logic provides the tools to make that possible.
Who Is Sumo Logic Best For?
Sumo Logic is a strong choice for IT operations teams and DevOps professionals in mid-sized to large organizations managing cloud-native or hybrid environments.
Why Sumo Logic Is a Good SolarWinds Competitor
Unlike many traditional monitoring tools, Sumo Logic is purpose-built for cloud-native log management, making it a strong alternative for teams with modern, distributed environments. I picked Sumo Logic because it offers real-time log ingestion and analytics, which help support teams quickly identify and resolve incidents across cloud platforms.
Its scalable architecture means you can centralize logs from multiple sources without worrying about infrastructure limits. For organizations prioritizing rapid troubleshooting and visibility in dynamic cloud or hybrid setups, Sumo Logic delivers capabilities that SolarWinds and other legacy solutions may not match.
Sumo Logic Key Features
Some other features in Sumo Logic that help support and IT teams manage logs and incidents include:
- Role-based access controls: Assign granular permissions to users and teams for secure data access.
- Pre-built compliance dashboards: Use templates for monitoring and reporting on regulatory requirements like PCI DSS and HIPAA.
- Alert scheduling and suppression: Set custom alert windows and suppress notifications during maintenance or known events.
- Data retention management: Configure how long logs are stored and automate archival or deletion based on policy.
Sumo Logic Integrations
Integrations include AWS CloudTrail, Amazon S3, Apache, Kubernetes, Linux, NGINX, PCI Compliance, Azure Web Apps, Google Cloud Functions, and Office 365, among others. An API is also available, which supports connections with third-party integration tools for custom workflows and data ingestion.
Pros and Cons
Pros:
- Pre-built compliance dashboards support audits
- Scalable data ingestion for large environments
- Real-time log analytics for fast troubleshooting
Cons:
- Limited infrastructure monitoring capabilities
- Query language can be difficult for beginners
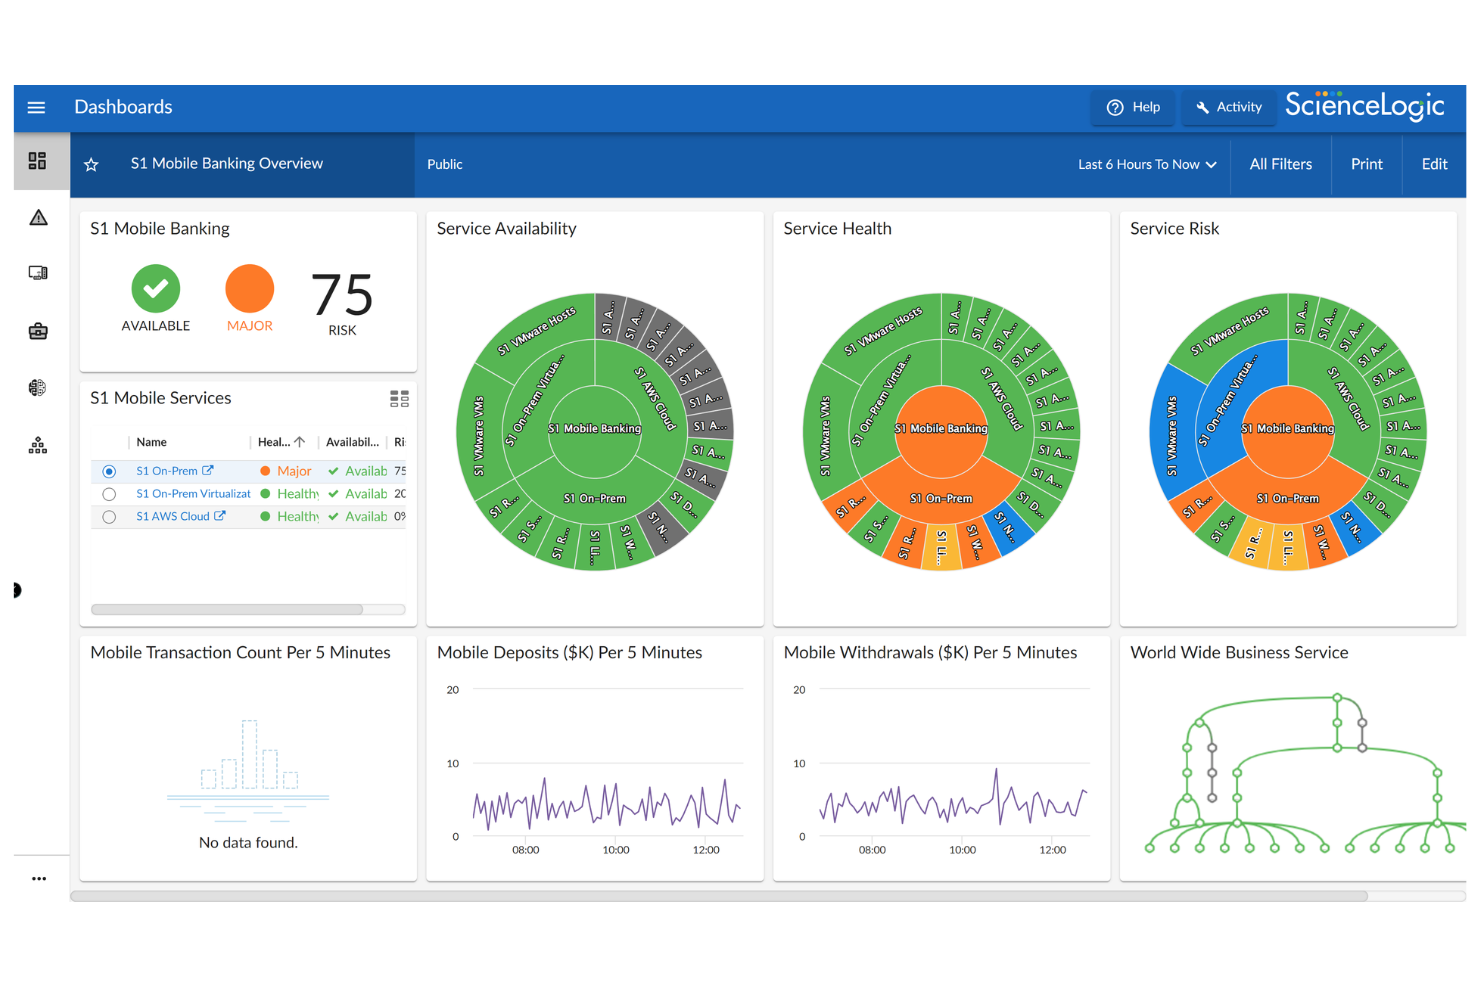
ScienceLogic offers an IT monitoring and AIOps platform designed for organizations managing complex, distributed infrastructure. It’s a strong fit for IT teams in enterprises or service providers who need unified visibility across on-premises, cloud, and hybrid environments. If you’re looking for a solution that goes beyond traditional tools by automating incident detection and providing deep infrastructure insights, ScienceLogic is worth considering.
Who Is ScienceLogic Best For?
ScienceLogic is a strong choice for enterprise IT operations teams and managed service providers overseeing multi-cloud and hybrid infrastructure.
Why ScienceLogic Is a Good SolarWinds Competitor
What sets ScienceLogic apart is its focus on tracking service health across multiple cloud providers and hybrid environments. I picked ScienceLogic because it automatically discovers and maps dependencies between services, applications, and infrastructure, giving IT teams a unified view of service health.
Its event correlation and automated incident response features help reduce noise and speed up troubleshooting in complex, distributed setups. For organizations that need to monitor and maintain uptime across AWS, Azure, Google Cloud, and on-premises systems, ScienceLogic offers visibility and automation that SolarWinds and other legacy tools may not provide.
ScienceLogic Key Features
Some other features in ScienceLogic that help IT and service teams manage complex environments include:
- Runbook automation: Automate routine incident response tasks and remediation workflows directly from the platform.
- Custom dashboard builder: Create tailored dashboards to visualize metrics, alerts, and service health for different teams or stakeholders.
- Ticketing system integrations: Connect with popular ITSM and help desk platforms like ServiceNow and BMC Remedy for streamlined incident management.
- Role-based access controls: Assign granular permissions to users and teams to ensure secure access to monitoring data and actions.
ScienceLogic Integrations
Integrations include ServiceNow, Microsoft, Cisco, Amazon Web Services, VMware, Oracle, Kubernetes, Docker, Net-SNMP, and NVIDIA.
Pros and Cons
Pros:
- Supports multi-tenant environments for MSPs
- Flexible runbook automation for incident response
- Deep integration with ServiceNow for ticketing
Cons:
- Fewer built-in network device monitoring tools
- Initial setup can be complex for enterprises
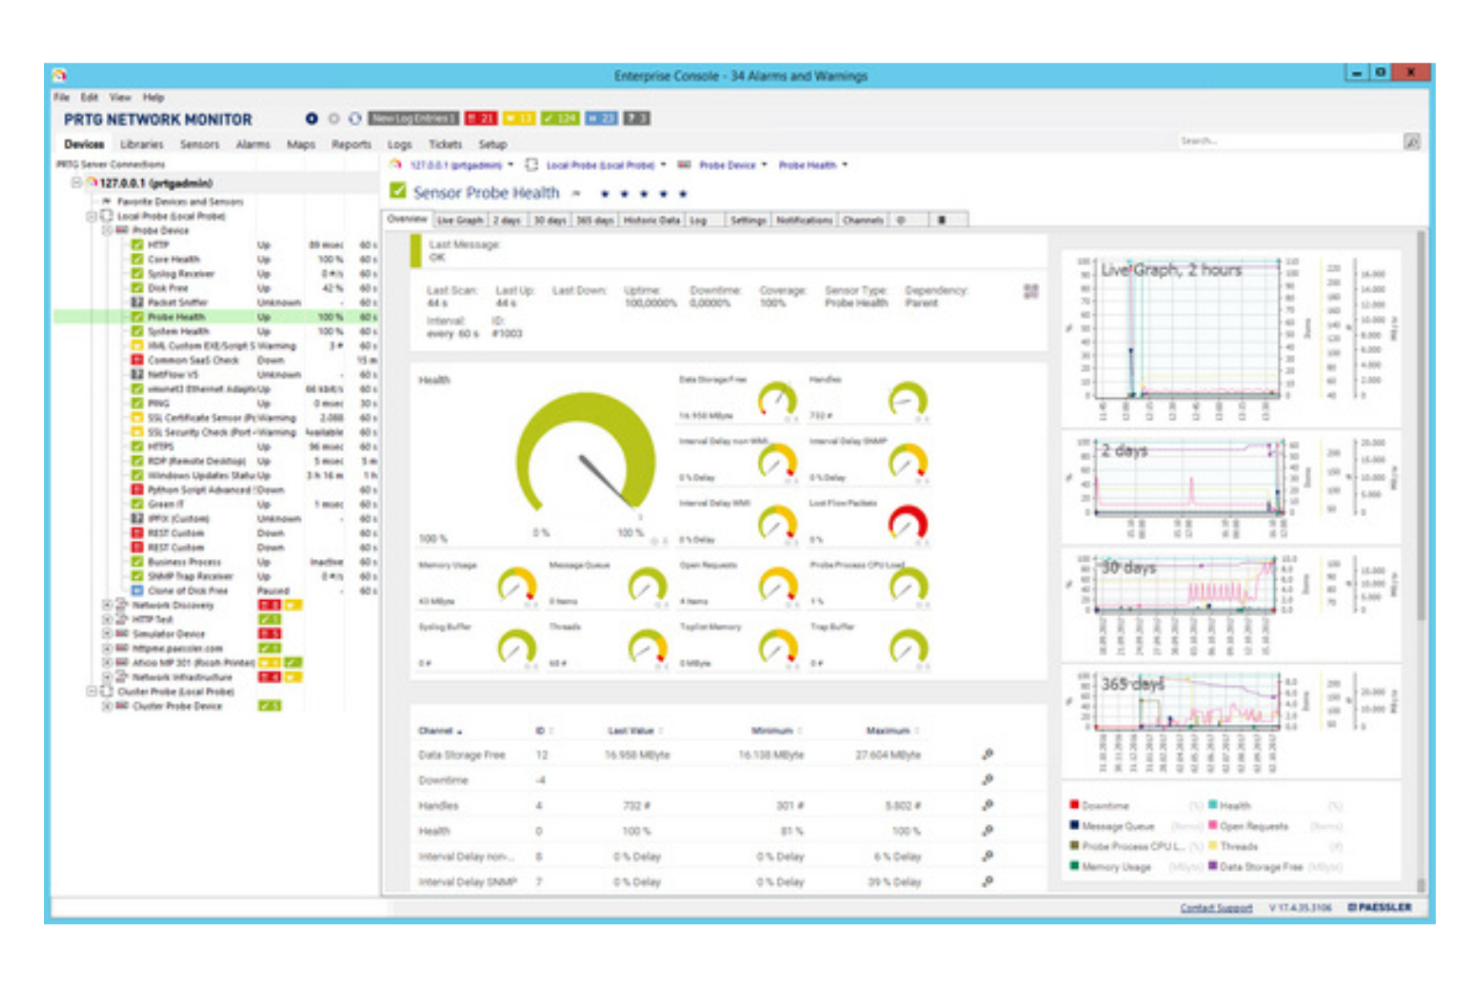
PRTG is a network monitoring platform designed for IT teams that need real-time visibility into their infrastructure. It’s a strong fit for organizations that want to proactively detect issues across devices, servers, and applications from a single dashboard. If you’re looking for a SolarWinds alternative that emphasizes unified monitoring and customizable alerts, PRTG is worth considering.
Who Is PRTG Best For?
PRTG is a strong choice for IT administrators in mid-sized to large enterprises that need centralized infrastructure monitoring across complex networks.
Why PRTG Is a Good SolarWinds Competitor
What makes PRTG a strong SolarWinds competitor is its sensor-based approach to infrastructure monitoring. I picked it because you can deploy individual sensors for specific devices, applications, or services, giving you granular control over what you monitor and alert on. This flexibility lets you tailor monitoring to your environment’s unique needs, whether you’re tracking bandwidth, server health, or application uptime. For IT teams that want to avoid one-size-fits-all monitoring and need detailed visibility, PRTG’s sensor model stands out.
PRTG Key Features
Some other features in PRTG that help IT teams manage and monitor their environments include:
- Auto-discovery: Automatically detects devices and services on your network to simplify initial setup and ongoing management.
- Custom dashboards: Build personalized dashboards to visualize key metrics and monitor critical systems at a glance.
- Multi-location monitoring: Monitor distributed networks and remote sites from a single, unified interface.
- Role-based access control: Assign user permissions to control who can view or modify specific monitoring data and settings.
PRTG Integrations
Integrations include Microsoft Azure, Amazon Web Services, Google Cloud Platform, Cisco, Fortinet, Bosch Rexroth, Brocade, GarrettCom, Ruckus, and ADTRAN.
Pros and Cons
Pros:
- Custom dashboards support tailored monitoring views
- Auto-discovery simplifies network setup
- Sensor-based monitoring enables granular control
Cons:
- Alert configuration can be time-consuming
- Reporting features are less advanced
New Product Updates from PRTG
PRTG Introduces New Monitoring Sensors In Beta
This week, PRTG introduces three BETA sensors that broaden your monitoring scope for Proxmox VE clusters and SIMATIC S7-300/400 PLCs, giving you deeper operational insights. For more information, visit PRTG’s official site.
 .
.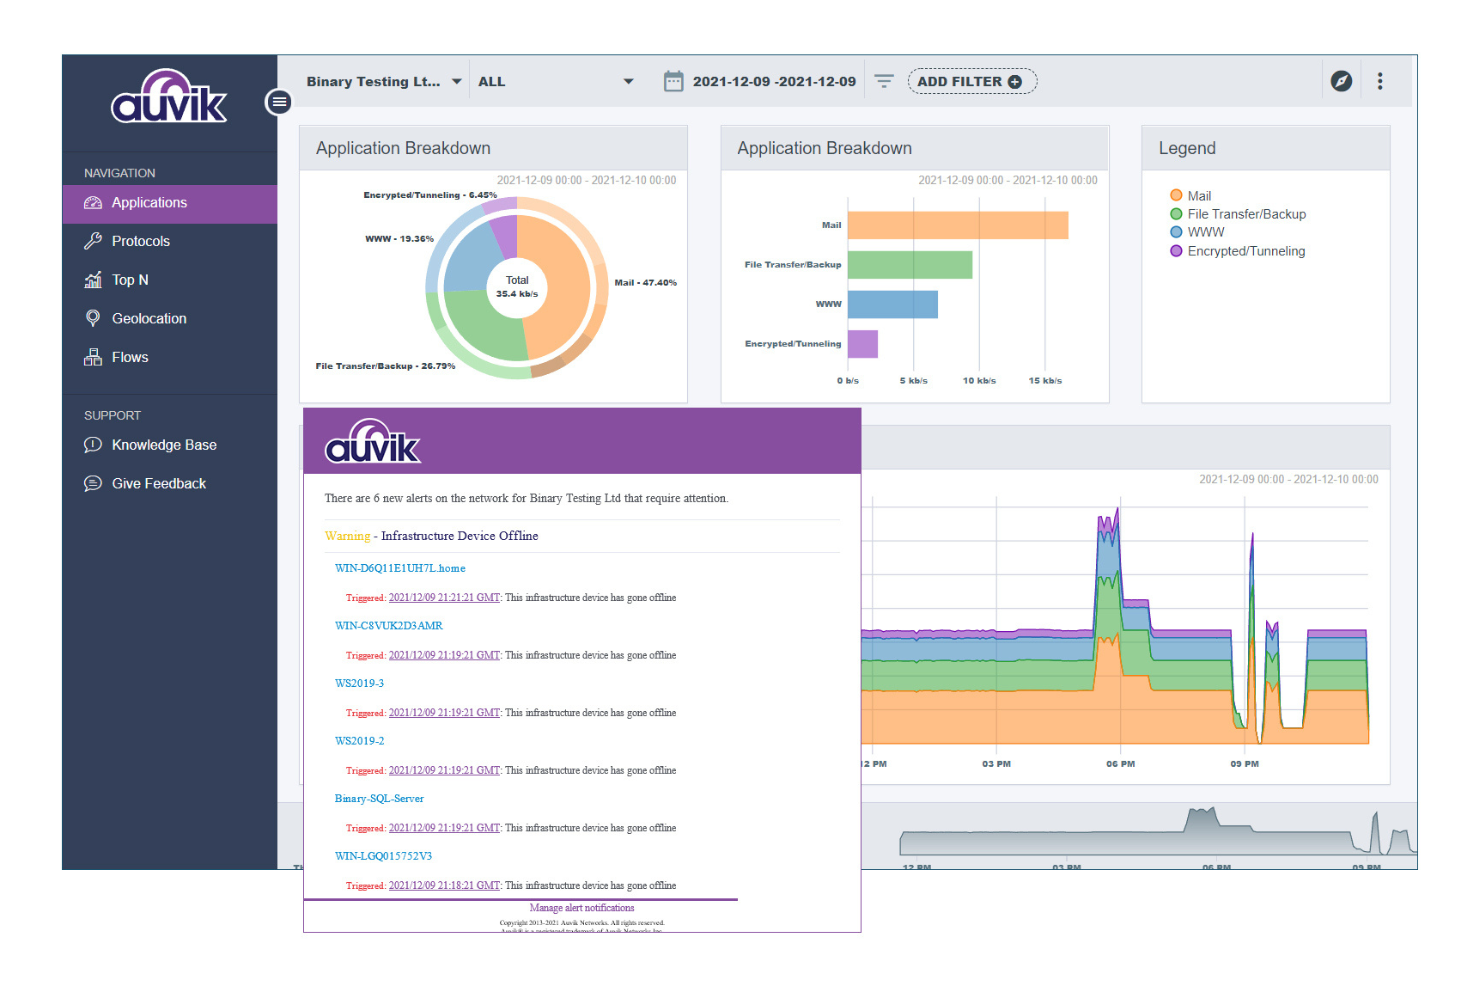
Auvik is a cloud-based network management platform designed for IT teams that need deep visibility into their network infrastructure. It’s especially useful for managed service providers and organizations with distributed networks who want to simplify troubleshooting and reduce manual network tasks. If you’re evaluating SolarWinds competitors, Auvik stands out for its focus on automated network discovery and real-time monitoring.
Who Is Auvik Best For?
Auvik is a strong choice for IT teams and managed service providers overseeing complex or distributed network environments.
Why Auvik Is a Good SolarWinds Competitor
When I compare Auvik to SolarWinds, its automated network mapping stands out as a major differentiator. Auvik continuously scans and updates network topology, so IT teams always have an up-to-date visual map of every connected device. This automation helps teams quickly pinpoint issues and understand network relationships without manual intervention. For organizations that need reliable, real-time network visibility, Auvik’s mapping and monitoring features make it a compelling alternative.
Auvik Key Features
Some other features in Auvik that help IT and support teams manage networks more efficiently include:
- Automated configuration backup: Auvik automatically backs up device configurations, making it easy to restore settings after outages or changes.
- Network traffic analysis: The platform provides detailed insights into bandwidth usage and traffic patterns across the network.
- Role-based access control: Assign granular permissions to users based on their responsibilities and access needs.
- Alerting and notification system: Set up customizable alerts for network events and receive notifications through email or integrated messaging platforms.
Auvik Integrations
Integrations include ConnectWise Manage, Autotask PSA, ServiceNow, Freshdesk, Slack, Microsoft Teams, PagerDuty, Opsgenie, IT Glue, and Dell.
Pros and Cons
Pros:
- Configuration backup protects network settings
- Real-time alerts support faster issue response
- Automated network mapping improves visibility
Cons:
- Limited historical data retention options
- Advanced reporting features are limited
New Product Updates from Auvik
Auvik Adds Aurora Troubleshooting Assistance
Auvik introduces Aurora Troubleshooting Assistance with AI-powered troubleshooting guidance, possible root causes, conversation downloads, and feedback tools. The open beta helps IT teams diagnose network issues faster with contextual recommendations tailored to specific devices and alerts. For more information, visit Auvik's official site.
 .
.Altri concorrenti di SolarWinds
Ecco alcuni altri concorrenti di SolarWinds che non sono entrati nella mia shortlist, ma che vale comunque la pena prendere in considerazione:
- Grafana Labs
For customizable dashboard visualizations
- Microsoft
For integration with Microsoft 365 apps
- Cisco (Splunk)
With advanced security event correlation


Criteri di selezione dei concorrenti di SolarWinds
Quando ho selezionato i migliori concorrenti di SolarWinds da includere in questa lista, ho preso in considerazione le esigenze comuni degli acquirenti e i punti deboli legati al monitoraggio dell’infrastruttura IT e alla visibilità dell’esperienza digitale, come il miglioramento delle prestazioni di rete, il supporto al monitoraggio remoto e la comprensione di come le prestazioni dei sistemi impattino sugli utenti finali. Ho inoltre utilizzato il seguente quadro per rendere la mia valutazione strutturata ed equa:
Funzionalità principali (25% del punteggio totale) Per essere incluso in questa lista, ogni soluzione doveva supportare questi casi d’uso comuni:
- Monitoraggio delle prestazioni e della disponibilità della rete
- Monitoraggio dell’infrastruttura IT su cloud, ambienti ibridi e locali
- Fornire avvisi in tempo reale e approfondimenti sulle prestazioni
- Supportare il monitoraggio dell’esperienza digitale di applicazioni e servizi
- Offrire dashboard per visualizzare lo stato dei sistemi e l’impatto sugli utenti
Funzionalità distintive aggiuntive (25% del punteggio totale) Per restringere ulteriormente la selezione, ho anche valutato caratteristiche uniche come:
- Funzionalità di monitoraggio dell'esperienza digitale (DEM)
- Rilevamento automatico delle anomalie basato su intelligenza artificiale e analisi delle cause principali
- Scoperta automatizzata dei componenti dell'infrastruttura
- Dashboard e strumenti di reportistica personalizzabili
- Supporto per componenti aggiuntivi e funzionalità avanzate
Usabilità (10% del punteggio totale) Per valutare l'usabilità di ciascun sistema, ho preso in considerazione i seguenti aspetti:
- Navigazione intuitiva e design dell'interfaccia
- Layout delle dashboard personalizzabili
- Numero minimo di clic per completare le attività comuni
- Etichettatura chiara e organizzazione delle funzionalità
- Prestazioni reattive su tutti i dispositivi
Onboarding (10% del punteggio totale) Per valutare l'esperienza di onboarding per ciascuna piattaforma, ho preso in considerazione i seguenti fattori:
- Disponibilità di tour guidati passo per passo sul prodotto
- Accesso a video formativi e documentazione
- Modelli predefiniti per i flussi di lavoro più comuni
- Chatbot integrati nell'applicazione per supporto onboarding
- Webinar programmati o sessioni di onboarding
Assistenza clienti (10% del punteggio totale) Per valutare i servizi di assistenza clienti di ciascun fornitore software, ho preso in considerazione questi aspetti:
- Opzioni di assistenza telefonica o chat dal vivo attive 24/7
- Tempi di risposta rapidi alle richieste di supporto
- Accesso a una community o base di conoscenza
- Disponibilità di account manager dedicati
- Funzionalità di supporto multilingue
Rapporto qualità-prezzo (10% del punteggio totale) Per valutare il rapporto qualità-prezzo di ogni piattaforma, ho preso in esame i seguenti aspetti:
- Piani tariffari trasparenti e flessibili
- Disponibilità di versione di prova gratuita o demo
- Nessun costo nascosto o addebiti imprevedibili
- Sconti per abbonamenti annuali o volumi elevati
- Funzionalità incluse in ogni fascia di prezzo
Recensioni dei clienti (10% del punteggio totale) Per comprendere il livello generale di soddisfazione dei clienti, ho preso in considerazione i seguenti elementi leggendo le recensioni:
- Feedback positivo su affidabilità e uptime
- Lodi per la reattività del supporto clienti
- Commenti sulla facilità di integrazione con altri strumenti
- Segnalazioni di aggiornamenti e miglioramenti frequenti
- Critiche su eventuali problemi ricorrenti o limitazioni
Perché Cercare un Competitor di SolarWinds?
Sebbene SolarWinds sia una soluzione valida per il monitoraggio dell'infrastruttura IT, esistono diversi motivi per cui i team cercano soluzioni alternative. Potresti essere alla ricerca di un competitor di SolarWinds perché…
- Hai bisogno di una visibilità più approfondita in ambienti multi-cloud e ibridi
- Desideri maggiore comprensione dell'esperienza digitale e delle prestazioni lato utente
- Stai cercando prezzi più flessibili o trasparenti
- Hai bisogno di un'interfaccia più moderna o personalizzabile
- Vuoi migliori funzionalità di monitoraggio remoto e automazione
- Richiedi funzioni avanzate come analisi basata su AI o rilevamento anomalie
Se alcune di queste esigenze corrispondono alle tue, sei nel posto giusto. Gli strumenti presenti in questo elenco rappresentano valide alternative per i team che desiderano ottimizzare le prestazioni della rete, migliorare l'esperienza utente e ottenere maggiore visibilità sulla propria infrastruttura IT.
Funzionalità Principali di SolarWinds
Ecco alcune delle principali funzionalità di SolarWinds, per aiutarti a confrontare e valutare le alternative disponibili:
- Monitoraggio delle prestazioni di rete (NPM): Monitora la salute della rete, l'utilizzo della larghezza di banda e le prestazioni dei dispositivi tra router, firewall e altri componenti dell'infrastruttura
- Monitoraggio remoto: Fornisce visibilità su sistemi e ambienti distribuiti, supportando sia implementazioni on-premise che SaaS
- Monitoraggio dell'esperienza digitale: Misura come gli utenti interagiscono con applicazioni e servizi per identificare colli di bottiglia nelle prestazioni
- Rilevamento delle risorse: Rileva e inventaria automaticamente i componenti dell'infrastruttura nel tuo ambiente
- Avvisi e notifiche: Invia avvisi in tempo reale in base a soglie di prestazione o anomalie
- Dashboard personalizzate: Visualizza la salute del sistema, metriche di prestazione e impatto sugli utenti tramite un'interfaccia intuitiva
- Reportistica e analisi: Fornisce approfondimenti su tendenze, uptime e opportunità di ottimizzazione delle prestazioni
- Scalabilità e componenti aggiuntivi: Supporta funzionalità avanzate ed espansione tramite add-on modulari
- Integrazione con strumenti di infrastruttura: Si collega a piattaforme cloud e altre soluzioni di monitoraggio per una visibilità unificata
- Accesso mobile: Permette ai team di monitorare e rispondere ai problemi ovunque si trovino