10 Beste Analyse-Tools für das Kundenerlebnis 2026

10 Die besten Tools für Customer Experience Analytics: Kurzliste


Customer Experience Analytics Tools helfen Ihnen zu verstehen, wie Menschen tatsächlich durch Ihr Produkt, Ihre Dienstleistung oder Ihren Support-Prozess navigieren. Sie zeigen die Momente auf, in denen Kunden stecken bleiben, abspringen oder konvertieren, sodass Sie gezielt und mit Sicherheit handeln können.
Mit mehr als 10 Jahren Erfahrung in der CX-Forschung habe ich die führenden Customer Experience Analytics Tools bewertet und kuratiert, die sich am besten eignen, um Rohdaten aus Interaktionen in klare Erkenntnisse zu verwandeln. Ganz gleich, ob Sie digitales Verhalten verfolgen, Kundenreisen abbilden oder den Impact Ihrer CX-Initiativen nachweisen möchten – diese Plattformen unterstützen Sie dabei, klügere und schnellere Entscheidungen zu treffen.
Warum Sie unseren Bewertungen vertrauen können
Wir testen und bewerten Customer Experience Analytics Tools seit 2021. Als CX-Profis wissen wir, wie wichtig und zugleich schwierig es ist, bei der Softwareauswahl die richtige Entscheidung zu treffen.
Wir investieren viel in gründliche Recherchen, um unserem Publikum die bestmögliche Entscheidungsgrundlage für den Softwarekauf zu bieten. Wir haben über 2.000 Tools für verschiedene Customer-Experience-Anwendungsfälle getestet und mehr als 1.000 umfassende Software-Bewertungen geschrieben. Erfahren Sie, wie wir Transparenz gewährleisten & unsere Software Bewertungsmethodik.
Zusammenfassung: Die 20 besten Customer Experience Analytics Tools
Diese Vergleichstabelle fasst die wichtigsten Details zu jeder meiner Top-Auswahlen an Customer Experience Analytics Software zusammen. Sie können Preisinformationen und die Verfügbarkeit von kostenlosen Testversionen oder Demos nebeneinander sehen, um das passende Tool für Ihr Budget und Ihre Geschäftsanforderungen zu finden.
| Tool | Best For | Trial Info | Price | ||
|---|---|---|---|---|---|
| 1 | Am besten geeignet für die Vereinheitlichung von Kundenfeedback | Kostenlose Demo verfügbar | Preise auf Anfrage | Website | |
| 2 | Am besten geeignet für KI-gesteuerte Erkenntnisse | Kostenlose Demo verfügbar | Preise auf Anfrage | Website | |
| 3 | Am besten für Echtzeit-Datenaktivierung | Kostenloser Plan + kostenlose Demo verfügbar | Ab $20/Monat | Website | |
| 4 | Am besten geeignet für B2B-Support-Umgebungen | Kostenlose Demo verfügbar | Ab $45/Monat (jährliche Abrechnung) | Website | |
| 5 | Am besten geeignet, um die Gesundheit von Kundenportfolios zu verstehen | Kostenlose Demo verfügbar | Preise auf Anfrage | Website | |
| 6 | Bestes Tool mit intelligentem Zusammenfassungsgenerator | Kostenlose Demo verfügbar | Preise auf Anfrage | Website | |
| 7 | Am besten geeignet, um Cross-Selling-Chancen zu erkennen | Kostenlose Demo verfügbar | Preise auf Anfrage | Website | |
| 8 | Am besten geeignet zur Analyse von Google Ads-Kampagnen | Kostenlose Version verfügbar | Preise auf Anfrage | Website | |
| 9 | Am besten geeignet, um das Ausgabeverhalten von Kunden zu erkennen | Kostenlose Demo + 14-tägige Testversion verfügbar | Ab $75/Nutzer/Monat (jährliche Abrechnung) | Website | |
| 10 | Am besten geeignet, um die Ursachen von Reibungspunkten in der Customer Journey aufzudecken | Kostenloser Tarif + kostenlose Demo verfügbar | Preise auf Anfrage | Website |

-

SupportYourApp
Visit WebsiteThis is an aggregated rating for this tool including ratings from Crozdesk users and ratings from other sites.4.7 -
Tidio
Visit WebsiteThis is an aggregated rating for this tool including ratings from Crozdesk users and ratings from other sites.4.7 -
Freshdesk
Visit WebsiteThis is an aggregated rating for this tool including ratings from Crozdesk users and ratings from other sites.4.4


Überblick über die 20 besten Customer Experience Analytics Tools
Um Ihnen die Auswahl zu erleichtern, finden Sie hier eine Bewertung der besten Customer Experience Analytics Tools – inklusive Zusammenfassung der wichtigsten Funktionen, Screenshots sowie Infos zu Testversionen und Preisen.
Am besten geeignet für die Vereinheitlichung von Kundenfeedback
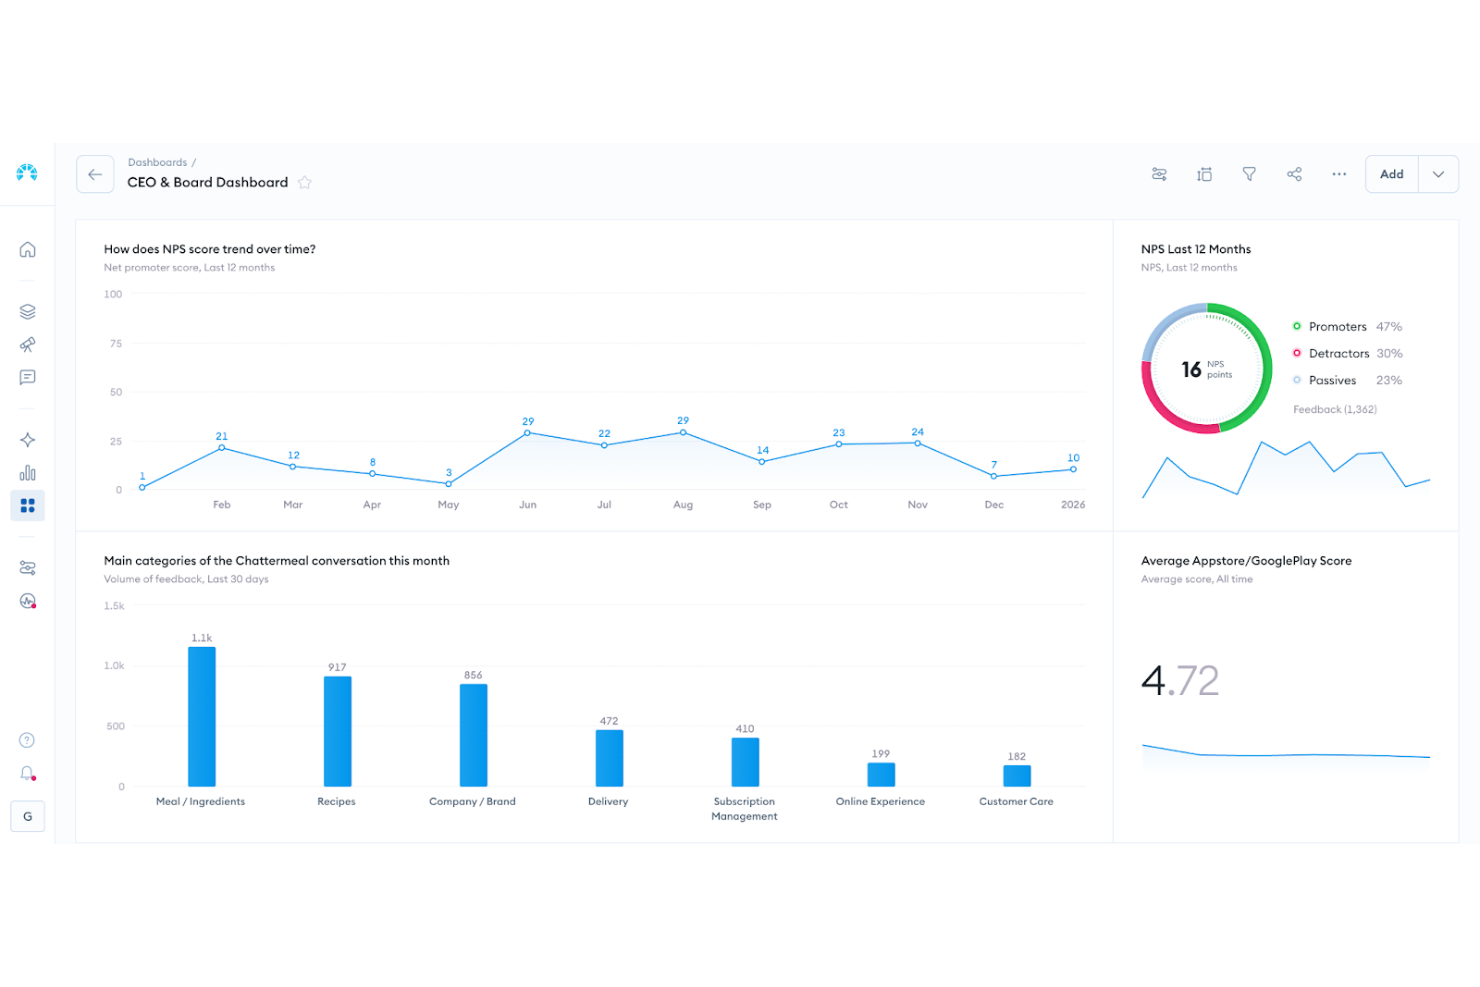
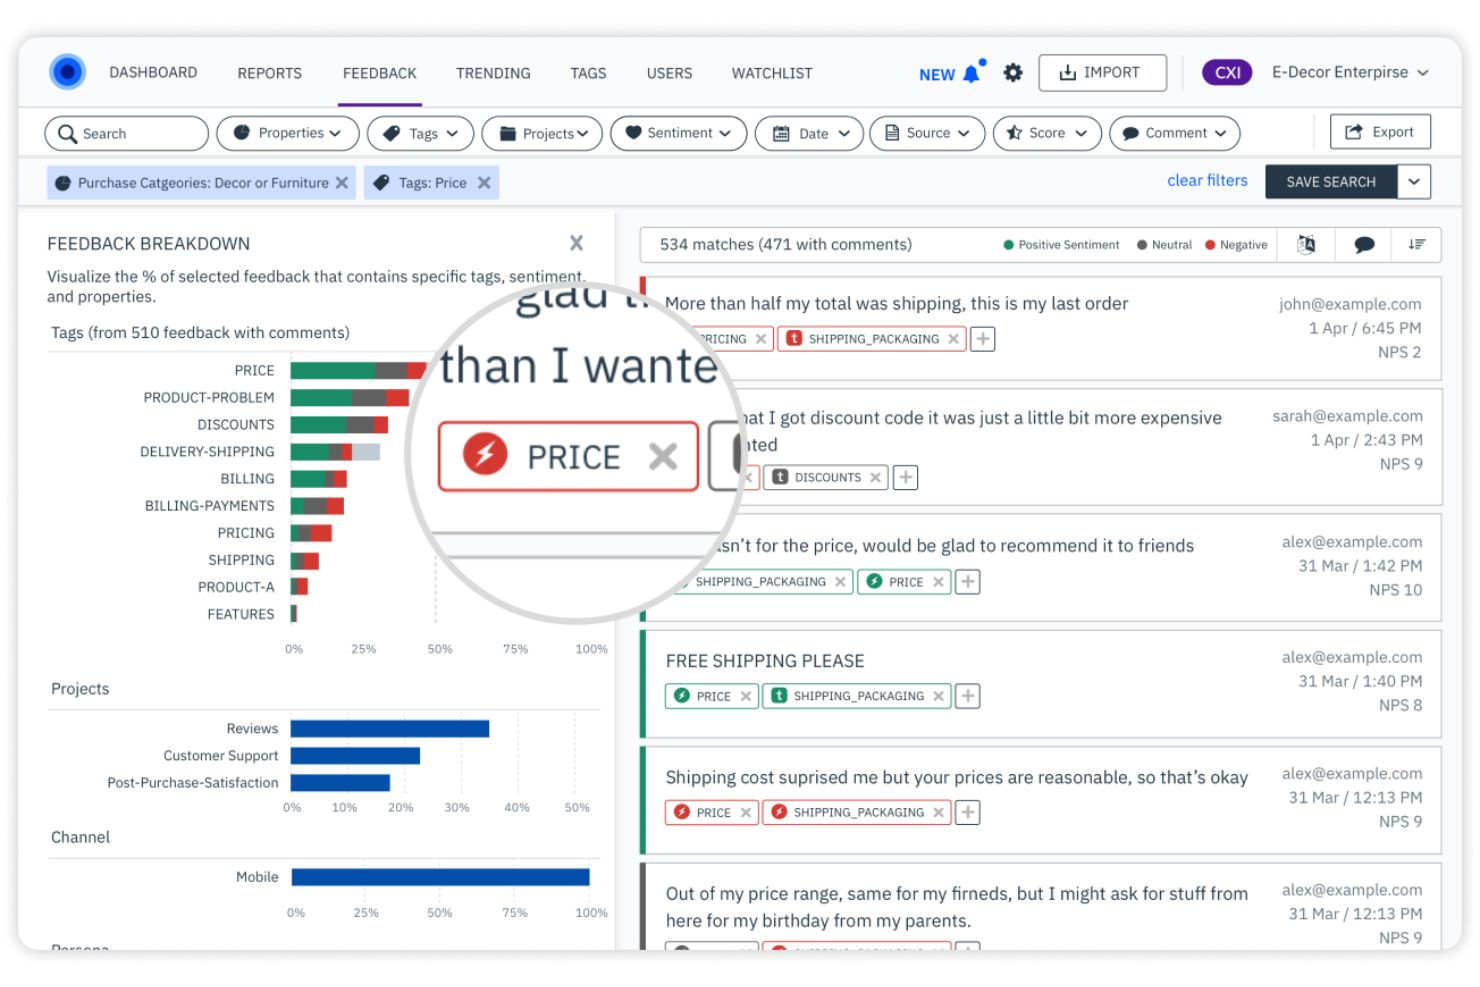
Chattermill ist eine Analyseplattform für Kundenfeedback, die Unternehmen dabei unterstützt, die Kundenstimmung besser zu verstehen und gezielt darauf zu reagieren. Besonders geeignet ist sie für kundenorientierte Teams in Branchen wie Einzelhandel, Finanzdienstleistungen und Reisen, bei denen das Erlebnis und die Kundenbindung eng mit der Qualität des Feedbacks verknüpft sind. Durch die Zentralisierung und Analyse unstrukturierter Rückmeldungen aus Umfragen, Bewertungen, Support-Tickets und anderen Kanälen ermöglicht Chattermill es Teams, Trends zu erkennen, Verbesserungen zu priorisieren und fundiertere Entscheidungen zur Customer Journey zu treffen.
Warum ich Chattermill ausgewählt habe
Ich habe Chattermill aufgrund seiner Fähigkeiten ausgewählt, Kundenfeedback aus unterschiedlichen Quellen zusammenzuführen und zu analysieren. Die automatische Verschlagwortung und KI-generierten Zusammenfassungen liefern Ihrem Team klare, umsetzbare Erkenntnisse und reduzieren den Zeitaufwand für die manuelle Datenanalyse. Außerdem können Sie mit der Trendverfolgungsfunktion von Chattermill Veränderungen in der Kundenstimmung beobachten, um potenzielle Probleme proaktiv anzugehen. Dieser Fokus auf verwertbare Einblicke macht Chattermill zu einem wertvollen Werkzeug für Teams, die ihre Strategien für das Kundenerlebnis optimieren möchten.
Wichtige Funktionen von Chattermill
Neben den Kernfunktionen habe ich noch einige weitere Eigenschaften gefunden, die für Sie interessant sein könnten:
- Feedback-Konsolidierung: Führt Rückmeldungen aus Umfragen, Online-Bewertungen und Support-Gesprächen auf einer einzigen Plattform zusammen.
- KI-gesteuerte Erkenntnisse: Nutzt künstliche Intelligenz, um Zusammenfassungen und verwertbare Erkenntnisse aus unstrukturierten Daten zu generieren.
- Anpassbare Dashboards: Bietet individuell anpassbare Dashboards, mit denen Ihr Team wichtige Kennzahlen visualisieren und verfolgen kann.
- Stimmungsanalyse: Bietet Stimmungsanalysen, um das emotionale Klima im Kundenfeedback besser nachvollziehen zu können.
Chattermill-Integrationen
Zu den Integrationen gehören Zendesk, Trustpilot, Qualtrics, Salesforce, Slack, Intercom, HubSpot, Medallia, SurveyMonkey und Typeform.
Pros and Cons
Pros:
- Echtzeit-Stimmungsverfolgung
- KI-gestützte Themenkennung
- Branchenspezifische Stimmungsmodelle
Cons:
- Preise werden nicht öffentlich angegeben
- Eventuell ist eine Enterprise-Einführung erforderlich
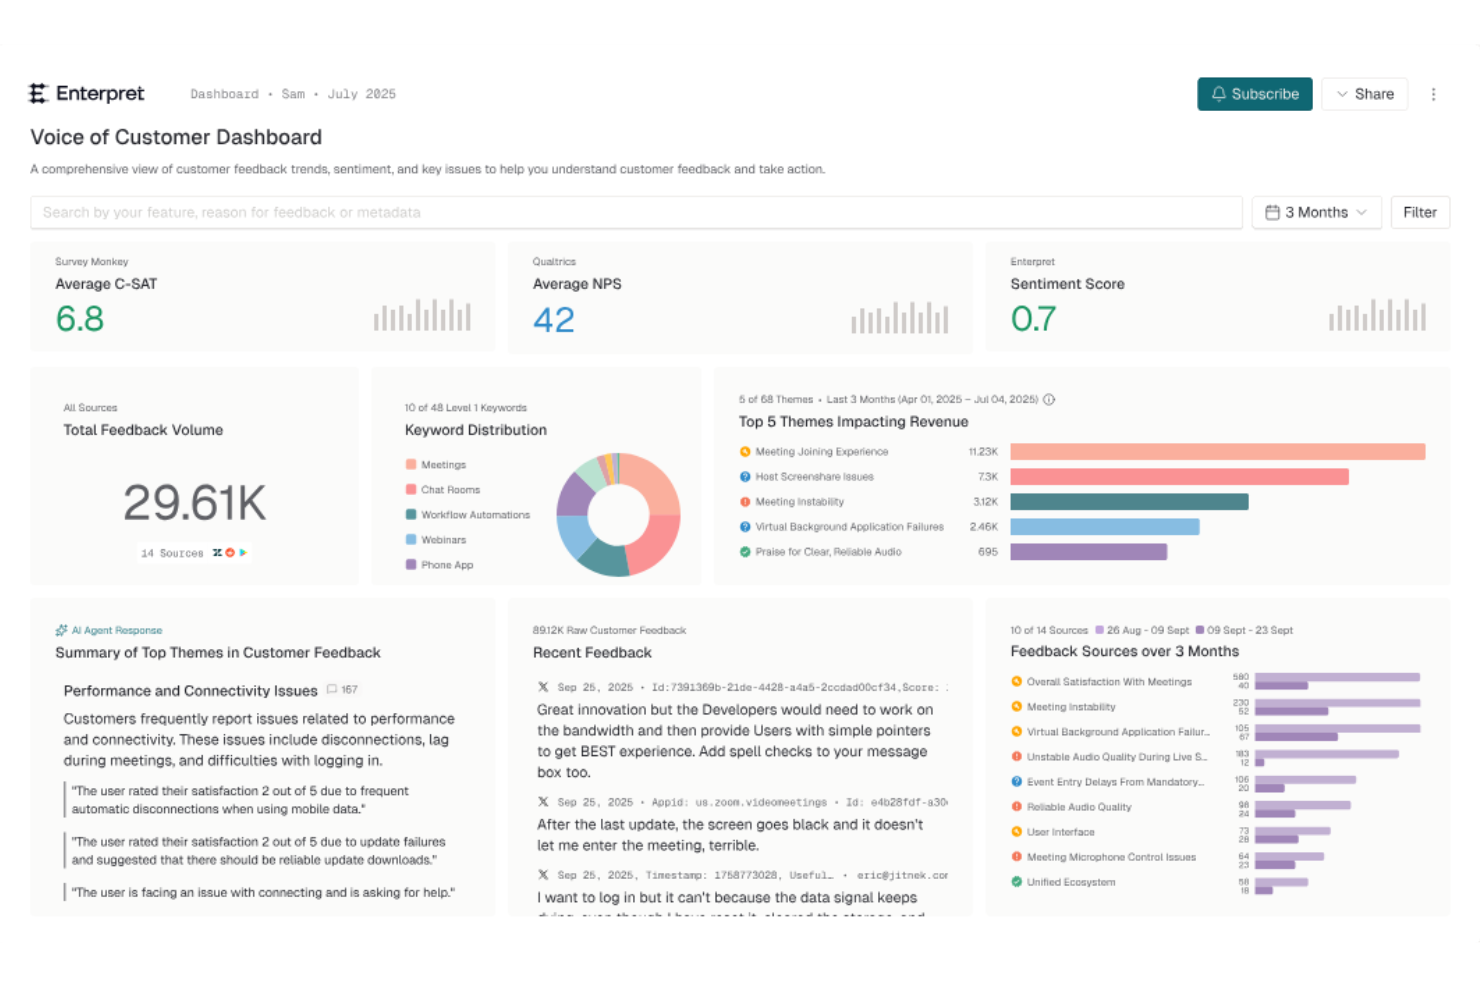
Enterpret ist ein Kundenanalyse-Tool, das KI-gesteuerte Erkenntnisse nutzt, um Feedback aus mehreren Quellen an einem Ort zu analysieren. Durch das Sammeln von Daten aus Quellen wie Support-Tickets, Umfragen und Bewertungen hilft Enterpret Teams, wiederkehrende Probleme, Kundenbedürfnisse und Trends zu identifizieren. So können Produkt-, Support- und CX-Teams Feedback leichter umsetzen und das Kundenerlebnis mit klarerer Richtung verbessern.
Warum ich Enterpret ausgewählt habe
Ich habe Enterpret wegen seiner einzigartigen Fähigkeit gewählt, KI-gestützte Erkenntnisse direkt in den Kundenanalyseprozess zu integrieren. Mit der Funktion AI Insights der Plattform können Sie Kundenfeedback abfragen und kontextbezogene Erkenntnisse gewinnen, was bahnbrechend für das Verständnis zugrunde liegender Trends sein kann. Außerdem sorgt die Funktion Echtzeit-Benachrichtigungen von Enterpret dafür, dass Ihr Team sofort über aufkommende Probleme informiert wird, sodass proaktive Reaktionen möglich sind. Diese Funktionen helfen Teams dabei, Kundenfeedback schneller und konsistenter zu analysieren und es fällt leichter, auf das Feedback der Kunden zu reagieren.
Enterpret Hauptfunktionen
Neben KI-gesteuerten Erkenntnissen bietet Enterpret:
- Feedback-Zentralisierung: Organisiert Kundenfeedback in anpassbaren Themenbereichen, sodass Ihr Team Erkenntnisse nach ihrer Wirkung priorisieren kann.
- Automatisierte Aktionen: Nutzt KI-Agenten, um Arbeitsabläufe zu optimieren und Kundenprobleme zeitnah zu lösen, was die operative Effizienz erhöht.
- Kunden-Wissensgraph: Verknüpft Feedback mit seiner Auswirkung auf Kunden und Produkte und ermöglicht ein tieferes Verständnis der Kundenbedürfnisse.
- Workflow-Integration: Verbindet sich nahtlos mit Tools wie Jira, sodass auf Erkenntnissen basierende Maßnahmen effizient umgesetzt werden.
Enterpret Integrationen
Integrationen umfassen Jira, Slack, Zendesk, Intercom, Salesforce, HubSpot, Amplitude, Segment, Freshdesk und Asana.
Pros and Cons
Pros:
- Unterstützt automatisierte Berichte und proaktive Benachrichtigungen via Slack oder E-Mail
- Bietet anpassbare Dashboards zur Visualisierung von Feedback-Kennzahlen
- Aggregiert Kundenfeedback aus verschiedenen Quellen für umfassende Einblicke
Cons:
- Weniger nützlich für Teams mit geringem Feedback-Volumen
- KI-Erkenntnisse erfordern möglicherweise eine menschliche Überprüfung für den Kontext
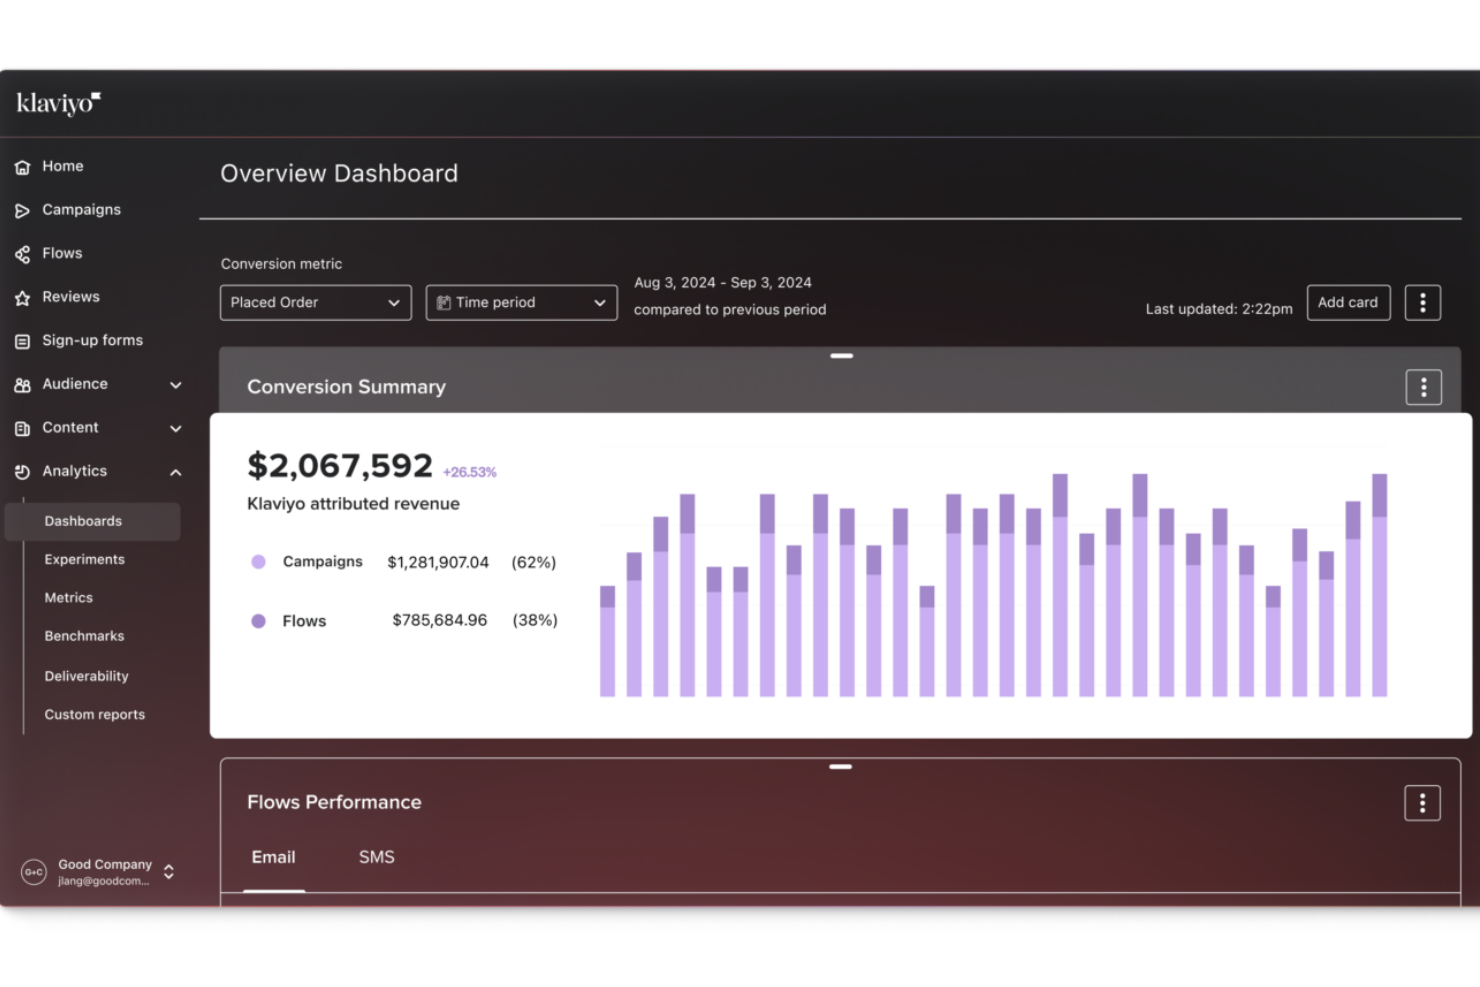
Klaviyo bietet Ihnen die Möglichkeit, die Kundendaten, die Sie bereits sammeln, in transparente Einblicke in das Kaufverhalten, die Entwicklung innerhalb des Kundenlebenszyklus und die Performance Ihrer Kampagnen umzuwandeln. So können Sie bessere Entscheidungen treffen, ohne mit verschiedenen Analyse-Tools jonglieren zu müssen. Die Plattform richtet sich an B2C-Marketingteams und Online-Shop-Betreiber, die verstehen wollen, wie sich ihre Kunden auf Kanälen wie E-Mail, SMS und Werbung verhalten, sodass Sie Ihre Ansprache auf der Grundlage echter Verhaltensweisen und Reisetendenzen optimieren können.
Warum ich Klaviyo gewählt habe
Ich habe mich für Klaviyo entschieden wegen seiner Fähigkeiten zur Echtzeit-Datenzusammenführung und -aktivierung, die für Unternehmen, die Kundenanalysen nutzen möchten, entscheidend sind. Die fortschrittlichen Segmentierungswerkzeuge der Plattform ermöglichen es, Kunden nach Verhaltens- und Transaktionsdaten zu kategorisieren und so ein tieferes Verständnis der Kundenbedürfnisse zu erlangen. Darüber hinaus helfen KI-gestützte Erkenntnisse von Klaviyo, zukünftige Trends vorherzusagen, sodass Ihr Team fundierte Entscheidungen treffen kann, um die Kundenbindung und -zufriedenheit zu steigern.
Klaviyo Hauptfunktionen
Neben den Echtzeit-Datenfunktionen bietet Klaviyo noch weitere Features:
- Omnichannel-Marketing: Mit dieser Funktion können Sie Kunden auf verschiedenen Plattformen erreichen, was eine einheitliche Kommunikation und ein verbessertes Kundenerlebnis gewährleistet.
- E-Mail- und SMS-Marketing: Klaviyo stellt Werkzeuge zur Verfügung, mit denen Sie zielgerichtete E-Mail- und SMS-Kampagnen erstellen können, um Kunden mit personalisierten Nachrichten anzusprechen.
- Kundenprofile: Sie können detaillierte Kundenprofile anlegen, Daten aus verschiedenen Quellen integrieren und so ein umfassendes Bild aller Kundeninteraktionen gewinnen.
- Attributionsberichte: Verfolgen Sie, wie verschiedene Kampagnen und Abläufe zu Conversions und Umsatz über verschiedene Kanäle beitragen.
Klaviyo-Integrationen
Integrationen sind unter anderem mit Shopify, Magento, WooCommerce, BigCommerce, Salesforce, Stripe, Facebook, Instagram, Google Ads und Zendesk möglich.
Pros and Cons
Pros:
- Ermöglicht umfassende Datenintegration für einheitliche Kundenprofile.
- Bietet KI-gestützte Einblicke für personalisierte Marketingstrategien.
- Unterstützt Omnichannel-Marketing, einschließlich E-Mail, SMS und Social Media.
Cons:
- Einige Nutzer wünschen sich mehr Anpassungsmöglichkeiten.
- Die Preise können schnell steigen, wenn die Kontaktlisten wachsen.
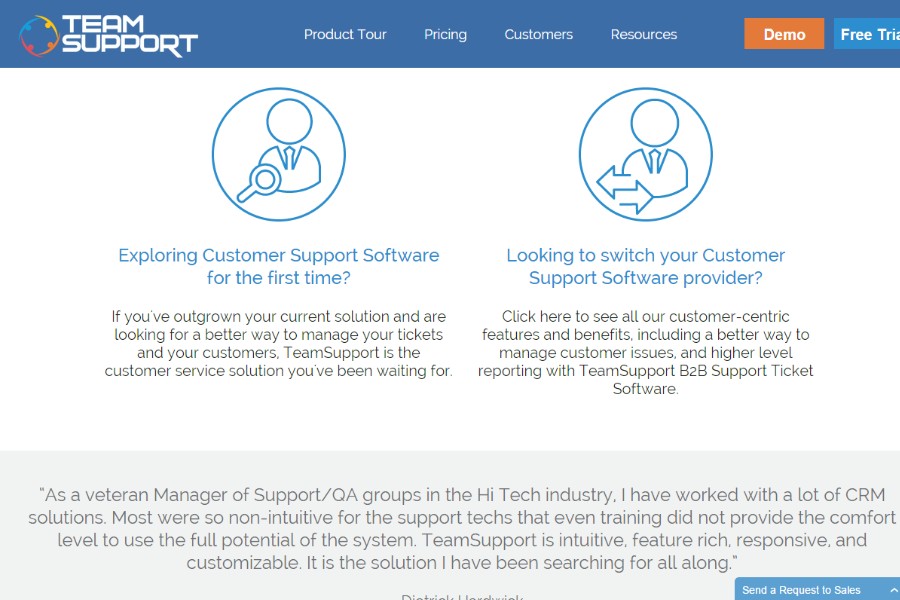
TeamSupport ist eine B2B-Kundensupport-Plattform, die für Unternehmen entwickelt wurde, die komplexe Serviceumgebungen verwalten. Sie vereint Ticketautomatisierung, Workflow-Management und integrierte Kundendatenverfolgung, um Support-Teams dabei zu unterstützen, sich über verschiedene Accounts hinweg abzustimmen und Probleme effizient zu lösen. Dank nativer CRM-Integrationen und einer offenen API für individuelle Anbindungen erhalten Teams klare Einsicht in die Kundenhistorie, laufende Fälle und Leistungskennzahlen, sodass sie den Support in großem Umfang managen können.
Warum ich TeamSupport gewählt habe
Ich habe mich für TeamSupport entschieden, weil die Plattform den Schwerpunkt auf eine verbesserte Teamzusammenarbeit durch Kundenanalysen legt. Der zentrale Hub für Kundeninteraktionen ermöglicht es Ihnen, einen umfassenden Überblick über die Kundenhistorie zu behalten, was für Analysen entscheidend ist. Zudem bieten die KI-Funktionen der Plattform, wie Ticket-Zusammenfassungen und intelligente Hilfestellungen, umsetzbare Erkenntnisse zu Kundeninteraktionen – damit lassen sich Trends und Verbesserungsmöglichkeiten erkennen. Diese Funktionen passen perfekt zu Unternehmen, die ihre Kundensupport-Prozesse mithilfe von Analysen optimieren möchten.
TeamSupport – Hauptfunktionen
Neben den Funktionen zur Zusammenarbeit und künstlichen Intelligenz bietet TeamSupport weitere Features, die es zu einer starken Lösung für Kundenanalysen machen:
- Interner Chat: Ermöglicht reibungslose Kommunikation innerhalb Ihres Support-Teams, um Kundenanliegen effizienter zu klären.
- Kollisions-Erkennung: Verhindert, dass mehrere Mitarbeiter gleichzeitig am selben Ticket arbeiten, und sorgt so für einen optimierten Support-Prozess.
- Regeln zur Ticket-Zuweisung: Automatisieren Sie die Verteilung von Support-Tickets nach vordefinierten Kriterien und optimieren Sie damit die Arbeitslast im Team.
- Reporting-Tools: Bieten umsetzbare Einblicke in Support-Kennzahlen, sodass Sie die Leistung nachverfolgen und Verbesserungspotenziale identifizieren können.
TeamSupport-Integrationen
Integrationen umfassen Salesforce, HubSpot, Microsoft Teams, SAP Sales and Service Clouds, Jira und MailChimp. Für individuelle Integrationen steht eine offene API zur Verfügung.
Pros and Cons
Pros:
- KI-gestützte Ticketautomatisierung
- Echtzeit-Stimmungsanalysen
- Anpassbares Self-Service-Portal für Kunden
Cons:
- Wissensdatenbank ist wenig konfigurierbar
- Begrenzte Funktionalität der mobilen App
Velaris
Am besten geeignet, um die Gesundheit von Kundenportfolios zu verstehen
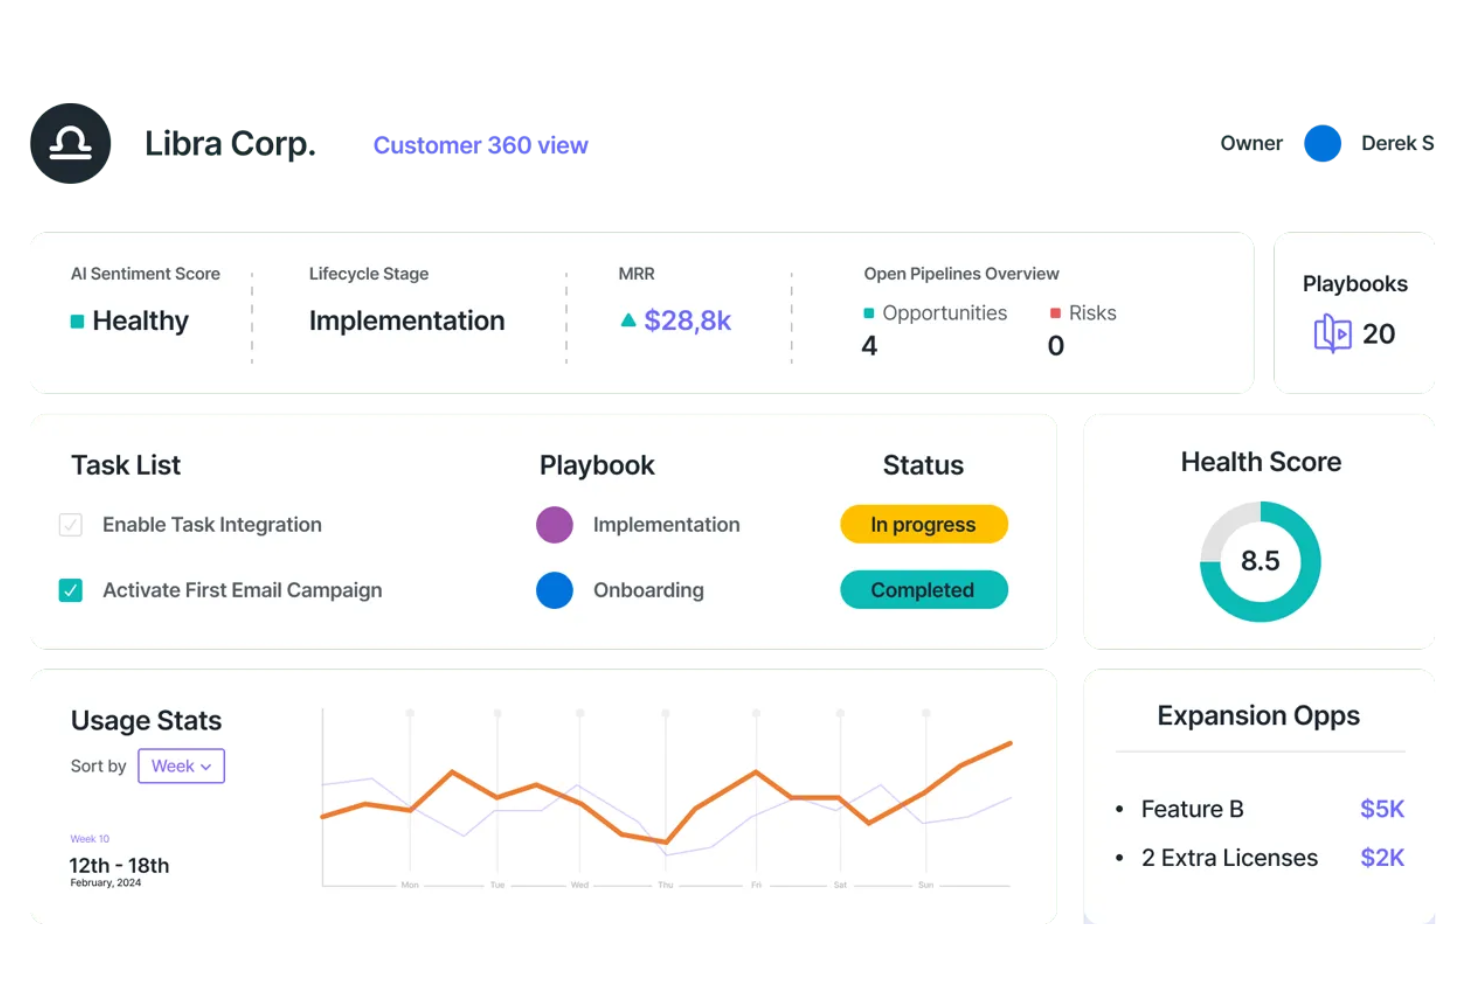
Velaris ermöglicht Ihrem Team KI-gesteuerte Einblicke, um Kundeninteraktionen in strategische Chancen zu verwandeln. Entwickelt für Führungskräfte im Bereich Customer Success, Vertriebsteams und Geschäftsleitung, integriert sich Velaris mit über 70 Anwendungen, um eine nahtlose Ansicht von Kundendaten und -gesundheit bereitzustellen. So werden proaktive Interaktionen und fundierte Entscheidungen möglich. Durch die Vorhersage von Abwanderungsrisiken und die Automatisierung von Aufgaben mit geringem Wert können Sie sich darauf konzentrieren, personalisierte Kundenreisen zu gestalten und dauerhafte Beziehungen aufzubauen, ohne Ihre Arbeitsbelastung zu erhöhen.
Warum ich Velaris gewählt habe
Ich habe Velaris gewählt, weil es ein umfassendes Verständnis von Kundenportfolios durch KI-gestütztes Gesundheitsmonitoring und anpassbare Gesundheitswerte bietet. Diese Funktion ermöglicht es Ihrem Team, Kundenbeziehungen proaktiv zu steuern, indem gefährdete Konten identifiziert und potenzielle Probleme erkannt werden, bevor sie eskalieren. Darüber hinaus bietet Velaris Echtzeit-Dashboards, die Kundendaten zentralisieren und Ihnen eine 360-Grad-Sicht verschaffen, die strategisches Handeln unterstützt. Durch die Automatisierung routinemäßiger Aufgaben schafft Velaris Freiräume, damit Sie sich auf wertvolle Kundeninteraktionen konzentrieren können – ideal für alle, die die Analytik im Bereich Kundenerlebnis verbessern möchten.
Hauptfunktionen von Velaris
Neben seinen Stärken beim Verständnis der Gesundheit von Kundenportfolios bietet Velaris eine Reihe von Funktionen, die die Analyse der Kundenerfahrung Ihres Teams optimieren.
- Customer 360 View: Diese Funktion liefert einen umfassenden Überblick über Kundenkonten und bündelt Informationen für einfachen Zugriff und Pipeline-Management.
- Sentiment-Analyse: Mithilfe von KI analysiert diese Funktion die Stimmung der Kunden und erkennt häufige Probleme, um wertvolle Einblicke in die Interaktionen zu erhalten.
- Custom Objects: Ermöglicht die Erstellung individueller Datenfelder für komplexe Prozesse und bietet so Flexibilität bei der Verwaltung einzigartiger Geschäftsanforderungen.
- Kollaborationstools: Erleichtert Kundeninteraktionen über ein eigenes Portal und verbessert so Kommunikation und Einbindung mit Ihren Kunden.
Velaris-Integrationen
Zu den Integrationen gehören Hubspot, Intercom und mehr als 70 weitere native Tools. Velaris unterstützt außerdem individuelle Integrationen, um sich Ihren Geschäftsanforderungen anzupassen.
Pros and Cons
Pros:
- Fortschrittliche Analysen und Erfolgspläne, unterstützt durch KI
- Gute Zusammenführung von Kundendaten
- Anpassbare Dashboards erlauben individuelle Datenvisualisierung
Cons:
- Mangel an genügend Nutzerfeedback für eine umfassende Bewertung
- Wirksamkeit der Integrationen hängt von den bestehenden Systemen ab
Gegründet im Jahr 2002, unterstützt InMoment Unternehmen weltweit dabei, wichtige Kundeninformationen zu gewinnen. Die Plattform ist darauf spezialisiert, Erkenntnisse aus Umfragen, Kommentaren und anderen Datenquellen zu extrahieren. InMoment nutzt KI und Textanalytik, um Daten in umsetzbare Erkenntnisse zu verwandeln.
Warum ich InMoment ausgewählt habe: Mich fasziniert der Einfluss von KI und wie InMoment diese revolutionäre Technologie integriert hat. InMoment verfügt über einen beeindruckenden Generator für intelligente Zusammenfassungen, der auf den Grundsätzen von GPT basiert. Diese Funktion verwandelt mehrere verschiedene Rückmeldungen in kurze und strukturierte Absätze.
InMoment nutzt Natural Language Processing (NLP), um die Stimme des Kunden (VoC) zu erkennen. Darüber hinaus verfügt InMoment über starke Funktionen zur Sentiment-Identifikation, um genau zu verstehen, wie Ihre Kunden über eine bestimmte digitale Reise denken.
Herausragende Funktionen und Integrationen von InMoment:
Funktionen , die InMoment auszeichnen, sind die Automatisierung von Kundenfeedback über verschiedene Kanäle hinweg. Dadurch können Sie Ermüdung durch zu viele Umfragen reduzieren und gleichzeitig einen kontinuierlichen Feedbackfluss aufrechterhalten. InMoment bietet außerdem eine interessante Funktion zur Wirkungsvorhersage, mit der Sie verstehen, wie bestimmte Merkmale Ihre NPS-, CES- und CSAT-Werte beeinflussen können.
Integrationen umfassen Werkzeuge wie Adobe, Intercom, Microsoft Dynamics, Quantum, Salesforce, Workday, Zapier, Zendesk und andere.
Pros and Cons
Pros:
- Umfassende Berichtswerkzeuge
- 24/7-Live-Support
- Ausgezeichnete Funktionen für Kundenumfragen
Cons:
- Leicht steile Lernkurve
- Bearbeitung der Umfrageergebnisse etwas herausfordernd
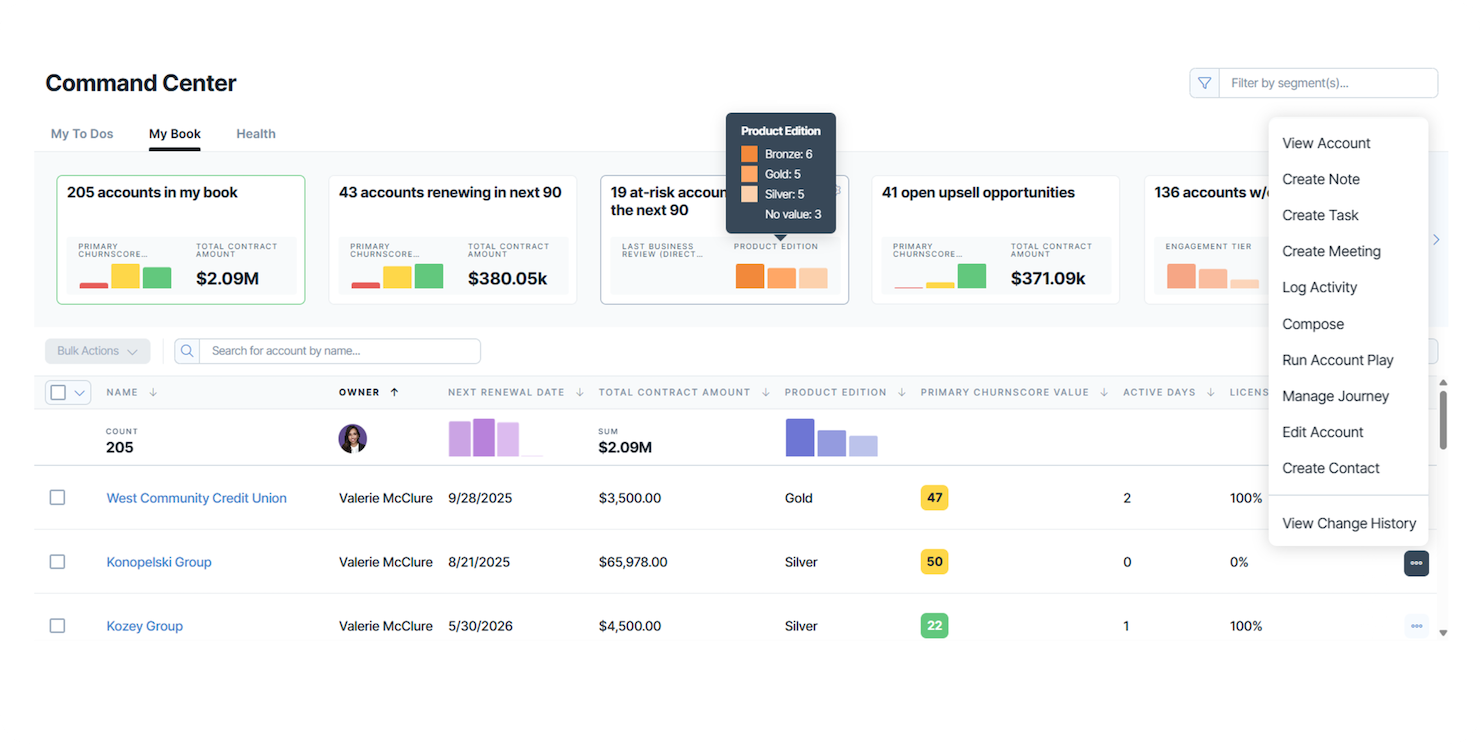
ChurnZero hilft Ihren Customer-Success-Teams dabei, Nutzungs-, Engagement- und Adoptionsdaten in Erkenntnisse umzuwandeln, sodass Sie auf Wachstumschancen und Risiken beim Kundenverlust reagieren können. Es zentralisiert Health Scores, Nutzungsaktivitäten und Kundenreisen, um Analysen nach dem Verkauf zu unterstützen.
Warum ich ChurnZero ausgewählt habe: Ich habe ChurnZero wegen seines starken Fokus darauf gewählt, nicht nur Abwanderung zu verhindern, sondern auch Wachstum zu ermöglichen—indem es genau identifiziert, wann Kunden für Cross-Selling und Up-Selling bereit sind. Die Plattform kombiniert Kundengesundheitsbewertung, Nutzungsüberwachung und automatisierte Workflows, sodass Ihr Team Wachstumssignale erkennen kann, anstatt nur auf Risiken zu reagieren. Für Analytics-Teams mit Fokus auf Expansion bietet ChurnZero einen klaren Weg.
Herausragende Funktionen & Integrationen:
Funktionen umfassen dynamische Modelle zur Health Score-Berechnung, die Nutzung, Support-Interaktion und Verhaltenssignale einbeziehen; spezielle Dashboards für Expansion zur Identifikation von Up-Sell-/Cross-Sell-Möglichkeiten; Automatisierung der Kundenbindung und Playbooks, die durch definierte Signale (z. B. Erreichen eines Nutzungsschwellenwerts) ausgelöst werden. Integrationen umfassen große CRMs (Salesforce, HubSpot), Abrechnungssysteme, Slack, Zendesk, Webhooks und API-Unterstützung.
Integrationen umfassen Salesforce, HubSpot, Zendesk, Slack, Webhooks, benutzerdefinierten API-Zugang und bidirektionale Synchronisation mit Abrechnungs-/Abonnement-Plattformen.
Pros and Cons
Pros:
- Identifiziert vielversprechende Kunden für Cross-Selling und Up-Selling
- Kombiniert Kundengesundheit, Nutzung und Engagementdaten
- Automatisiert Playbooks basierend auf Expansionssignalen
Cons:
- Die anfängliche Einrichtung und Integration kann zeitaufwändig sein
- Die Tiefe der Analysen kann für die vollständige Nutzung eine Schulung erfordern
Am besten geeignet zur Analyse von Google Ads-Kampagnen
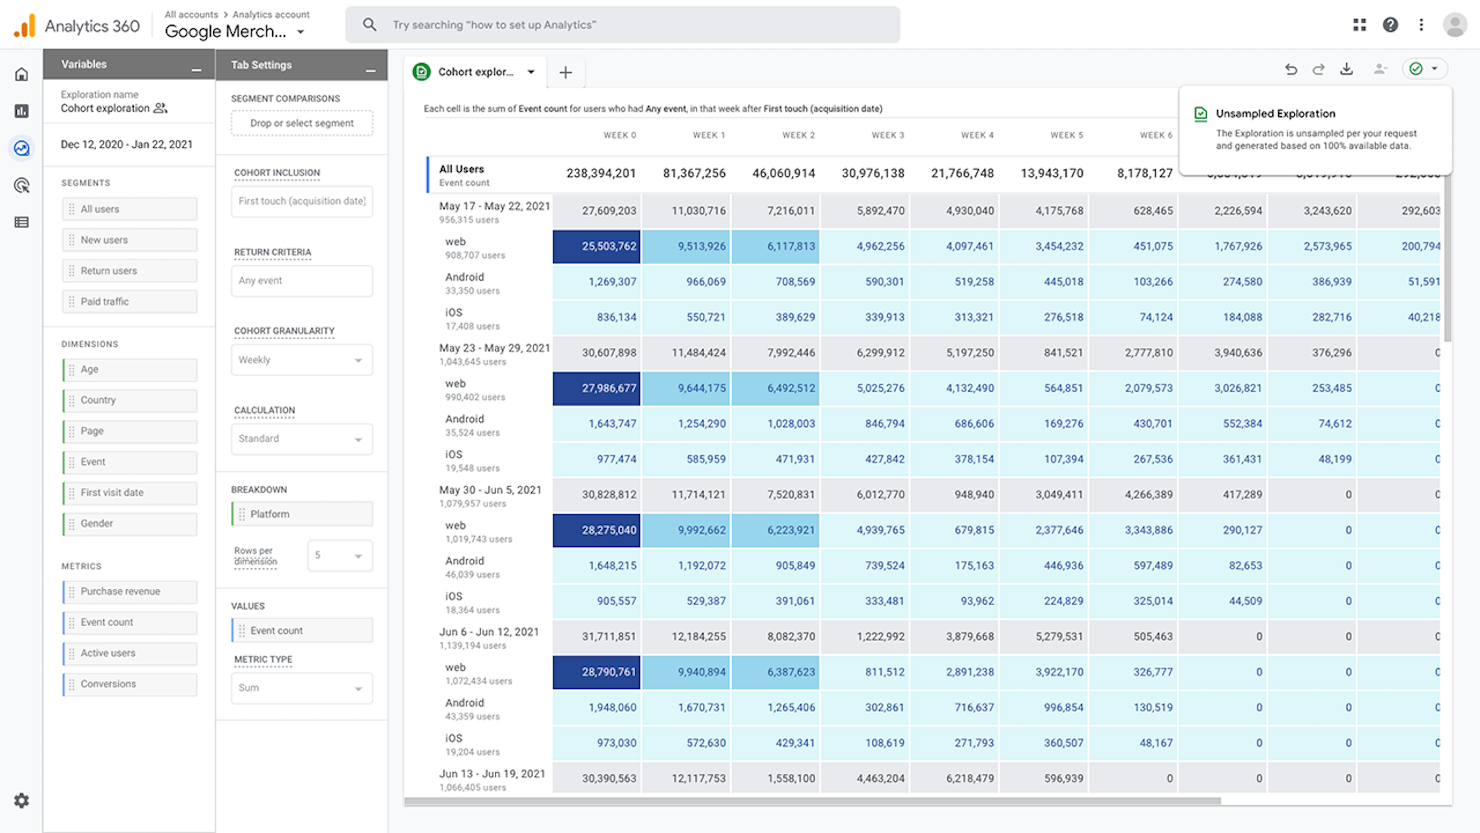
Google Analytics hilft Ihrem Team dabei, zu messen, wie Kunden Ihre digitalen Angebote finden, mit ihnen interagieren und konvertieren. Es verbindet Marketing- und Verhaltensdaten, sodass Sie sehen können, wie sich der Anzeigenverkehr in reale Nutzererfahrungen und -ergebnisse umsetzt.
Warum ich Google Analytics ausgewählt habe: Ich habe Google Analytics ausgewählt, weil es die Leistung von Anzeigen nahtlos mit der Kundenerfahrung verknüpft. Durch die Verbindung mit Google Ads können Sie analysieren, wie Kampagnen das Engagement, die Absprungraten und die Conversion-Pfade innerhalb Ihrer Website oder App beeinflussen. Es ist ideal für Teams, die vollständige Einblicke in die gesamte Customer Journey haben möchten – vom Klick auf die Anzeige über das Verhalten auf der Website bis zur Conversion – und das alles innerhalb des Google-Ökosystems.
Hauptmerkmale & Integrationen
Funktionen sind unter anderem anpassbare Dashboards, Funnel- und Pfadanalysen, Attributionsmodelle und Ereignis-Tracking für wichtige Kundenaktionen. Integrierte Schnittstellen zu Google Ads und der Search Console zeigen, welche Kampagnen hochwertige Sitzungen, nicht nur Klicks, generieren. Sie können Zielgruppen segmentieren, Landingpage-Erlebnisse vergleichen und die Performance über verschiedene Geräte und Traffic-Quellen hinweg messen.
Integrationen umfassen Google Ads, Google Tag Manager, Google Search Console, BigQuery, Data Studio (Looker Studio), Firebase, Shopify und API/Webhooks für den Datenaustausch.
Pros and Cons
Pros:
- Verfolgt Nutzerwege über Web- und Mobilkanäle hinweg
- Leistungsstarke Segmentierungs- und Attributionsmodellierungsfunktionen
- Native Integration in das erweiterte Google-Marketing-Ökosystem
Cons:
- Erfordert korrektes Tagging zur Sicherstellung der Datenqualität
- Einarbeitungsaufwand bei komplexem Event- und Conversion-Setup
Tableau
Am besten geeignet, um das Ausgabeverhalten von Kunden zu erkennen
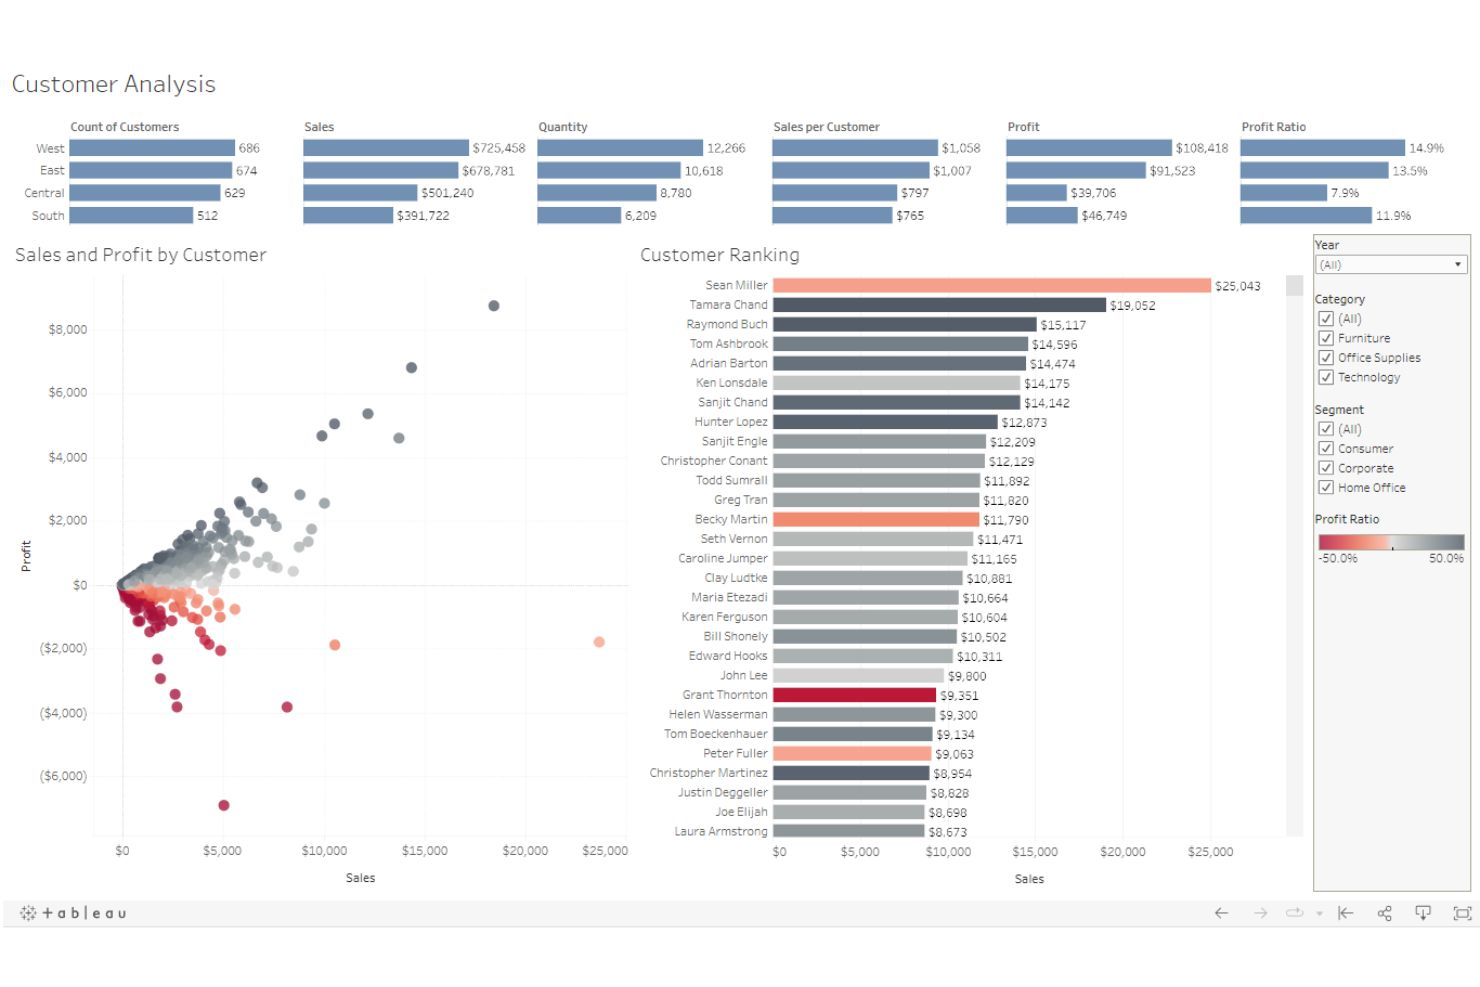
Tableau von Salesforce ist der heilige Gral für Datenerfassung, -analyse und -visualisierung. Mit dem spannenden Motto „Datenbanken und Tabellenkalkulationen für jedermann verständlich machen“ setzt sich Tableau das Ziel, erstklassige Datenanalysetools bereitzustellen.
Warum ich Tableau gewählt habe: Mich beeindruckt, wie Tableau komplexe Datenanalysefunktionen in ein einfaches, benutzerfreundliches Dashboard packt. Mit Tableau können Sie verschiedene Datenquellen verbinden und visuell erkunden. So lassen sich interaktive Dashboards, Diagramme, Grafiken und Karten erstellen, um das Ausgabeverhalten von Kunden zu verstehen.
Tableau unterstützt auch die Kundensegmentierung anhand verschiedener Kriterien wie Demografie, Kaufhistorie, Verhalten und mehr. Darüber hinaus gruppiert die Kohortenanalyse von Tableau Kunden anhand gemeinsamer Merkmale. So können Sie den Customer Lifetime Value und die Retentionsrate berechnen.
Tableau-Hauptfunktionen und Integrationen:
Ein herausragendes Merkmal ist eine intuitive Drag-and-Drop-Oberfläche, mit der Sie in wenigen Minuten interaktive Dashboards erstellen können. Zudem bietet Tableau hervorragende Datenvorbereitungs- und Transformationsfunktionen wie Pivot, Teilen und Zusammenführen, um die Datenqualität vor der Analyse zu sichern.
Integrationen umfassen Tools wie Azure, BigQuery, DataRobot, Google Analytics, Google Sheets, Hive, Presto, Salesforce, Splunk, Vertica und andere.
Pros and Cons
Pros:
- Vielfältige Exportmöglichkeiten
- Hervorragende Storytelling-Funktionen
- Umfangreiche Bibliothek an Visualisierungstools
Cons:
- Steile Lernkurve
- Weniger individuelle Programmiermöglichkeiten
Mixpanel
Am besten geeignet, um die Ursachen von Reibungspunkten in der Customer Journey aufzudecken
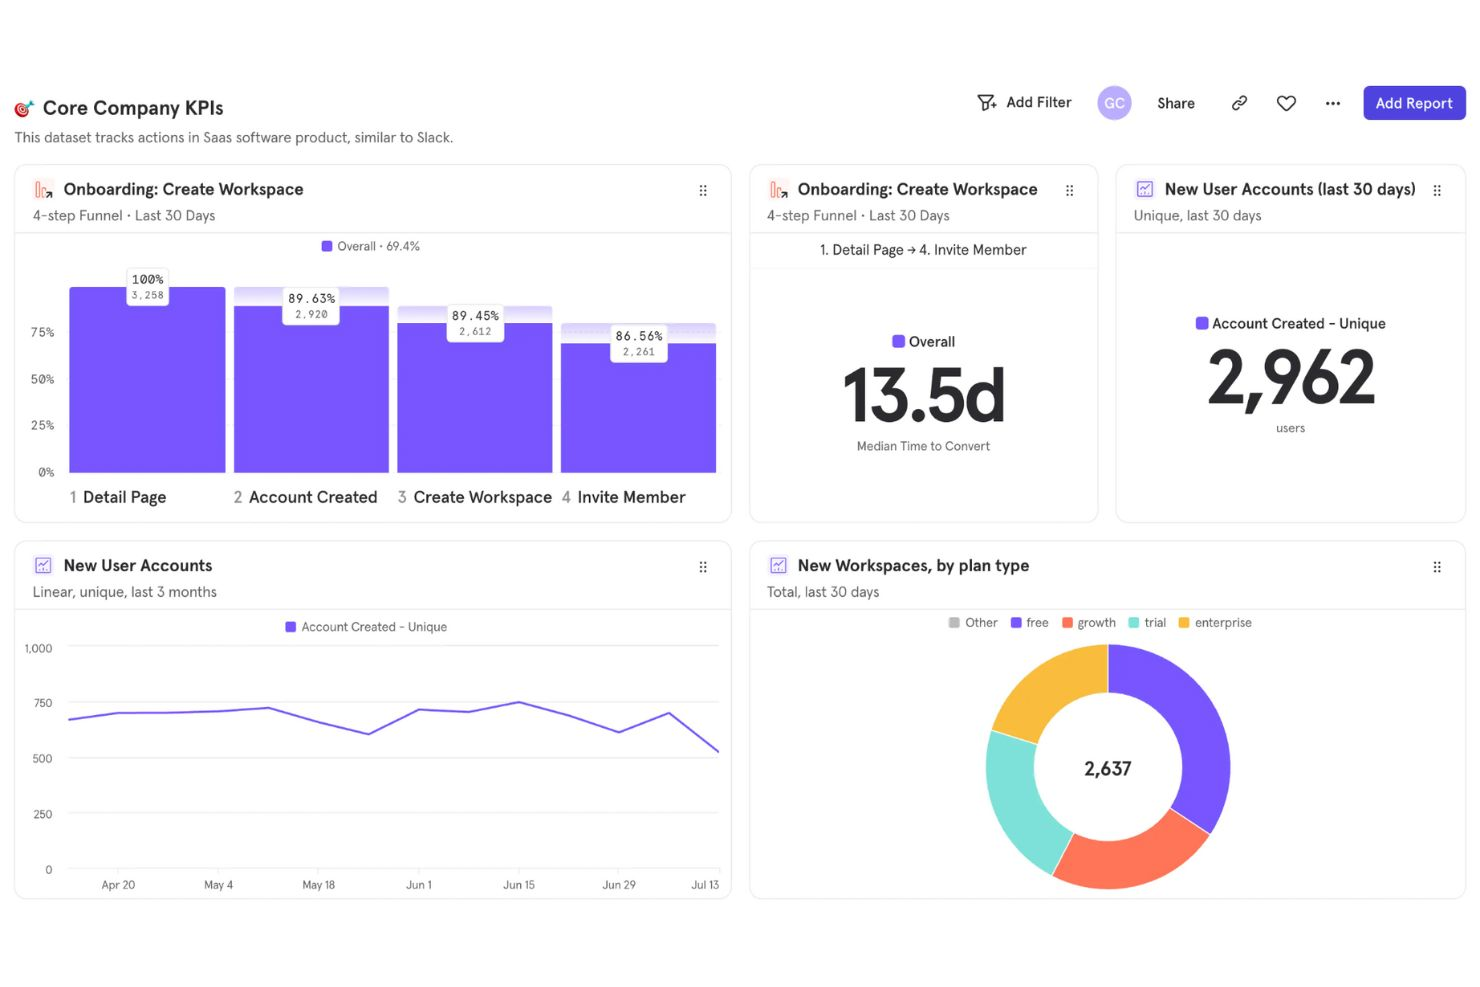
Mixpanel ist spezialisiert auf das Nachverfolgen von Nutzerinteraktionen mit digitalen Produkten wie mobilen und Web-Anwendungen. Die Plattform sammelt und analysiert verschiedene Datenpunkte, um Verbesserungspotenziale aufzuzeigen.
Warum ich Mixpanel ausgewählt habe: Als CX-Professional bin ich immer neugierig herauszufinden, was Menschen zu bestimmten Reaktionen bewegt. Mit Mixpanel lässt sich die Wurzel von Reibungspunkten in Ihrem digitalen Produkt ermitteln. Darüber hinaus hilft das Tool, Erfolg messbar zu machen, indem sichtbar wird, wie Nutzer an bestimmten Stationen der Customer Journey konvertieren.
Zudem ermöglicht Mixpanel das Testen von Varianten, um Ihre Feature-Ideen zu validieren. Dadurch erhalten Ihre Entwicklungs-Sprints eine klare Richtung und Fokus. Das Fazit: Mixpanel hilft, wichtige Erkenntnisse ans Licht zu bringen, die Veränderungen anstoßen und so die Kundentreue steigern.
Mixpanel – Hervorstechende Funktionen und Integrationen:
Eine besonders herausragende Funktion, die Mixpanel abhebt, ist die Analyse, warum sich bestimmte Kennzahlen verändern. Sie können Metriken nach demografischen Merkmalen und Nutzerverhalten filtern. Darüber hinaus erlauben die Datenfilter zahlreiche Segmentierungen, um aussagekräftige Einblicke zu gewinnen.
Integrationen umfassen Tools wie Appcues, Braze, Figma, Google Cloud, Microsoft Azure, Productboard, Slack, Split, Sprig, WebEngage und weitere.
Pros and Cons
Pros:
- Umfangreiche Berichte mit Grafiken und Panels
- Großer Spielraum für individuelle Analysen
- Kampagnenautomatisierung
Cons:
- Etwas steile Lernkurve
- Gelegentliche Fehler bei individuellen Nachrichten
Weitere Optionen
Hier sind noch einige weitere Customer Experience Analytics Tools, die es zwar nicht in meine Top 20 geschafft haben, aber dennoch einen Blick wert sind:
- Hotjar
Am besten für aussagekräftige Heatmaps
- Treasure Data
Idéal pour prédire les probabilités d’attrition client
- UXCam
Am besten zur Verbesserung der Kundenbindung in mobilen Apps
- CleverTap
Am besten geeignet, um Nutzertrends bei mobilen Apps zu erkennen
- Pendo
Am besten geeignet zur Erstellung rückwirkender Analysen
- Gainsight
Am besten geeignet, um NLP zur Analyse der Stimme des Kunden zu nutzen
- Woopra
Am besten geeignet, um aufschlussreiche Berichte zur Customer Journey zu erstellen
- Sprout Social
Am besten geeignet für Social-Media-Kundenanalysen
- Kissmetrics
Am besten geeignet, um wichtige Umsatzstatistiken vorherzusagen
- Zoho PageSense
Am besten geeignet zur Analyse von Website-Formularübermittlungen
- MonkeyLearn
Am besten für codelose Textanalysen
- Creatio CRM
Ideal für automatisierte 360-Grad-Kundenansichten auf einer No-Code-Plattform
- Amplitude
Am besten geeignet zur Reduzierung von Warenkorbabbrüchen im E-Commerce
- Unwrap
Am besten geeignet, um die Kundenzufriedenheit und -stimmung zu verstehen


Was sind Customer Experience Analytics Tools?
Customer Experience Analytics Tools sind Softwareplattformen, die Kundendaten analysieren, um Muster, Präferenzen und auch Hürden zu erkennen. Sie helfen Unternehmen, das Verhalten über verschiedene Kanäle hinweg zu verstehen, fundiertere Entscheidungen zu treffen und die Customer Journey optimal zu gestalten.
Wie Sie das beste Customer Experience Analytics Tool auswählen
Nutzen Sie diese praktische Checkliste, um das beste Customer Experience Analytics Tool für sich und Ihr Team auszuwählen.
☐ Verfügt die Software über die 2-3 Funktionen, die mir am wichtigsten sind?
☐ Welche besonderen oder zusätzlichen Funktionen zeichnet diese Software aus?
☐ Passt die Software zu meiner Teamgröße, egal ob groß oder klein?
☐ Lässt sie sich in die von mir täglich genutzten Apps integrieren (z. B. E-Mail, Slack etc.)?
☐ Ist die Software für ihre Benutzerfreundlichkeit bekannt?
☐ Stimmen die Werte der Software mit meinen eigenen überein?
☐ Liegt sie in meinem Budget?
Trends bei Customer Experience Analytics Tools
Customer Experience Analytics Tools entwickeln sich ständig weiter – neue Trends prägen die Branche.
Integration von KI und maschinellem Lernen
Künstliche Intelligenz (KI) und maschinelles Lernen werden zunehmend zu einem integralen Bestandteil und liefern tiefere Einblicke sowie automatisierte, komplexe Analysen. Dieser Trend ist wichtig, um die prognostischen Fähigkeiten zu verbessern.
Echtzeit-Datenverarbeitung
Die Verarbeitung von Daten in Echtzeit gewinnt an Bedeutung, da Unternehmen dadurch unmittelbare Entscheidungen treffen können. Dieser Trend ist entscheidend, um in schnelllebigen Märkten wettbewerbsfähig zu bleiben.
Multi-Channel-Datenintegration
Die Integration von Daten aus verschiedenen Kanälen wird zum Standard und bietet einen ganzheitlichen Blick auf das Kundenverhalten. Dieser Trend ist entscheidend für umfassende Kundenanalysen.
Verbesserte Datenschutzmaßnahmen
Mit zunehmenden Datenschutzbedenken setzen Tools auf fortschrittliche Sicherheitsfunktionen. Dieser Trend ist unerlässlich, um das Vertrauen der Kunden zu erhalten.
Anpassbare Dashboards
Anpassbare Dashboards werden immer verbreiteter und ermöglichen es Anwendern, ihre Analyseumgebung individuell zu gestalten. Dieser Trend ist wichtig, um unterschiedlichen geschäftlichen Anforderungen gerecht zu werden.
Funktionen von Customer Experience Analytics Tools
Beim Auswählen von Customer Experience Analytics Tools sollten Sie auf folgende Schlüsselfunktionen achten:
- Umfassende Datenintegration: Verbinden Sie Daten nahtlos aus verschiedenen Quellen wie Websites, mobilen Apps, Kundensupport und sozialen Medien, um ein vollständiges Bild des Kundenverhaltens zu erhalten. Diese Funktion hilft dabei, Datensilos aufzubrechen und verschafft Ihnen eine einheitliche Sicht auf die Customer Journey.
- Echtzeit-Analysen: Greifen Sie auf aktuelle Einblicke zu, während Kundeninteraktionen stattfinden. Mit Echtzeit-Analysen erkennen Sie schnell Trends oder Probleme und können agil reagieren, um Ihre Kunden genau dann zu begeistern, wenn es am wichtigsten ist.
- Anpassbare Dashboards: Individualisieren Sie Dashboards, um genau die Kennzahlen und Visualisierungen darzustellen, die für Sie und Ihr Team wichtig sind. So lassen sich KPIs einfach überwachen und Erkenntnisse mit anderen teilen, ohne sich durch Datenberge wühlen zu müssen.
- Segmentierung und Filterung: Gruppieren Sie Kunden basierend auf Verhalten, Demografie oder Feedback. Mithilfe der Segmentierung können Sie unterschiedliche Kundenbedürfnisse erkennen und Strategien gezielt anpassen.
- Journey Mapping: Visualisieren Sie jeden Schritt der Kundenreise, um Schwachstellen, Absprünge und Verbesserungsmöglichkeiten zu identifizieren. Diese Funktion ermöglicht es Ihnen, sich in die Lage des Kunden zu versetzen und reibungslosere, angenehmere Erlebnisse zu schaffen.
- Feedback-Erfassung und -Analyse: Sammeln und analysieren Sie Feedback aus Umfragen, Bewertungen, Chats und mehr ganz leicht. So verstehen Sie die Kundenzufriedenheit besser und erkennen, wo Ihr Service glänzt oder Optimierung braucht.
- Benachrichtigungen und Alerts: Richten Sie automatische Benachrichtigungen für wichtige Ereignisse wie sinkende Zufriedenheitswerte oder einen Anstieg bei Support-Tickets ein. So bleiben Sie informiert und können handeln, bevor aus kleinen Problemen große werden.
- Leistungsstarke Berichte: Erstellen Sie detaillierte, leicht verständliche Berichte, die Erkenntnisse für alle Unternehmensebenen aufschlüsseln. Teilen Sie Erfolge, Learnings und Maßnahmenpläne ohne Tabellenkalkulationsdrama.
Häufige KI-Funktionen in Customer Experience Analytics Tools
Über die oben genannten Standardfunktionen hinaus integrieren viele dieser Lösungen KI mit Merkmalen wie:
- Vorausschauende Kundenanalysen: Nutzen Sie KI, um das Verhalten Ihrer Kunden vorherzusagen, wie zum Beispiel wer abwandern oder zum größten Fan werden könnte. So können Sie Beziehungen pflegen und unangenehme Überraschungen vermeiden.
- Verarbeitung natürlicher Sprache (NLP): Analysieren Sie automatisch offene Rückmeldungen, Support-Chats oder Bewertungen hinsichtlich Stimmung und wiederkehrender Themen. So erschließen Sie riesige Mengen unstrukturierter Daten im Handumdrehen.
- Automatisierte Sentiment-Analyse: Lassen Sie die KI die Stimmung und Zufriedenheit der Kunden aus E-Mails, Anrufen oder Kommentaren einschätzen. Sie erkennen Muster schnell und können Anliegen teilweise adressieren, bevor Ihre Kunden sich überhaupt melden.
- Anomalieerkennung: KI identifiziert unerwartete Veränderungen im Kundenverhalten oder Feedback, sodass Sie plötzliche Verschiebungen untersuchen und einen gleichbleibend guten Service bieten können.
- Intelligente Empfehlungen: Erhalten Sie KI-gestützte Vorschläge für nächste Schritte – etwa, welche Verbesserungen Priorität haben oder welche Kunden Sie zuerst kontaktieren sollten. So stellen Sie sicher, dass Ihr Handeln mit den wichtigsten Anliegen Ihrer Kundschaft abgestimmt ist.
Vorteile von Customer Experience Analytics Tools
Tools zur Analyse der Kundenerfahrung bieten viele Vorteile für Anwender und Unternehmen. Hier sind die wichtigsten Vorteile:
- Verbessertes Kundenverständnis: Bietet tiefgehende Einblicke in das Verhalten und die Vorlieben der Kunden.
- Bessere Entscheidungsfindung: Ermöglicht datenbasierte Entscheidungen auf Grundlage präziser und aktueller Informationen.
- Höhere Kundenbindung: Identifiziert abwanderungsgefährdete Kunden und unterstützt gezielte Maßnahmen zur Bindung.
- Optimierte Marketingkampagnen: Ermöglicht eine gezielte Ansprache und Personalisierung von Marketingmaßnahmen.
- Umsatzsteigerung: Fördert das Unternehmenswachstum durch Identifikation und Optimierung neuer und bestehender Chancen.
Diese Vorteile unterstreichen den Wert von Customer Experience Analytics Tools für Unternehmen.
Kosten und Preise von Customer Experience Analytics Tools
Die Kosten für Tools zur Analyse der Kundenerfahrung variieren je nach Funktionsumfang und Tarifart.
| Tarifart | Durchschnittspreis | Übliche Funktionen |
|---|---|---|
| Gratis-Tarif | $0 | Basisanalysen, begrenzter Speicherplatz, Standardberichte |
| Persönlicher Tarif | $20/Monat | Erweiterte Analysen, mehr Speicherplatz, anpassbare Berichte |
| Firmentarif | $100/Monat | Umfassende Analysen, Multi-User-Zugriff, Echtzeitdaten |
| Unternehmens-Tarif | $500/Monat | Vollständiger Funktionsumfang, dedizierter Support, erweiterte Sicherheit |
Diese Tabelle gibt einen Überblick über die durchschnittlichen Tarife und Kosten für Kundenanalyse-Tools.
Weitere Fragen
Hier finden Sie Antworten auf häufig gestellte Fragen zu Tools für die Kundenanalyse:
Wie wähle ich das richtige Analytics-Tool für Kundenerlebnisse für mein Team aus?
Starten Sie damit, die wichtigsten Ziele Ihres Teams abzustecken – etwa die Verbesserung des NPS, die Steigerung der Kundenbindung oder die Optimierung des Kundenfeedbacks. Bewerten Sie Tools nach Funktionen, die gezielt Ihre Herausforderungen adressieren – zum Beispiel kanalübergreifende Feedback-Erhebung, fortschrittliche Berichte oder KI-gestützte Sentimentanalyse. Beachten Sie zudem die Benutzerfreundlichkeit: Ein übersichtliches Dashboard ist entscheidend für die Akzeptanz im Team. Prüfen Sie Integrationsmöglichkeiten mit bestehenden Systemen wie CRM, Helpdesk oder Marketingplattformen, um Datensilos zu vermeiden. Beurteilen Sie den Support des Anbieters sowie Sicherheits- und Compliance-Standards und bevorzugen Sie Anbieter mit individuellen Demos oder Testphasen, um Workflows vorab im Alltag zu testen.
Welche Kennzahlen sollte ich mit Tools für Kundenerlebnis-Analysen erfassen?
Sie sollten einen Mix aus quantitativen und qualitativen Kennzahlen erfassen, um möglichst ganzheitliche Einblicke zu erhalten. Beginnen Sie mit Basiswerten wie dem Net Promoter Score (NPS), Customer Satisfaction (CSAT) und Customer Effort Score (CES), um Loyalität und erste Eindrücke zu messen. Ergänzen Sie operative Kennzahlen wie Churn-Rate, Erstreaktions- sowie Lösungszeiten, um Prozessengpässe zu erkennen. Nutzen Sie Journey Analytics, um Abbruchpunkte und Conversion-Raten entlang unterschiedlicher Touchpoints zu überwachen. Manche Tools erlauben es, Stimmungen durch Analyse von Social Media, Chats oder E-Mails aufzudecken und so verborgene Probleme oder positive Entwicklungen zu entdecken, die in Umfragen nicht erfasst werden. Das Zusammenspiel dieser Kennzahlen ermöglicht es Ihnen, Ihre CX-Strategie in Echtzeit anzupassen.
Lassen sich Tools für die Analyse des Kundenerlebnisses mit meinem bestehenden CRM oder Supportsystemen integrieren?
Ja, Integrationsmöglichkeiten sind für CX-Verantwortliche besonders wichtig und die meisten führenden Tools bieten vorgefertigte Schnittstellen für gängige CRMs (wie Salesforce, monday CRM oder HubSpot) sowie Helpdesk-Systeme (z.B. Zendesk oder Freshdesk). So können Sie Kundeninteraktionen, Tickets und Feedback-Daten automatisch synchronisieren – manuelle Übertragungen und Fehlerquellen fallen weg. Manche Plattformen bieten auch API-Zugänge für maßgeschneiderte Integrationen, die speziell auf die Bedürfnisse Ihres Teams angepasste Dashboards oder Workflows ermöglichen. Überprüfen Sie vor der Umsetzung den Integrationsprozess, die verfügbare Dokumentation und den Support des Anbieters, um eine reibungslose Einrichtung und minimale Ausfallzeiten zu gewährleisten.
Wie helfen Tools zur Analyse des Kundenerlebnisses, die Abwanderung zu verringern?
Tools zur Analyse des Kundenerlebnisses helfen dabei, gefährdete Kunden frühzeitig durch die Auswertung von Verhaltensmustern, Nutzungsdaten und Feedback-Trends zu erkennen. Beispielsweise signalisiert das Tool, wenn nach bestimmten Produktänderungen die Interaktionen abnehmen oder sich negative Bewertungen häufen – und Ihr Team kann schnell eingreifen. Sie können automatisierte Benachrichtigungen für wichtige Indikatoren wie gestiegene Beschwerderaten oder sinkende NPS-Werte einrichten, die sofortige Nachverfolgung auslösen. Einige Plattformen bieten auch prädiktive Analysen, um Nutzer mit hoher Abwanderungsgefahr zu identifizieren, damit gezielte, vorausschauende Maßnahmen möglich sind. Wenn Sie Erkenntnisse konsequent in konkrete Schritte wie den Ausbau von Self-Service-Angeboten oder gezielte Schulung des Supports umsetzen, können Sie die Abwanderung an der Wurzel bekämpfen und die Kundenbindung erhöhen.
Gibt es Datenschutz- oder Compliance-Bedenken bei Tools für Kundenerlebnis-Analysen?
Ja, Datenschutz und Compliance sollten immer oberste Priorität haben, wenn Sie Kundendaten mit Analytics-Tools bearbeiten. Suchen Sie nach Plattformen, die zertifiziert für die jeweils geltenden Datenschutzvorschriften sind — etwa die DSGVO in der EU oder CCPA in Kalifornien. Achten Sie auf Funktionen wie sichere Datenspeicherung, strukturierte Zugriffskontrollen und Transparenzoptionen wie Consent-Management. Sprechen Sie mit dem Anbieter ggf. auch über Hosting-Regionen, besonders wenn Ihre Kunden weltweit verteilt sind. Prüfen Sie im Detail, wie die Plattform Daten erhebt, verarbeitet und weitergibt, und binden Sie Ihr Rechts- und IT-Team in die Auswahl ein. Bevorzugen Sie Anbieter, die klare Dokumentationen und Unterstützung für Compliance-Audits anbieten, um Risiken zu minimieren.
Wie setzen Unternehmen Daten und Analysen ein, um das Kundenerlebnis zu verbessern?
Unternehmen nutzen Tools zur Analyse des Kundenerlebnisses, um in Echtzeit Feedback zu sammeln, Customer Journeys zu visualisieren und Trends zu erkennen, die zuvor nicht sichtbar waren. Zum Beispiel analysieren Einzelhändler Support-Tickets und Web-Interaktionen, um zu identifizieren, wo Kunden steckenbleiben, und passen daraufhin Produktseiten oder Support-Prozesse an. SaaS-Unternehmen nutzen Sentiment-Analysen, um steigende Unzufriedenheit frühzeitig zu erkennen und durch gezielte Maßnahmen Abwanderungen vorzubeugen. Viele CX-Verantwortliche integrieren Analyse-Daten mit CRM- und Marketing-Automatisierung, um Kontaktpunkte gezielt zu personalisieren und Beschwerden schneller zu adressieren. Indem Unternehmen Erkenntnisse in konkrete, nachvollziehbare Maßnahmen umsetzen, schließen sie Lücken im Kundenerlebnis und fördern die Kundenbindung.
Weitere Bewertungen von Tools für Kundenerlebnisse
Bevor Sie den Tab wechseln, finden Sie hier ein paar tolle Beiträge, mit denen Sie Ihre Kunden besser kennenlernen können:
- Kunden-Intelligence-Plattformen
- Software für das Management der Kundenerfahrung
- VOC-Software für Kundenanalysen
- Software zur qualitativen Datenanalyse
- Kundenfeedback-Software
- Software für Kundenbindung
- Software für Kundenbeziehungsmanagement
- Software für Kundenflussmanagement
Fazit
Tools für Analysen der Kundenerfahrung sind unverzichtbar für Teammitglieder, die personalisierte Erlebnisse bieten möchten. Diese Tools verwenden Umfragevorlagen, um Feedback effizient zu sammeln, was Unternehmen dabei unterstützt, die Erwartungen der Kunden besser zu verstehen. Durch die Integration von Content-Management und die Analyse von Kundeninteraktionen helfen diese Tools dabei, wichtige Berührungspunkte mit Kunden zu identifizieren.
Die effektive Sammlung von Feedback und Nachverfolgungen wird durch fortschrittliche Management-Tools optimiert und steigert die Kundenbindung. Mit Hilfe von maschinellem Lernen können diese Tools Trends vorhersagen und Interaktionen personalisieren, sodass die Kundenerwartungen kontinuierlich erfüllt werden. Letztlich ermöglichen diese Analyse-Tools Teams, Feedback in umsetzbare Erkenntnisse zu verwandeln und die gesamte Customer Journey zu verbessern.
Vergessen Sie nicht, unseren Newsletter zu abonnieren, um weitere Lösungen und Strategien von führenden Experten für Kundenerlebnisse zu erhalten.